


The Fed added Quantitative Easing (QE) to its monetary policy toolbox in 2008. At the time, the financial system was imploding. Fed Chair Ben Bernanke bought $1.5 trillion U.S. Treasury and mortgage-backed securities to staunch a financial disaster. The drastic action was sold to the public as a one-time, emergency operation to stabilize the banking system and economy. Since the initial round of QE, there have been four additional rounds, culminating with the mind-boggling $5 trillion operation in 2020 and 2021.
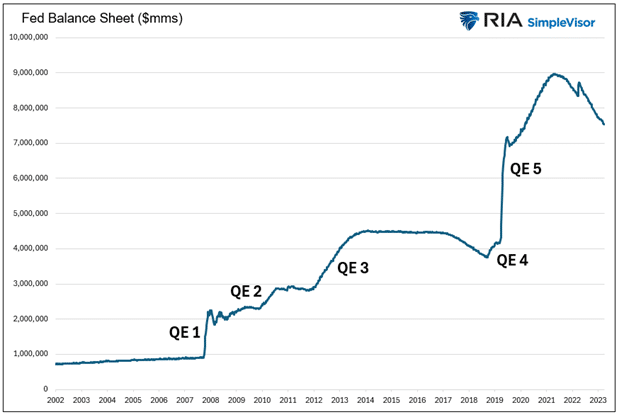
QE is no longer a tool for handling a crisis. It has morphed into a policy to ensure the government can fund itself. However, as we are learning today, QE has its faults. For example, it’s not an appropriate policy in times of high inflation like we have.
That doesn’t mean the Fed can’t provide liquidity to help the Treasury fund the government’s deficits. They just need to be more creative. To that end, rumors are floating around that a new variation of QE will help bridge potential liquidity shortfalls.
The Sad Fiscal Situation
The Federal government now pays over $1 trillion in interest expenses annually. Before they spend a dime on the military, social welfare, or the tens of thousands of other expenditures, one-third of the government’s tax revenue pays for the interest on the $34 trillion in debt, representing deficits of years and decades past.
There are many ways to address deficits and overwhelming debt, such as spending cuts or higher taxes. While logical approaches, politicians favor more debt. Let’s face it: winning an election on the promise of spending cuts and tax increases is hard. It’s even harder to keep your seat in Congress if you try to enact such changes.
More recently, the Federal Reserve has been forced to help fund today’s deficits and those of years past. We can debate the merits of such irresponsible behavior all day, but for investors, it’s much more critical to assess how the Fed and Treasury might keep the debt scheme going when QE is not an option.

Borrowing For Deficits
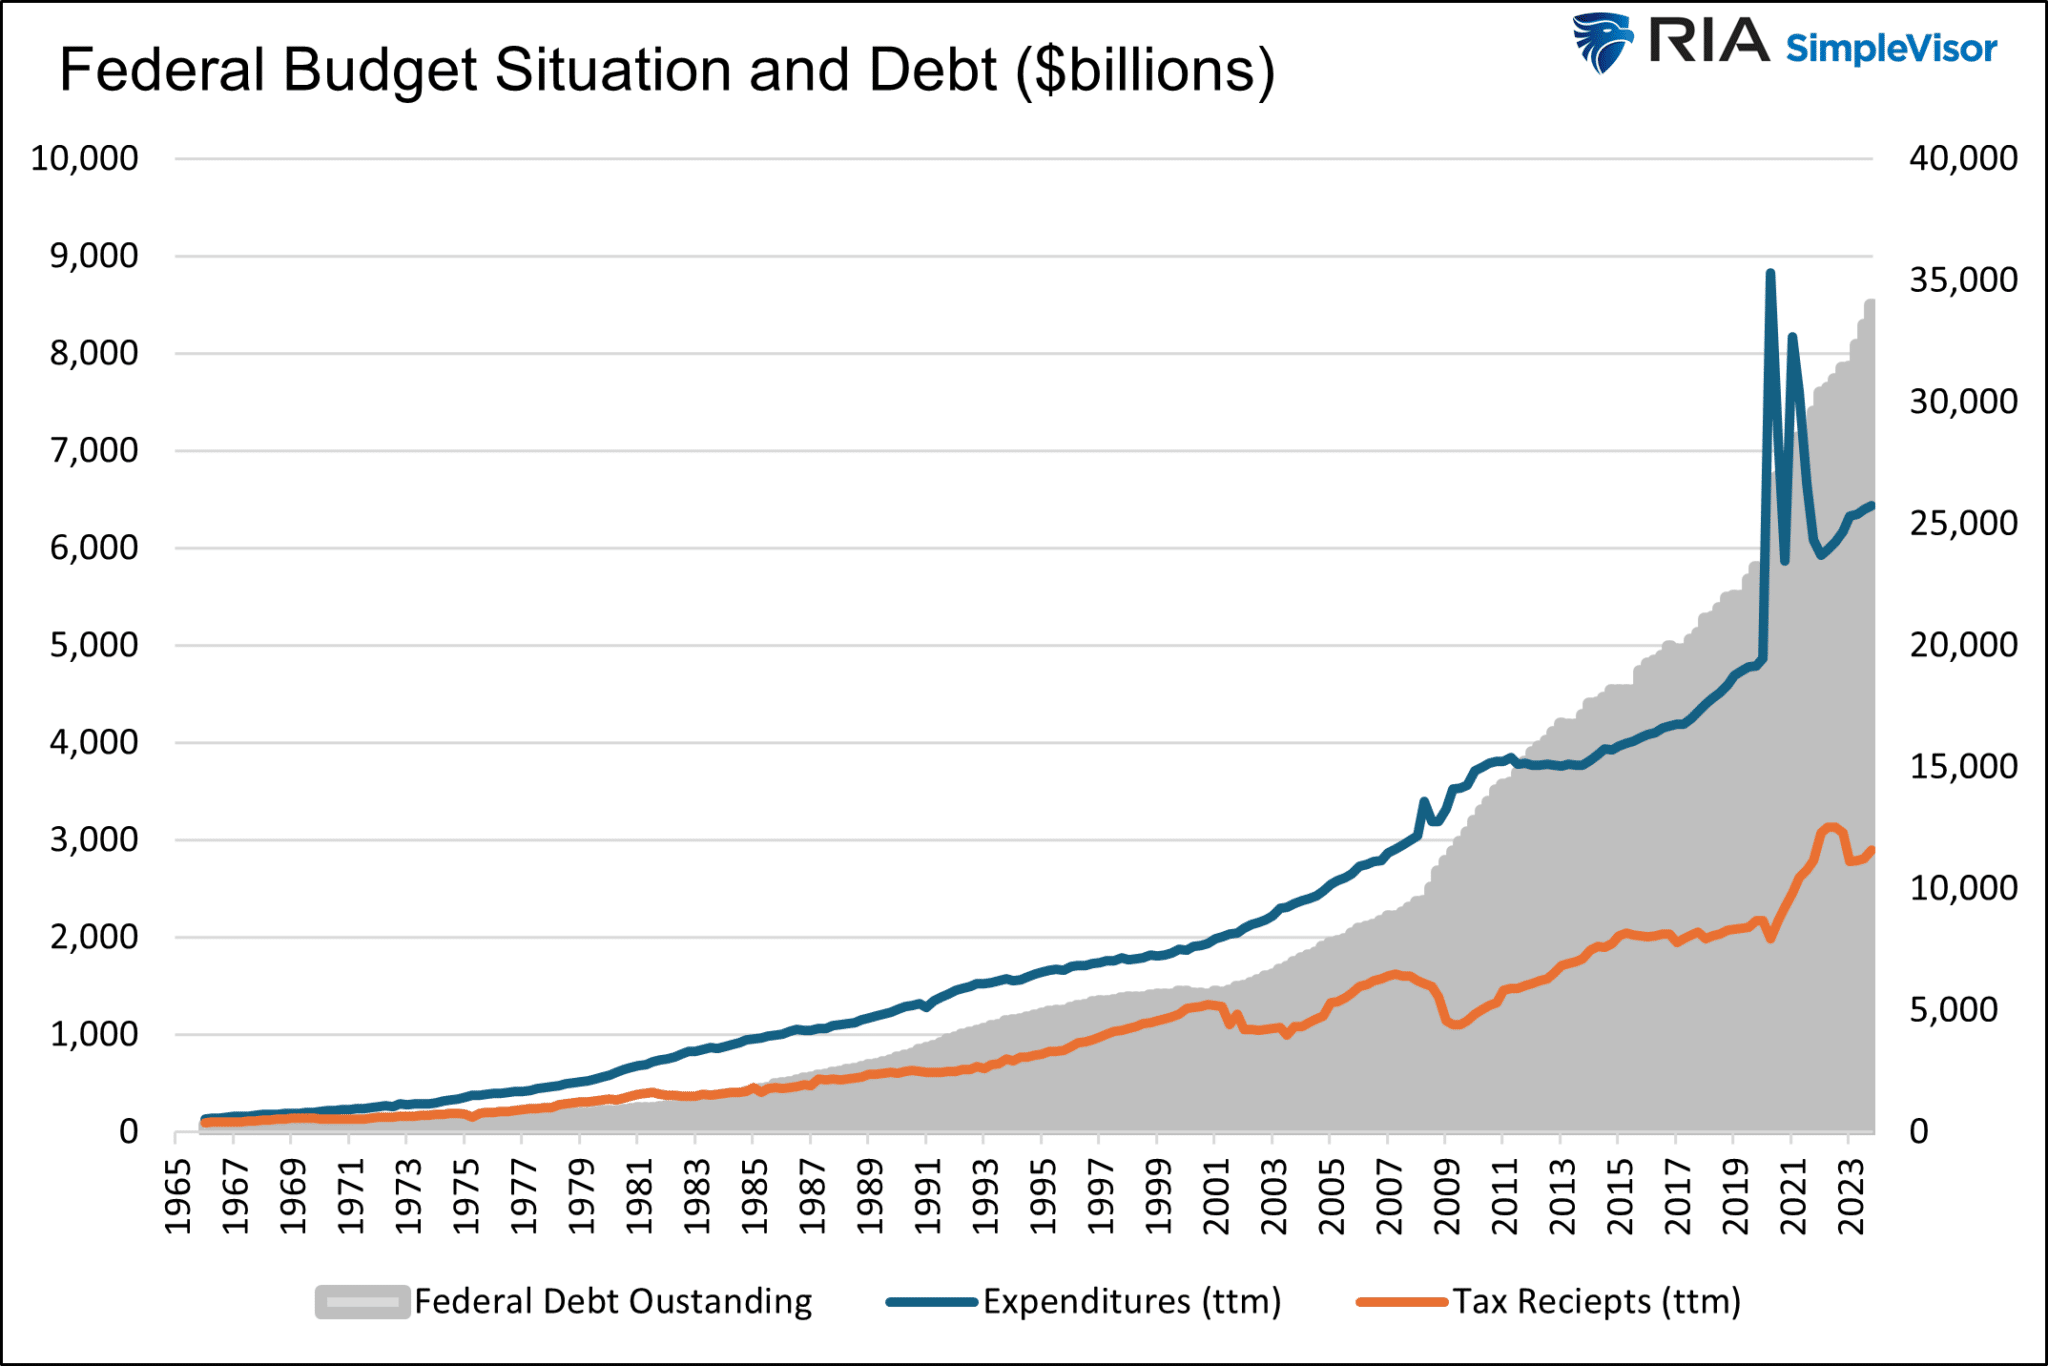
Before spreading rumors about a new variation of QE, let’s review the problem. The graph below shows the widening gap between federal spending and tax receipts. Literally, the gap between the two lines amounts to the cumulative Federal deficit. Instead of plotting deficit data, we prefer outstanding total federal debt as it better represents the cumulative onus of deficits.
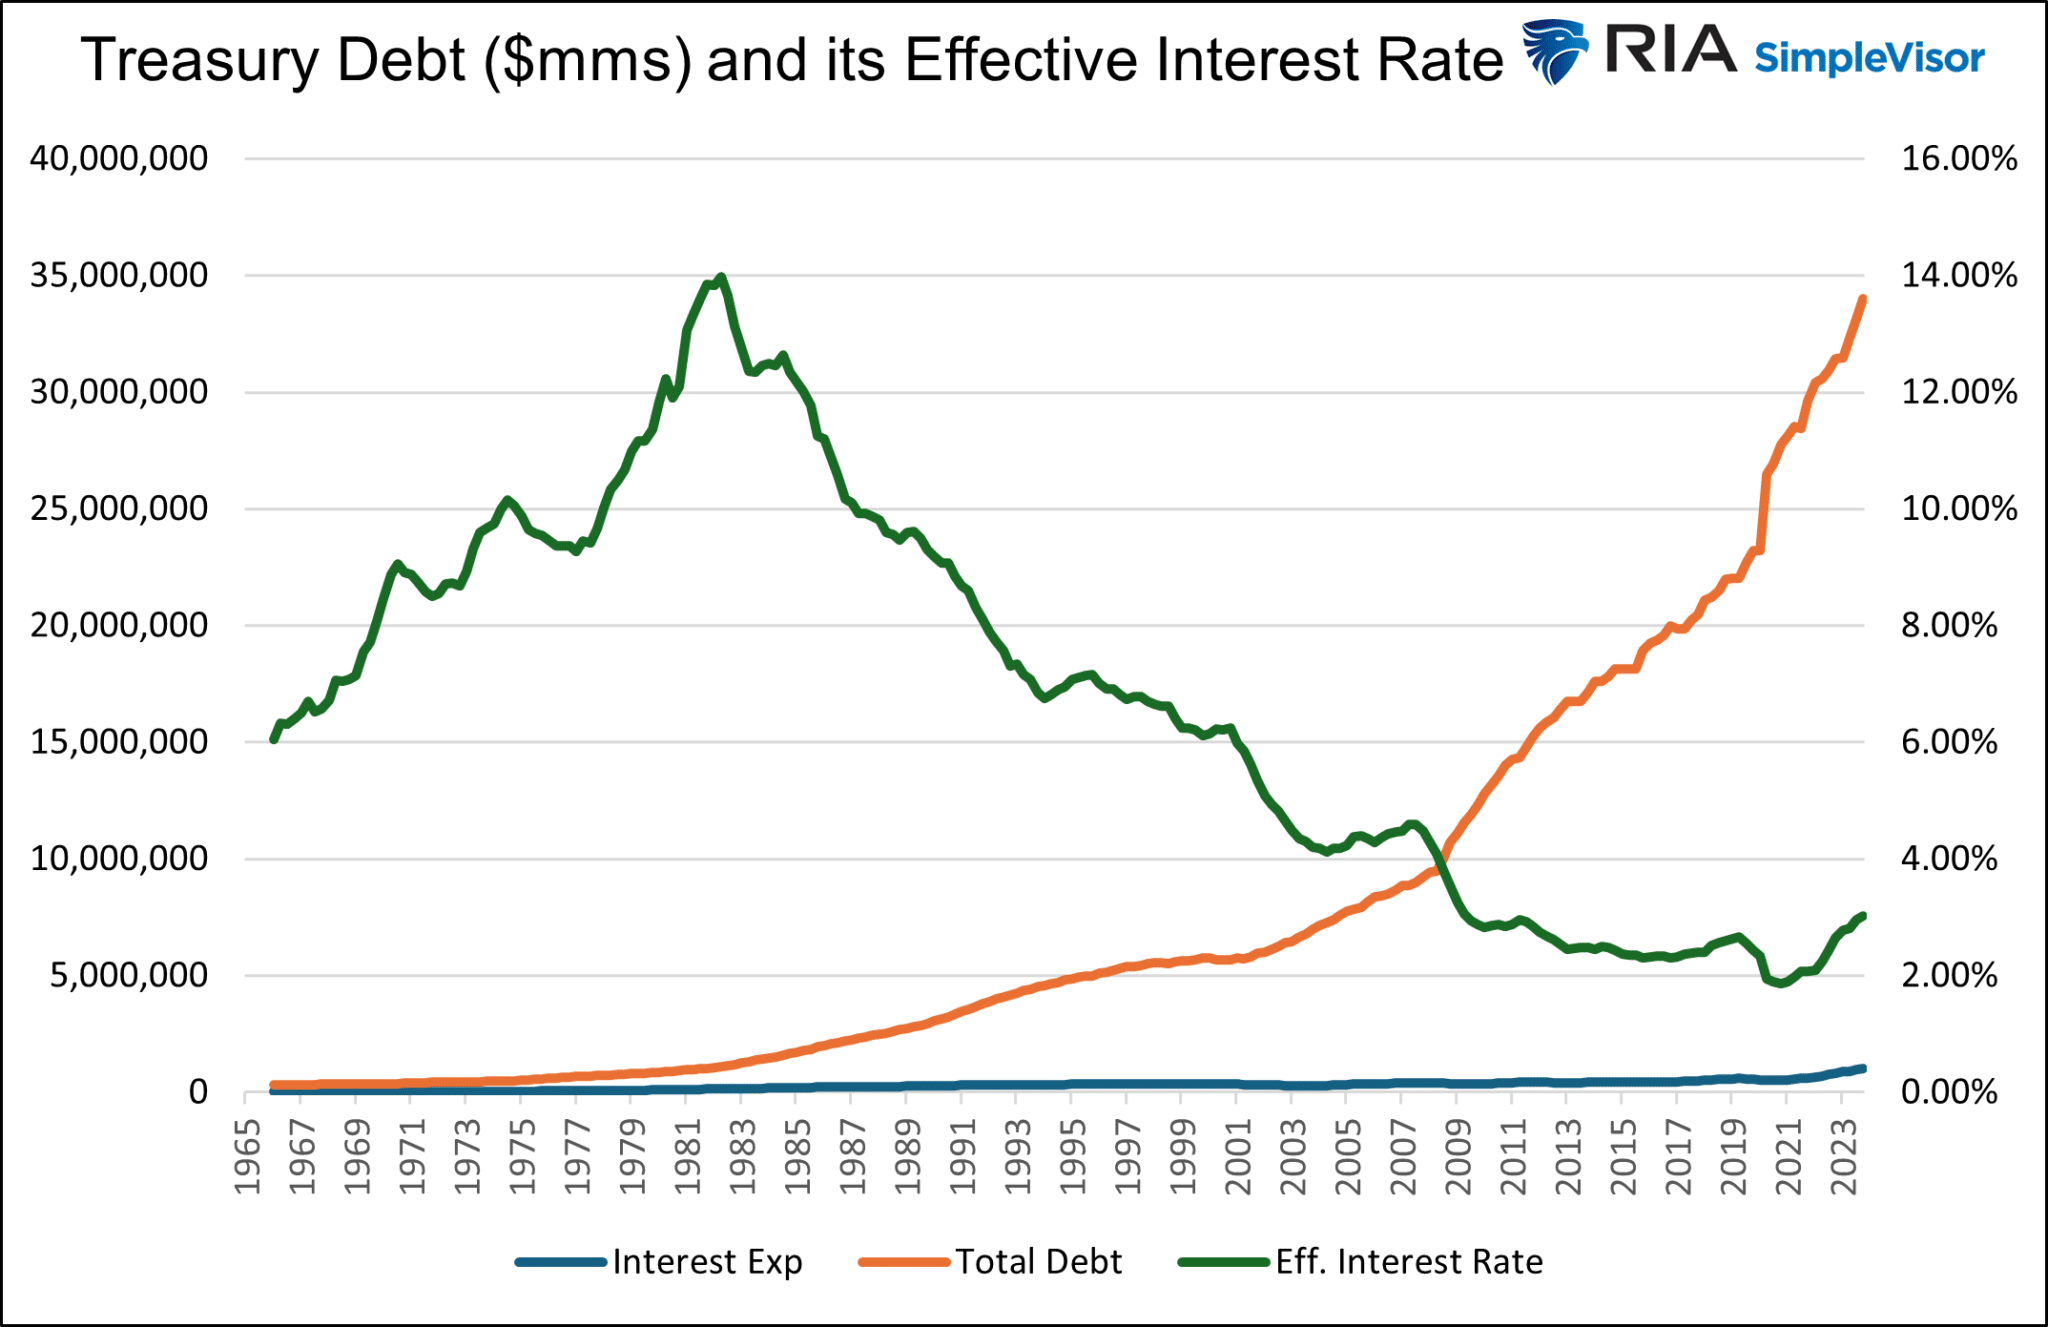
The graph below shows the Treasury debt has grown annually for the last 57 years by about 1.5% more than the interest expense. Such may not seem like a lot, but 57 years of compounding makes a big difference.
Declining interest rates for the last 40+ years are to thank for the differential. The green line shows the effective interest rate has steadily dropped until recently. Even with the current instance of higher interest rates, the effective interest rate is only 3.00%.
Fiscal Dominance
The Fed has been increasingly pressed to help the U.S. Treasury maintain the ability to fund its debt at reasonable interest rates. In addition to presiding over lower-than-normal interest rates for the last 30 years, QE helps the cause. By removing Treasury and mortgage-backed securities from the market, the market can more easily absorb new Treasury issuance.
Fiscal dominance, as we are experiencing, occurs when monetary policy helps the Treasury fund its debts. Per The CATO Institute:
Fiscal dominance occurs when central banks use their monetary powers to support the prices of government securities and to peg interest rates at low levels to reduce the costs of servicing sovereign debt.

2019 Revisited
In 2019, before the massive pandemic-related deficits, government spending ramped up over the prior few years due to higher spending and tax cuts. In September 2019, the repo markets strained under the pressure of the growing Treasury demands. The banks had plenty of securities but no cash to lend. For more information on the incident and the importance of liquidity in maintaining financial stability, please read our article, Liquidity Problems.
When a bank, broker, or investor can’t borrow money despite being willing to post U.S. Treasury collateral, that is a clear sign that the banking system lacks liquidity. That is exactly what happened in 2019.
The Fed came to the rescue, offering QE and lowering interest rates.
Shortly later, in March 2020, government spending blossomed with the pandemic, and the Fed was quick to help. As we shared earlier, the Fed, via QE, removed over $5 trillion of assets from the financial markets. That amount was on par with the surge of government debt.
The Fed is mandated to manage policy to achieve maximum employment and stable prices. Mandated or not, recent experiences demonstrate the Fed has become the de facto lender to the Treasury, albeit indirectly.
The Fed Is In Handcuffs
While Jerome Powell and the Fed might like to help the government meet their exorbitant funding needs with lower interest rates and QE, they are shackled. Higher inflation resulting from the pandemic and fiscal and monetary policies force them to reduce their balance sheet and keep rates abnormally high.
Unfortunately, as we wrote in Liquidity Problems, the issuance of Treasury debt rapidly drains excess liquidity from the system.
While the Fed hesitates to cut rates or do QE, they may have another trick up their sleeve.
Spreading Rumors
The following is based on rumors from numerous sources about what the Fed and banking regulators may do to alleviate funding pressures and liquidity shortfalls.
Banks have regulatory limits on the amount of leverage they can employ. The amount is set by the type and riskiness of assets they hold. For instance, U.S. Treasuries can be leveraged more than a loan to small businesses. A dollar of a bank deposit may allow a bank to buy $5 of a Treasury note but only lend $3 to a riskier borrower.
The regulatory structure currently recognizes eight Global Systematically Important Banks (GSIB). They are as follows: Bank of America, The Bank of New York, Citigroup, Goldman Sachs, JPMorgan Chase, Morgan Stanley, State Street, and Wells Fargo & Company.
Rumor has it that the regulators could eliminate leverage requirements for the GSIBs. Doing so would infinitely expand their capacity to own Treasury securities. That may sound like a perfect solution, but there are two problems: the banks must be able to fund the Treasury assets and avoid losing money on them.

BTFP To The Rescue Again
A year ago, the Fed created the Bank Term Funding Program (BTFP) to bail out banks with underwater securities. The program allowed banks to pledge underwater Treasury assets to the Fed. In exchange, the Fed would loan them money equal to the bond’s par value, even though the bonds were trading at discounts to par.
Remember, since 2008, banks no longer have to book gains or losses on assets unless they are impaired or sold.
In a new scheme, bank regulators could eliminate the need for GSIBs to hold capital against Treasury securities while the Fed reenacts some version of BTFP. Under such a regime, the banks could buy Treasury notes and fund them via the BTFP. If the borrowing rate is less than the bond yield, they make money and, therefore, should be very willing to participate, as there is potentially no downside.
The Fed still uses its balance sheet in this scheme, but it could sell it to the public as a non-inflationary action, as it did in March 2023 when the BTFP was introduced.
Summary
The federal government’s escalating debt and interest expenses underscore the challenges posed by prolonged deficit spending. The problem has forced the Fed to help the Treasury meet its burgeoning needs. The situation becomes more evident with each passing day.
The recently closed BTFP program and rumors about leverage requirements provide insight into how the Fed might accomplish this tall task while maintaining its hawkish anti-inflationary policy stance.


Michael Lebowitz, CFA is an Investment Analyst and Portfolio Manager for RIA Advisors. specializing in macroeconomic research, valuations, asset allocation, and risk management. RIA Contributing Editor and Research Director. CFA is an Investment Analyst and Portfolio Manager; Co-founder of 720 Global Research.
Follow Michael on Twitter or go to 720global.com for more research and analysis.
Customer Relationship Summary (Form CRS)
Also Read


