Too often, we tend to focus on individual stocks and other investments that will hopefully lead to wealth.
While that is O.K., it isn’t enough.
The issue is investing without a sound “plan” is the same as building a house without a “blueprint.” Yes, you will get something, but it probably won’t be the result you set out to get.
Be A Rooftop Thinker!
By starting with a proper plan you take into account all assets, liabilities and sources of income. From there it becomes much easier to focus on the investments YOU NEED to meet your financial goals.
Work from rooftop to basement for financial success!
Investment Manager, Lance Roberts and Certified Financial Planner, Richard Rosso we’ll help you understand:
How proper Social Security and Medicare strategies can boost retirement income,
Our concept of financial life benchmarking which is there to help you become more self aware of your financial goals, wants and needs,
How using the wrong, or enthusiastic investment returns can place your retirement in jeopardy,
When housing decisions in retirement can affect your quality of life, and;
The art of talking about your gifting and estate intentions with loved ones.
This 30-minute webinar can keep your from making costly investment mistakes and help bring clarity to your future financial plan.
If you would like to access this recorded webinar please click here.
Anatomy of The Bear. Lessons from Russell Napier.
One of my annual re-reads is Russell Napier’s classic tome “Anatomy of the Bear.”
A mandatory study for every financial professional and investor who seeks to understand not only how damaging bear markets can be but also the traits which mark their bottoms. Every bear is shaken from hibernation for different reasons. However, when studying the four great bottoms of bears in 1921, 1932, 1949 and 1982, there are several common traits to these horrendous cycles. I thought it would be interesting to share them with you.
First, keep in mind, bear markets characteristically purge weakness – weak companies, weak advisors, weak investors. I want you to consider them less a bloodletting and more a cleansing of a system. There will be unsuitable investors who will never return to the market and justifiably so. Businesses that were patronized pre-Covid, will either be gone or completely reinvent. Bear markets slash equity valuations. Unfortunately, this doesn’t mean that stocks return to healthy valuations quickly after a bear departure. Some believe the global economy can turn on and off like a light switch without major repercussions. In other words, the belief is once the worst of this horrid virus ceases, business activity invariably will return to normal. I believe it’ll be quite the contrary.
I mentioned on the radio show in December that I expected wage growth to top out in 2019. Keep in mind, through this yet another outlier economic upheaval, there will be employers who will realize they don’t require as many employees and will let them go or cap their wages for years to rebuild profit margins. Without the tailwind of stock buybacks to equity prices, corporate employees will bear the brunt of the pain. In addition, organizations will realize many of their remaining employees are equipped to work from home and perhaps gather in-person perhaps once a month or every couple of weeks. Thus, large commercial space will no longer be required which is going to require massive reinvention by the commercial real estate industry.
The cry of nationalism will rise. Products manufactured overseas especially China, will take a hit which means Americans will face greater inflationary challenges while also dealing with muted or non-existent wage growth. We will experience ‘ more money chasing too-few goods.’ Many, especially younger generations will continue to strip themselves down to basics (I especially envision this in Generation Z; those born in the mid-late 1990s such as my daughter Haley). This sea-change will require most of the U.S. population to finally live below their means, dramatically downsize, reinvent, expand, the definition of wealth to include more holistic, ethereal methods that go way beyond household balance sheets and dollars.
I hope I’m wrong. So very wrong about most of what I envision for the future.
Here are several traits that every major market bottom share – courtesy of Russell Napier:
Bears tend to die on low volume, at least the big bears do.
Low volume represents a complete disinterest in stocks. Keep in mind this clearly contradicts the tenet which states that bears end with one act of massive capitulation – a downward cascade on great volume. Those actions tend to mark the beginning of a bear cycle, not the end. A rise in volume on rebounds, falling volumes on weakness would better mark a bottoming process in a bear market.
2. Bears are tricky.
There will appear to be a recovery; an ‘all-clear’ for stock prices. It’ll suck in investors who believe the market recovery is upon us just to be financially ravaged again. Anecdotally, I know this cycle isn’t over as I still receive calls from people who are anxious to get into the market and perceive the current market a buying opportunity. At the bottom of a bear, I should be hearing great despair and clear disdain for stock investing.
3. Bears can be tenacious.
They refuse to die or at the least, quickly return to hibernation. The 1921 move from overvaluation to undervaluation took over ten years. Bear markets, where three-year price declines make overvalued equities cheap, are the exception, not the rule. As of this writing, the Shiller P/E is at 24x – hardly a bargain. At the bottom market cycle of the Great Recession, the Shiller CAPE was at 15x. There is still valuation adjustment ahead.
4. Bears can depart before earnings actually recover.
Investors who wait for a complete recovery in corporate earnings will arrive late to the stock-investment party. Most likely it’s going to take a while (especially with their debt burden), for the majority of U.S. companies to reflect healthy earnings growth. CEOs who employ stock buybacks to boost EPS will be considered pariahs and gain unwanted attention from Congress and even the Executive Branch. My thought is a savvy investor should look to minimize indexing and select individual stocks with strong balance sheets which include low debt and plenty of free cash flow within sectors and industries that are nimble to adjust to the global economy post-crisis.
5. Bear market damage can be inconceivable, especially to a generation of investors who never experienced one.
The bear market of 1929-32 was characterized by an 89% decline. The average is 38% for bears; however, averages are misleading. I have no idea how much damage this bear ultimately unleashes. The closest comparison I have is the 1929-1932 cycle. However, with the massive fiscal and monetary stimulus (and I don’t believe we’ve seen the full extent of it yet), my best guess is a bear market contraction somewhere between the Great Depression and Great Recession. At the least, I believe we re-test lows and this bear is a 40-45% retracement from the highs.
6. Bear markets end on the return of general price stability and strong demand for durables such as autos.
In 1949, as in 1921 and 1932, a return of general price stability coincided with the end of the equity bear market. Demand and price stability of selected commodities augured well for general price stabilization. Watch how industrial metals recover such as copper, now at the lowest levels since the fall of 2017. The Baltic Dry Index is off close to 20% so far this year. Low valuations (not there yet), when combined with a return to normalcy in the general price level, may provide the best opportunity for future above-average equity returns. We are not there.
7. Bear markets that no longer decline on bad news are a positive.
The combination of large short positions in conjunction with a market that fails to decline on bad news was overall a positive indicator of a rebound in 1921, 1932 and 1949. Also, limited stock purchases by retail investors may be considered an important building block for a bottom. Since the worst of economic numbers haven’t been witnessed yet, there remains too much hope of a vicious recovery in stock prices as well as the overall global economies.
8. Not all bear markets lead the economy by six-to-nine months.
Generally, markets lead the economy. However, this tenet failed to hold true for the four great bears. At extreme times, the bottoms for the economy and the equity market were aligned and in several cases, the economy LED stocks higher! It’s unclear whether this bear behaves in a similar fashion only because of massive fiscal and monetary stimulus. We’re not done with stimulus methods either. If anything, they’ve just begun! I know. Tough to fathom.
For me and the RIA Team, every bear provides an important lesson. The beast comes in all sizes; their claws differ in sharpness. However, they are all dangerous to financial wealth.
I believe the market will eventually witness a “V” shaped recovery due to unprecedented stimulus. Unfortunately, I believe the economy will remain sub-par for a long period. Here’s a vision I shared on Facebook recently:
Let me give you one example how an economy cannot turn off, then on, like a light switch.
Joe’s Donuts is closed. Joe lets his 2 employees go, at least temporarily. Joe employs his wife Emily to assist as she’s just been laid off from her job. Joe is a quick thinker. He creates pre-packaged dough-to-go bags and sells them outside the store. His sales are off 75% as most businesses around him are shuttered. Joe was able to negotiate postponement of his rent for one month but will have to pay two months in May.
Joe has a profitable business but he’s already eaten through a quarter of his cash reserves to pay for supplies, maintain expenses to keep going. He can’t afford another month of quarantine.
The quarantine is lifted May 1 (best case scenario). Joe’s establishment is open! He’s hesitant to have employees return because he wants to gauge business for a month. He discovers that business is still off 40% from last year at the same time. Why? Because his patrons have either been let go or in repair of ravaged household balance sheets. In addition, he notices that purchasing boxes of donuts for office meetings is way off.
Joe contacts his former 2 employees. He tells them he still doesn’t require them. He’s handling the traffic sufficiently alone at this time. Joe now owes 2 months of rent. He takes one month from the business’ reserve account; distributes another from his retirement account.
Joe’s wife Ellen has been called back to work by her former employer, a local car dealership. She’s been asked to work the same job, same responsibilities. However, the pay is 10% less. Out of desperation, she takes the job. Meanwhile, Joe tells Ellen that they need to find a way to continue to cut household expenses…. Well, you get the picture.
I think this is reality for at least a year after the ‘all clear.’
There’s never been a better time to catch up on reading. Russell’s book is available through Amazon. For those interested in market history, the pages hold invaluable insights.
For me, markets are always battlefields, but I’ve survived several conflicts.
Consider “Anatomy of The Bear,” part of your financial literary war chest.
Bull Market? No, The Bear Still Rules For Now (Full Report)
The “2020 SOCIALLY DISTANT INVESTMENT SUMMIT” is coming on Thursday, April 2nd.
Click the link below to receive an email with a special “invitation only” link when the summit goes “live.” (Current newsletter subscribers are already registered.)
Catch Up On What You Missed Last Week
NOTE: During these tumultuous times, we are unlocking our full newsletter to help you navigate the markets safely. Make sure you subscribe toRIAPRO.NET (Free 30-Day Trial) if you want to keep receiving the full report after the storm passes.
“From a purely technical basis, the extreme downside extension, and potential selling exhaustion, has set the markets up for a fairly strong reflexive bounce. This is where fun with math comes in.
As shown in the chart below, after a 35% decline in the markets from the previous highs, a rally to the 38.2% Fibonacci retracement would encompass a 20% advance.
Such an advance will ‘lure’ investors back into the market, thinking the ‘bear market’ is over.”
Chart Updated Through Friday
Not surprisingly, here were the headlines, almost exactly as we wrote them:
Well, you get the idea.
While it was indeed a sharp “reflex rally,” and expected, “bear markets” are not resolved in a single month. More importantly, “bear markets” only end when “NO ONE wants to buy it.”
Fed Can’t Fix It
As noted above, the “bear market” will NOT be over until the credit market is fixed. We are a long way from that being done, given the blowout in yields currently occurring.
The Fed has cut rates by 150 basis points to near zero and run through its entire 2008 crisis handbook.
That wasn’t enough to calm markets, though — so the central bank also announced $1 trillion a day in repurchase agreements and unlimited quantitative easing, which includes a hard-to-understand $625 billion of bond-buying a week going forward. At this rate, the Fed will own two-thirds of the Treasury market in a year.
But it’s the alphabet soup of new programs that deserve special consideration, as they could have profound long-term consequences for the functioning of the Fed and the allocation of capital in financial markets. Specifically, these are:
CPFF (Commercial Paper Funding Facility) – buying commercial paper from the issuer.
PMCCF (Primary Market Corporate Credit Facility) – buying corporate bonds from the issuer.
SMCCF (Secondary Market Corporate Credit Facility) – buying corporate bonds and bond ETFs in the secondary market.
MSBLP (Main Street Business Lending Program) – Details are to come, but it will lend to eligible small and medium-sized businesses, complementing efforts by the Small Business Association.
To put it bluntly, the Fed isn’t allowed to do any of this.”
However, on Friday, the Federal Reserve ran into a problem, which could poses a risk for the markets going forward. As Jim noted, the mind-boggling pace of bond purchases quickly hit the limits of what was available to pledge for collateral.
Or rather, the Fed’s “unlimited QE,” may not be so “unlimited” after all.
The consequence is the Fed is already having to start cutting back on its QE program. That news fueled the late-day sell-off Friday afternoon. (Charts courtesy of Zerohedge)
While Congress did pass the “CARES” act on Friday, it will do little to backstop what is about to happen to the economy for two primary reasons:
The package will only support the economy for up to two months. Unfortunately, there is no framework for effective and timely deployment; firms are already struggling to pay rents, there are pockets of funding stress in credit markets as default risks build, and earnings guidance is abandoned.
The unprecedented uncertainty facing financial markets on the duration of social distancing, the depth of the economic shock and when the infection rate curve will flatten, and there are many unknowns which will further undermine confidence.
Both of these points are addressed in this week’s Macroview but here are the two salient points to support my statement:
“Most importantly, as shown below, the majority of businesses will run out of money long before SBA loans, or financial assistance, can be provided. This will lead to higher and longer-duration of, unemployment.”
“While there is much hope that the current ‘economic shutdown’ will end quickly, we are still very early in the infection cycle relative to other countries. Importantly, we are substantially larger than most, and on a GDP basis, the damage will be worse.”
What the cycle tells us is that jobless claims, unemployment, and economic growth are going to worsen materially over the next couple of quarters.
The problem with the current economic backdrop, and mounting job losses, is the vast majority of American’s were woefully unprepared for any type of disruption to their income going into the recession. As job losses mount, a virtual spiral in the economy begins as reductions in spending put further pressures on corporate profitability. Lower profits leads to higher unemployment and lower asset prices until the cycle is complete.
The long term bull pattern that existed since the 3/9/09 is over. That means the pattern of investors confidently buying every decline is over.
The market became historically oversold on 3/23 using many metrics, and that oversold condition coincided with the long term support area of S&P 500 2110-2180.
The short-covering and rebalancing had a lot to do with the size and speed of the 3-day rally. Also, we know the lack of ETF liquidity played a huge role as well as algorithmic trading.
Technically the market can still go up 6.9% higher from here to hit the 50% retracement level (3386 – 2237 = 1149/2 = 574 + 2237 = 2811….2811/2630 = +6.9%.) I would not bet on it.
The market only sustains a rally once there is light at the Coronavirus tunnel.
I do not think the S&P 500 will hit a new high this year. Maybe not in 2021, either.
His analysis agrees with our own, which we discussed with you last week.
“The good news is the markets are now more extremely oversold on a variety of measures than at just about any other point in history.
Warning: Any reversal will NOT BE the bear market bottom. It will be a ‘bear market’ rally you will want to ‘sell’ into. The reason is there are still many investors trapped in ‘buy and hold’ and ‘passive indexing’ strategies that are actively seeking an exit. Any rallies will be met with redemptions.
Most importantly, all of our long-term weekly ‘sell signals’ have now been triggered. Such would suggest that a rally back to the ‘bullish trend line’ from 2009 will likely be the best opportunity to ‘sell’ before the ‘bear market’ finds its final low.”
Last week’s chart updated through Friday’s close.
While the recent lows may indeed turn out to be “the bottom,” I highly suspect they won’t. Given the sell signals have been registered at such high levels, the time, and distance, needed to reverse the excesses will require a deeper market draw.
As Jeff Hirsch from Stocktrader’s Alamanc noted:
“While we are all rooting for the market to find support here so much damage has been done. A great deal of uncertainty remains for the economy and health crisis. This looks like a bear market bounce.
History suggests that we are in for some tough sledding in the market this year with quite a bit of chop. When the January Barometer came in with a negative reading, our outlook for 2020 began to diminish as every down January since 1950 has been followed by a new or continuing bear market, a 10% correction, or a flat year. Then another warning sign flashed when DJIA closed below its December closing low on February 26, 2020 as the impact of this novel coronavirus began to take its toll on Wall Street.
In the March Outlook, we presented this graph of the composite seasonal pattern for the 22 years since 1950 when both the January Barometer as measured by the S&P 500 were down, and the Dow closed below its previous December closing low in the first quarter. Below is a graph of DJIA, S&P 500 and NASDAQ Composite for 2020 year-to-date as of the close on March 25. Comparing 2020 market action to these 22 years, suggests a choppy year ahead with the potential for several tests of the recent low.”
“The depth of this waterfall decline may be too deep for the market to rebound quickly. This bear market also put this year’s Best Six Months (November-April) at risk of being negative. The record of down Best Six Months is not encouraging and it reminds us of a salient quote from the Almanac from an old market sage,
‘If the market does not rally, as it should during bullish seasonal periods, it is a sign that other forces are stronger and that when the seasonal period ends those forces will really have their say.’— Edson Gould (Stock market analyst, Findings & Forecasts, 1902-1987)'”
On a short-term basis, the market is also suggesting some risk. The daily chart below shows the market rallied to, and failed at, the first level of the Fibonacci retracement we outlined last week, suggesting profits be taken at this level. While there are two remaining targets for the bear market rally, the probabilities weigh heavily against them. (This doesn’t mean they can’t be achieved, it is “possible,” just not “probable.”)
Furthermore, with the “Death Cross” triggering on Friday (the 50-dma crossing below the 200-dma), this will put further downside pressure on any “bear market” advance from current levels.
Given the magnitude, and multiple confirmations, of these signals, it is far too soon to assume the “bear market” is over. This is particularly the case, given the sell-off is less than one-month-old.
Bear markets, and recessions, tend to last 18-months on average.
The current bear market and recession are not the results of just the “coronavirus” shock. It is the result of many simultaneous shocks from:
Economic disruption
Surging unemployment
Oil price shock
Collapsing consumer confidence, and
Most importantly, a “credit event.”
We likely have more to go before we can safely assume we have turned the corner.
In the meantime, use rallies to raise cash. Don’t worry about trying to “buy the bottom.”There will be plenty of time to see “THE” bottom is in, and having cash will allow you to “buy stocks” from the last of the “weak hands.”
The MacroView
If you need help or have questions, we are always glad to help. Just email me.
See You Next Week
By Lance Roberts, CIO
Market & Sector Analysis
Data Analysis Of The Market & Sectors For Traders
S&P 500 Tear Sheet
Performance Analysis
Technical Composite
Note: The technical gauge bounced from the lowest level since both the “Dot.com” and “Financial Crisis.” However, note the gauge bottoms BEFORE the market bottoms. In 2002, lows were retested. In 2008, there was an additional 22% decline in early 2009.
ETF Model Relative Performance Analysis
Sector & Market Analysis:
Be sure and catch our updates on Major Markets (Monday) and Major Sectors (Tuesday) with updated buy/stop/sell levels
Sector-by-Sector
Finally, the markets bounced this past week.
However, don’t get too excited; there has been a tremendous amount of technical damage done which keeps us on the sidelines for now.
Improving – Discretionary (XLY), and Real Estate (XLRE)
We previously reduced our weightings to Real Estate and liquidated Discretionary entirely over concerns of the virus and impact on the economy. No change this week. We are getting more interested in REITs again, but are going to select individual holdings versus the ETF due to leverage concerns in the REITs.
Discretionary is going to remain under pressure due to people being able to go out and shop. This sector will eventually get a bid, so we are watching it, but we need to see an eventual end to the isolation of consumers.
Early last week, we shifted exposures in portfolios and added to our Technology and Communications sectors, bringing them up to weight. We also added QQQ, which was closed out on Friday.
Current Positions: XLK, XLC, 1/2 weight XLP, XLV
Weakening – None
No sectors in this quadrant.
Current Position: None
Lagging – Industrials (XLI), Financials (XLF), Materials (XLB), and Energy (XLE)
No change from last week, with the exception that performance continued to be worse than the overall market.
These sectors are THE most sensitive to Fed actions (XLF) and the shutdown of the economy. We eliminated all holdings in late February and early March.
Current Position: None
Market By Market
Small-Cap (SLY) and Mid Cap (MDY) – Four weeks ago, we sold all small-cap and mid-cap exposure over concerns of the impact of the coronavirus. We remain out of these sectors for now.
Current Position: None
Emerging, International (EEM) & Total International Markets (EFA)
Same as small-cap and mid-cap. Given the spread of the virus and the impact on the global supply chain. Trading opportunities only.
Current Position: None
S&P 500 Index (Core Holding) – Given the rapid deterioration of the broad market, we sold our entire core position holdings for the safety of cash. We did add a small trading position in QQQ on Monday afternoon, and sold it on Friday.
Current Position: None
Gold (GLD) – We added a small position in GDX recently, and increased our position in IAU early this week. With the Fed going crazy with liquidity, this will be good for gold long-term, so we continue to add to our holdings on corrections.
Bonds regained their footing this week, as the Fed became the “buyer” of both “first” and “last” resort. Simply, “bonds will not be allowed to default,” as the Fed will guarantee payments to creditors. We have now reduced our total bond exposure to 20% of the portfolio from 40% since we are only carrying 10% equity currently. (Rebalanced our hedge.)
Current Positions: SHY, IEF, BIL
Sector / Market Recommendations
The table below shows thoughts on specific actions related to the current market environment.
(These are not recommendations or solicitations to take any action. This is for informational purposes only related to market extremes and contrarian positioning within portfolios. Use at your own risk and peril.)
Portfolio/Client Update:
Despite the headlines of the “biggest rally in history” this past week, it’s easy to get sucked into the “Media headline” hype. However, let’s put this into some perspective:
Over the last “X” days the S&P 500 is:
5-days: +10.2%
6-days: +5.4%
10-days: -6.25%
It is much less exciting when compared to the fastest 30% plunge in history.
Keeping some perspective on where we are currently is very important. It’s easy to get swayed by the media headlines, which can lead us into making emotional investment mistakes. More often than not, emotional decisions turn out poorly.
We are starting our process of adding equities to the ETF models. As we head out of this bear market, ETF’s will have less value relative to our selective strategies.
This doesn’t mean we won’t use ETF’s at all, but we will selectively use them to fill in gaps to our individual equity selection, or for short-term trading opportunities.
Such was the case on Monday when we took on a position in QQQ for a bounce, and was subsequently closed out on Friday.
We also added small holdings of CLX and MRK to our long-term equity portfolio, as well as increased our exposure to IAU.
We continue to remain very defensive, and are in an excellent position with plenty of cash, reduced bond holdings, and minimal equity exposure in companies we want to own for the next 10-years.
We are just patiently waiting for the right opportunity to buy large chunks of these holdings with both stable, and higher yields.
Let me repeat from last week:
The ONLY people who care more about your money than you, is all of us at RIA Advisors.
We will NOT “buy the bottom” of the market. We will buy when we SEE the bottom of the market is in and risk/reward ratios are clearly in our favor.
This has been THE fastest bear market in history. We are doing our best to preserve your capital so that you meet your financial goals. Bear markets are never fun, but they are necessary for future gains.
We’ve got this.
Please don’t hesitate to contact us if you have any questions, or concerns.
Lance Roberts
CIO
THE REAL 401k PLAN MANAGER
A Conservative Strategy For Long-Term Investors
Model performance is based on a two-asset model of stocks and bonds relative to the weighting changes made each week in the newsletter. This is strictly for informational and educational purposes only and should not be relied upon for any reason. Past performance is not a guarantee of future results. Use at your own risk and peril.
401k Plan Manager Live Model
As an RIA PRO subscriber(You get your first 30-days free) you have access to our live 401k p
The code will give you access to the entire site during the 401k-BETA testing process, so not only will you get to help us work out the bugs on the 401k plan manager, you can submit your comments about the rest of the site as well.
We are building models specific to company plans. So, if you would like to see your company plan included specifically, send me the following:
Name of the company
Plan Sponsor
A print out of your plan choices. (Fund Symbol and Fund Name)
If you would like to offer our service to your employees at a deeply discounted corporate rate, please contact me.
The “2020 SOCIALLY DISTANT INVESTMENT SUMMIT” is coming on Thursday, April 2nd.
Click the link below to receive an email with a special “invitation only” link when the summit goes “live.” (Current newsletter subscribers are already registered.)
“From a purely technical basis, the extreme downside extension, and potential selling exhaustion, has set the markets up for a fairly strong reflexive bounce. This is where fun with math comes in.
As shown in the chart below, after a 35% decline in the markets from the previous highs, a rally to the 38.2% Fibonacci retracement would encompass a 20% advance.
Such an advance will ‘lure’ investors back into the market, thinking the ‘bear market’ is over.”
Chart Updated Through Friday
Not surprisingly, here were the headlines, almost exactly as we wrote them:
Well, you get the idea.
While it was indeed a sharp “reflex rally,” and expected, “bear markets” are not resolved in a single month. More importantly, “bear markets” only end when “NO ONE wants to buy it.”
Fed Can’t Fix It
As noted above, the “bear market” will NOT be over until the credit market is fixed. We are a long way from that being done, given the blowout in yields currently occurring.
The Fed has cut rates by 150 basis points to near zero and run through its entire 2008 crisis handbook.
That wasn’t enough to calm markets, though — so the central bank also announced $1 trillion a day in repurchase agreements and unlimited quantitative easing, which includes a hard-to-understand $625 billion of bond-buying a week going forward. At this rate, the Fed will own two-thirds of the Treasury market in a year.
But it’s the alphabet soup of new programs that deserve special consideration, as they could have profound long-term consequences for the functioning of the Fed and the allocation of capital in financial markets. Specifically, these are:
CPFF (Commercial Paper Funding Facility) – buying commercial paper from the issuer.
PMCCF (Primary Market Corporate Credit Facility) – buying corporate bonds from the issuer.
SMCCF (Secondary Market Corporate Credit Facility) – buying corporate bonds and bond ETFs in the secondary market.
MSBLP (Main Street Business Lending Program) – Details are to come, but it will lend to eligible small and medium-sized businesses, complementing efforts by the Small Business Association.
To put it bluntly, the Fed isn’t allowed to do any of this.”
However, on Friday, the Federal Reserve ran into a problem, which could poses a risk for the markets going forward. As Jim noted, the mind-boggling pace of bond purchases quickly hit the limits of what was available to pledge for collateral.
Or rather, the Fed’s “unlimited QE,” may not be so “unlimited” after all.
The consequence is the Fed is already having to start cutting back on its QE program. That news fueled the late-day sell-off Friday afternoon. (Charts courtesy of Zerohedge)
While Congress did pass the “CARES” act on Friday, it will do little to backstop what is about to happen to the economy for two primary reasons:
The package will only support the economy for up to two months. Unfortunately, there is no framework for effective and timely deployment; firms are already struggling to pay rents, there are pockets of funding stress in credit markets as default risks build, and earnings guidance is abandoned.
The unprecedented uncertainty facing financial markets on the duration of social distancing, the depth of the economic shock and when the infection rate curve will flatten, and there are many unknowns which will further undermine confidence.
Both of these points are addressed in this week’s Macroview but here are the two salient points to support my statement:
“Most importantly, as shown below, the majority of businesses will run out of money long before SBA loans, or financial assistance, can be provided. This will lead to higher and longer-duration of, unemployment.”
“While there is much hope that the current ‘economic shutdown’ will end quickly, we are still very early in the infection cycle relative to other countries. Importantly, we are substantially larger than most, and on a GDP basis, the damage will be worse.”
What the cycle tells us is that jobless claims, unemployment, and economic growth are going to worsen materially over the next couple of quarters.
The problem with the current economic backdrop, and mounting job losses, is the vast majority of American’s were woefully unprepared for any type of disruption to their income going into the recession. As job losses mount, a virtual spiral in the economy begins as reductions in spending put further pressures on corporate profitability. Lower profits leads to higher unemployment and lower asset prices until the cycle is complete.
The long term bull pattern that existed since the 3/9/09 is over. That means the pattern of investors confidently buying every decline is over.
The market became historically oversold on 3/23 using many metrics, and that oversold condition coincided with the long term support area of S&P 500 2110-2180.
The short-covering and rebalancing had a lot to do with the size and speed of the 3-day rally. Also, we know the lack of ETF liquidity played a huge role as well as algorithmic trading.
Technically the market can still go up 6.9% higher from here to hit the 50% retracement level (3386 – 2237 = 1149/2 = 574 + 2237 = 2811….2811/2630 = +6.9%.) I would not bet on it.
The market only sustains a rally once there is light at the Coronavirus tunnel.
I do not think the S&P 500 will hit a new high this year. Maybe not in 2021, either.
His analysis agrees with our own, which we discussed with you last week.
“The good news is the markets are now more extremely oversold on a variety of measures than at just about any other point in history.
Warning: Any reversal will NOT BE the bear market bottom. It will be a ‘bear market’ rally you will want to ‘sell’ into. The reason is there are still many investors trapped in ‘buy and hold’ and ‘passive indexing’ strategies that are actively seeking an exit. Any rallies will be met with redemptions.
Most importantly, all of our long-term weekly ‘sell signals’ have now been triggered. Such would suggest that a rally back to the ‘bullish trend line’ from 2009 will likely be the best opportunity to ‘sell’ before the ‘bear market’ finds its final low.”
Last week’s chart updated through Friday’s close.
While the recent lows may indeed turn out to be “the bottom,” I highly suspect they won’t. Given the sell signals have been registered at such high levels, the time, and distance, needed to reverse the excesses will require a deeper market draw.
As Jeff Hirsch from Stocktrader’s Alamanc noted:
“While we are all rooting for the market to find support here so much damage has been done. A great deal of uncertainty remains for the economy and health crisis. This looks like a bear market bounce.
History suggests that we are in for some tough sledding in the market this year with quite a bit of chop. When the January Barometer came in with a negative reading, our outlook for 2020 began to diminish as every down January since 1950 has been followed by a new or continuing bear market, a 10% correction, or a flat year. Then another warning sign flashed when DJIA closed below its December closing low on February 26, 2020 as the impact of this novel coronavirus began to take its toll on Wall Street.
In the March Outlook, we presented this graph of the composite seasonal pattern for the 22 years since 1950 when both the January Barometer as measured by the S&P 500 were down, and the Dow closed below its previous December closing low in the first quarter. Below is a graph of DJIA, S&P 500 and NASDAQ Composite for 2020 year-to-date as of the close on March 25. Comparing 2020 market action to these 22 years, suggests a choppy year ahead with the potential for several tests of the recent low.”
“The depth of this waterfall decline may be too deep for the market to rebound quickly. This bear market also put this year’s Best Six Months (November-April) at risk of being negative. The record of down Best Six Months is not encouraging and it reminds us of a salient quote from the Almanac from an old market sage,
‘If the market does not rally, as it should during bullish seasonal periods, it is a sign that other forces are stronger and that when the seasonal period ends those forces will really have their say.’— Edson Gould (Stock market analyst, Findings & Forecasts, 1902-1987)'”
On a short-term basis, the market is also suggesting some risk. The daily chart below shows the market rallied to, and failed at, the first level of the Fibonacci retracement we outlined last week, suggesting profits be taken at this level. While there are two remaining targets for the bear market rally, the probabilities weigh heavily against them. (This doesn’t mean they can’t be achieved, it is “possible,” just not “probable.”)
Furthermore, with the “Death Cross” triggering on Friday (the 50-dma crossing below the 200-dma), this will put further downside pressure on any “bear market” advance from current levels.
Given the magnitude, and multiple confirmations, of these signals, it is far too soon to assume the “bear market” is over. This is particularly the case, given the sell-off is less than one-month-old.
Bear markets, and recessions, tend to last 18-months on average.
The current bear market and recession are not the results of just the “coronavirus” shock. It is the result of many simultaneous shocks from:
Economic disruption
Surging unemployment
Oil price shock
Collapsing consumer confidence, and
Most importantly, a “credit event.”
We likely have more to go before we can safely assume we have turned the corner.
In the meantime, use rallies to raise cash. Don’t worry about trying to “buy the bottom.”There will be plenty of time to see “THE” bottom is in, and having cash will allow you to “buy stocks” from the last of the “weak hands.”
The MacroView
If you need help or have questions, we are always glad to help. Just email me.
See You Next Week
By Lance Roberts, CIO
Market & Sector Analysis
Data Analysis Of The Market & Sectors For Traders
S&P 500 Tear Sheet
Performance Analysis
Technical Composite
Note: The technical gauge bounced from the lowest level since both the “Dot.com” and “Financial Crisis.” However, note the gauge bottoms BEFORE the market bottoms. In 2002, lows were retested. In 2008, there was an additional 22% decline in early 2009.
ETF Model Relative Performance Analysis
Sector & Market Analysis:
Be sure and catch our updates on Major Markets (Monday) and Major Sectors (Tuesday) with updated buy/stop/sell levels
Sector-by-Sector
Finally, the markets bounced this past week.
However, don’t get too excited; there has been a tremendous amount of technical damage done which keeps us on the sidelines for now.
Improving – Discretionary (XLY), and Real Estate (XLRE)
We previously reduced our weightings to Real Estate and liquidated Discretionary entirely over concerns of the virus and impact on the economy. No change this week. We are getting more interested in REITs again, but are going to select individual holdings versus the ETF due to leverage concerns in the REITs.
Discretionary is going to remain under pressure due to people being able to go out and shop. This sector will eventually get a bid, so we are watching it, but we need to see an eventual end to the isolation of consumers.
Early last week, we shifted exposures in portfolios and added to our Technology and Communications sectors, bringing them up to weight. We also added QQQ, which was closed out on Friday.
Current Positions: XLK, XLC, 1/2 weight XLP, XLV
Weakening – None
No sectors in this quadrant.
Current Position: None
Lagging – Industrials (XLI), Financials (XLF), Materials (XLB), and Energy (XLE)
No change from last week, with the exception that performance continued to be worse than the overall market.
These sectors are THE most sensitive to Fed actions (XLF) and the shutdown of the economy. We eliminated all holdings in late February and early March.
Current Position: None
Market By Market
Small-Cap (SLY) and Mid Cap (MDY) – Four weeks ago, we sold all small-cap and mid-cap exposure over concerns of the impact of the coronavirus. We remain out of these sectors for now.
Current Position: None
Emerging, International (EEM) & Total International Markets (EFA)
Same as small-cap and mid-cap. Given the spread of the virus and the impact on the global supply chain. Trading opportunities only.
Current Position: None
S&P 500 Index (Core Holding) – Given the rapid deterioration of the broad market, we sold our entire core position holdings for the safety of cash. We did add a small trading position in QQQ on Monday afternoon, and sold it on Friday.
Current Position: None
Gold (GLD) – We added a small position in GDX recently, and increased our position in IAU early this week. With the Fed going crazy with liquidity, this will be good for gold long-term, so we continue to add to our holdings on corrections.
Bonds regained their footing this week, as the Fed became the “buyer” of both “first” and “last” resort. Simply, “bonds will not be allowed to default,” as the Fed will guarantee payments to creditors. We have now reduced our total bond exposure to 20% of the portfolio from 40% since we are only carrying 10% equity currently. (Rebalanced our hedge.)
Current Positions: SHY, IEF, BIL
Sector / Market Recommendations
The table below shows thoughts on specific actions related to the current market environment.
(These are not recommendations or solicitations to take any action. This is for informational purposes only related to market extremes and contrarian positioning within portfolios. Use at your own risk and peril.)
Portfolio/Client Update:
Despite the headlines of the “biggest rally in history” this past week, it’s easy to get sucked into the “Media headline” hype. However, let’s put this into some perspective:
Over the last “X” days the S&P 500 is:
5-days: +10.2%
6-days: +5.4%
10-days: -6.25%
It is much less exciting when compared to the fastest 30% plunge in history.
Keeping some perspective on where we are currently is very important. It’s easy to get swayed by the media headlines, which can lead us into making emotional investment mistakes. More often than not, emotional decisions turn out poorly.
We are continuing our process of blending the Equity and ETF models. As we head out of this bear market, ETF’s will have much less value relative to our selective strategies.
This doesn’t mean we won’t use ETF’s at all, but we will selectively use them to fill in gaps to our individual equity selection, or for short-term trading opportunities.
Such was the case on Monday when we took on a position in QQQ for a bounce, and was subsequently closed out on Friday.
We also added small holdings of CLX and MRK to our long-term portfolio, as well as increased our exposure to IAU.
We continue to remain very defensive, and are in an excellent position with plenty of cash, reduced bond holdings, and minimal equity exposure in companies we want to own for the next 10-years.
We are just patiently waiting for the right opportunity to buy large chunks of these holdings with both stable, and higher yields.
Let me repeat from last week:
The ONLY people who care more about your money than you, is all of us at RIA Advisors.
We will NOT “buy the bottom” of the market. We will buy when we SEE the bottom of the market is in and risk/reward ratios are clearly in our favor.
This has been THE fastest bear market in history. We are doing our best to preserve your capital so that you meet your financial goals. Bear markets are never fun, but they are necessary for future gains.
We’ve got this.
Please don’t hesitate to contact us if you have any questions, or concerns.
Lance Roberts
CIO
THE REAL 401k PLAN MANAGER
A Conservative Strategy For Long-Term Investors
Model performance is based on a two-asset model of stocks and bonds relative to the weighting changes made each week in the newsletter. This is strictly for informational and educational purposes only and should not be relied upon for any reason. Past performance is not a guarantee of future results. Use at your own risk and peril.
401k Plan Manager Live Model
As an RIA PRO subscriber(You get your first 30-days free) you have access to our live 401k p
The code will give you access to the entire site during the 401k-BETA testing process, so not only will you get to help us work out the bugs on the 401k plan manager, you can submit your comments about the rest of the site as well.
We are building models specific to company plans. So, if you would like to see your company plan included specifically, send me the following:
Name of the company
Plan Sponsor
A print out of your plan choices. (Fund Symbol and Fund Name)
If you would like to offer our service to your employees at a deeply discounted corporate rate, please contact me.
Technically Speaking: The One Thing – Playing The “Bear Market” Rally.
Let’s flashback to a time not so long ago, May 2019.
“It was interesting to see Federal Reserve Chairman Jerome Powell, during an address to the Fernandina Beach banking conference, channel Ben Bernanke during his speech on corporate ‘sub-prime’ debt (aka leveraged loans.)
‘Many commentators have observed with a sense of déjà vu the buildup of risky business debt over the past few years. The acronyms have changed a bit—’CLOs’ (collateralized loan obligations) instead of ‘CDOs’ (collateralized debt obligations), for example—but once again, we see a category of debt that is growing faster than the income of the borrowers even as lenders loosen underwriting standards. Likewise, much of the borrowing is financed opaquely, outside the banking system. Many are asking whether these developments pose a new threat to financial stability.
In public discussion of this issue, views seem to range from ‘This is a rerun of the subprime mortgage crisis’ to ‘Nothing to worry about here.’ At the moment, the truth is likely somewhere in the middle. To preview my conclusions, as of now, business debt does not present the kind of elevated risks to the stability of the financial system that would lead to broad harm to households and businesses should conditions deteriorate.’ – Jerome Powell, May 2019
“Unfortunately, while Jerome Powell may be currently channeling Ben Bernanke to keep markets stabilized momentarily, the real risk is some unforeseen exogenous event, such as Deutsche Bank going bankrupt, that triggers a global credit contagion.”
While the “exogenous event” was a “virus,” it led to a “credit event” which has crippled markets globally, leading the Federal Reserve to throw everything possible at trying to stem the crisis. With the Fed’s balance sheet set to expand towards $10 Trillion, the Federal deficit to balloon to $4 trillion, it is “all hands on deck” to stop the next “Great Depression” before it takes hold.
However, this is what we have been warning about:
“Pay attention to the market. There action this year is very reminiscent of previous market topping processes. Tops are hard to identify during the process as ‘change happens slowly.’The mainstream media, economists, and Wall Street will dismiss pickup in volatility as simply a corrective process. But when the topping process completes, it will seem as if the change occurred ‘all at once.’
The same media which told you ‘not to worry,’ will now tell you ‘no one could have seen it coming.’”
The only question which remains to be answered is whether the MORE debt and monetary stimulus can fix a debt and monetary stimulus bubble?
In other words, can the Fed inflate the fourth bubble to offset the implosion of the third?
Think about the insanity of that statement, but that is what the markets, and the economy, are banking on.
We do expect that with the flood of fiscal and monetary stimulus, a “bear market rally” becomes a real probability, at least in the short-term.
How big of a rally? What should you do? These are the important points in today’s missive.
The One Thing
The “ONE Thing” you need to do TODAY, right now, is “accept” where you are.
What you had, what was lost, and the mistakes you made, CAN NOT be corrected. They are in the past. However, by hanging on to those “emotions,” we lock ourselves out of the ability to take actions that will begin the corrective process.
Let me dispel some myths:
“Hope” is not an investment strategy. Hanging on to some stock you lost money in waiting for it to “get back to even,” costs you opportunity.
You aren’t a loser. Whatever happened previously is over, and it doesn’t make you a “loser.” However, staying in losing positions or strategies will continue to cost you.
Selling does NOT lock in losses. The losses have already occurred. Selling, however, gives you the ability to take advantage of “opportunity” to begin the recovery process.
Okay, now that we have the right “mindset,” let’s take an educated guess on what happens next.
The current bear market is exhibiting many of the same “technical traits” as seen in both the “Dot.com” and “Financial Crisis.”
In each previous case, the market experienced a parabolic advance to the initial peak. A correction ensued, which was dismissed by the mainstream media, and investors alike, as just a “pause that refreshes.” They were seemingly proved correct as the markets rebounded shortly thereafter and even set all-time highs. Investors, complacent in the belief that “this time was different” (1999 – a new paradigm, 2007 – Goldilocks economy), continued to hold out hopes the bull market was set to continue.
That was a mistake.
Also, in each period, once the monthly “sell signal” was triggered from a high level, the ensuing correction process took months to complete. This not only reset the market, but valuations as well. In both previous periods, reflexive rallies occurred, which eventually failed. While the 2008 plunge following the Lehman crisis was most similar to the current environment, there was a brief rally following the passage of TARP, which sucked investors in before the additional 22% decline in the first two months of 2009.
Most importantly, the market got very oversold early in both previous bear markets, and stayed that way for the entirety of the bear market. Currently, the market has only just now gotten to a similar oversold condition.
What all the indicators currently suggest is that while the current correction has been swift and brutal, bear markets are not resolved in a single month.
This is going to take some time.
Bear Market Rally
Over the past couple of week’s, we have been talking about a potential reflexive bounce.
From a purely technical basis, the extreme downside extension, and potential selling exhaustion, has set the markets up for a fairly strong reflexive bounce. This is where fun with math comes in.
As shown in the chart below, after a 35% decline in the markets from the previous highs, a rally to the 38.2% Fibonacci retracement would encompass a 20% advance. Such an advance will “lure” investors back into the market, thinking the “bear market” is over.
This is what “bear market rallies” do, and generally inflict the most pain possible on unwitting investors. The reasons for this are many, but primarily investors who were trapped in the recent decline will use the rally to “flee” the markets permanently.
Chart Updated Through Monday
More importantly, as noted above, “bear markets” are not resolved in a single month. Currently, there are too many investors trying to figure out where “the bottom” is, so they can “buy” it.
Bear markets do not end in optimism; they end in despair.
Looking back at 2008, numerous indicators suggest the “bear market” has only just begun. While this does NOT rule out a fairly strong reflexive rally, it suggests that any rally will ultimately fail as the bear market completes its cycle.
This can be seen more clearly in the monthly chart below, which looks at both previous bull and bear markets using a Fibonacci retracement. As shown, from the peak of both previous bull market “bubbles,” the market reversed 61.8% of the advance during the “Dot.com” crash, and more than 100% of the advance during the “Financial Crisis.”
Given the current bull market cycle was longer, more levered, and more extended than both previous bull markets, a 38.2% decline is unlikely to fulfill the requirements of this reversion. Our ultimate target of 1600-1800 on the S&P 500 remains confirmed by the quarterly chart below.
The current correction process has only just triggered a quarterly sell signal combined with a break from an extreme deviation of the long-term bull-trend back to the 1930’s. Both previous bull market peaks coincide with the long-term bull trend at about 1600 on the S&P currently. Given all the stimulus being infused into the markets currently, we broaden our bear market bottom target to 1600-1800, as noted.
The technical signals, which do indeed lag short-term turns in the market, all confirm the “bear market” is only just awakening. While bullish reflexive rallies are very likely, and should be used to your advantage, this is a “traders” market for the time being.
In other words, the new mantra for the market, for the time being, will be to “Sell Rallies” rather than “Buy The Dip.”
As I have noted many times previously:
“This ‘time is not different,’ and there will be few investors that truly have the fortitude to ‘ride out’ the next decline.
Everyone eventually sells. The only difference is ‘selling when you want to,’ versus ‘selling when you have to.’”
Yes, the market will rally, and likely substantially so. Just don’t forget to take action, make changes, and get on the right side of the trade, before the “bear returns.”
Bear markets have three stages – sharp down, reflexive rebound and a drawn-out fundamental downtrend
Bear markets often START with a sharp and swift decline.
After this decline, there is an oversold bounce that retraces a portion of that decline.
The longer-term decline then continues, at a slower and more grinding pace, as the fundamentals deteriorate.
Dow Theory also suggests that bear markets consist of three down legs with reflexive rebounds in between.
The chart above shows the stages of the last two primary cyclical bear markets versus today (the 2020 scale has been adjusted to match.)
As would be expected, the “Phase 1” selloff has been brutal.
That selloff sets up a “reflexive bounce.” For many individuals, they will “feel like” they are “safe.” This is how “bear market rallies” lure investors back in just before they are mauled again in “Phase 3.”
Just like in 2000, and 2008, the media/Wall Street will be telling you to just “hold on.” Unfortunately, by the time “Phase 3” was finished, there was no one wanting to “buy” anything.
America: WILL WE FINALLY LEARN A LESSON?
“Much of what passes for orthodoxy in economics and finance proves, on closer examination, to be shaky business.” The Misbehavior of Markets – by Benoit Mandelbrot & Richard L. Hudson.
If as households we do crumble financially yet another time, will this ‘outlier’ event finally teach us a valuable lesson? One we’ll never forget (again)? I mean, how many Black Swans or events that create wholesale economic and financial devastation must we endure to work diligently, effortlessly, to shore up our family’s finances?
Unfortunately, as humans, we focus on risk and financial stability too late. Always. Too. Late. We are creatures of complacency and mainstream financial advice does nothing but fuel our overconfidence bias. Only when a storm is upon us, wreaking havoc, do we seek to board the windows and secure what’s important to us.
We’re cajoled by ‘experts’ during good times. We’re taught how outlier events occur every 1,000 years. Strange how rare occurrences aren’t so rare. They seem to happen every decade. So, let me ask you – How many times do these so-called ‘rare’ events need to occur before fiscal discipline becomes a priority for all of us?
Over the last three years, at RIA we have created several financial tenets to guard against financial vulnerability. I don’t mean to preach; I mean to teach.
I hope over the next few years, once this pandemic is past and we rummage through the economic rubble, we’ll take it upon ourselves to remain vigilant through the complacency and take the following rules to heart.
1. A painful reminder about the ‘buy and hold’ investment philosophy or whatever horrid expletive you’re probably calling it right now.
Never forget that convincing words, piles of academic studies and mined data from big-box financial retailers in pretty packages make it easy to share convincing stories to push stocks. Hopefully, investors who spent most of their time and money getting back to even remain comforted by the narratives. They’ll now do it again.
I’ll admit – I’m nonplussed by the appeal of buy-and-hold to the purists. I truly envy them.
It seems to be a “What Me Worry?” kind of existence. There seems to be an eerie comfort to throwing money into a black hole of overvalued investments and hoping that it transforms into a white light of wealth 20 years down the road (even if it’s a very dim bulb). I truly wish I could be convinced that a blind buy-and-hold fable is truth.
I so passionately want investors to achieve returns and exceed their financial life benchmarks or goals; it’s good for me too. I also would like to minimize the damage from bears. Is that too much to ask?
At Real Investment Advice we think it’s one of a money manager’s primary responsibilities.
Buy-and-hold at the core wrapped in rules of risk management is a healthy, long-term strategy to build and protect wealth. That’s what we’re doing at this juncture.
If you’re completely out of the market for an extended period, I mean zilch, zero, then stock investing may not be appropriate for you. Hey, it isn’t for everyone, especially today when the flood of central bank liquidity (I’ve never witnessed anything like it), algos (the robots), probably $4 trillion in fiscal stimulus coming, tries to stem the devastation. The bull market is dead, a bear is tricky to navigate. I am grateful to be a partner at a firm where all members understand the devastation of bear markets and are not ‘deer in headlights’ as this crisis is upon us. Take heart – the bear will die; the bull will run again. As investors we will bleed. The key is not to hemorrhage. There is a difference.
It’s not too late to undertake a quick gut check – Realize that an allocation of 10-20% to domestic and international stocks can drop 40% on average in bear markets. Investors fail to realize that diversifying between foreign and U.S. stocks doesn’t manage the risk they care about most – risk of principal loss. We are witnessing this now – one more time on the disaster hit parade. The world has become increasingly an Irwin Allen (The Poseidon Adventure; The Towering Inferno), film and we are the actors.
Let’s say your retirement plan balance is $90,000. In a conservative allocation, $18,000 (20%), may be allocated to stocks. If a bear cycle takes the stock balance down to $10,800 and makes you a bit queasy, then certainly the market doesn’t fit into your overall investment philosophy.
If you do have the intestinal fortitude to maintain an allocation to stocks, your financial partner is a buy-and-hold zealot (highly likely), and you haven’t taken profits (a tenet of risk management) or rebalanced this year, then there’s still an opportunity to do so on rallies. It’s acceptable to maintain additional cash as much as buy-and-hold purists abhor cash.
You’re not the ‘idiot’ who sells at the bottom just because you adhere to rules of risk management.
Granted, investors can be their worst emotional enemies. If risk management rules are employed as an integration to an overall investment process, then selling at the very bottom may be avoided. From my experience, the dumbest actions of those who did sell at the bottom in March 2009, rest almost solely on their brokers.
You see, if financial professionals would have empathized with their clients and took enough (any) action to preserve capital as clients were calling with concern in late 2007, maybe, just maybe, those distressed investors wouldn’t have sold out of everything pretty much at the bottom.
The advice “not to worry, markets always come back,” regurgitated repeatedly did nothing to allay concerns; frankly hollow words made brokers appear as if they employed market blinders or were in a state of denial. They appeared ignorant, not aware of the severity of the crisis.
I listened enough to begin surgically trimming positions (I explained to clients we sought to take a scalpel, not a machete to reducing stock exposure in portfolios), and was proactive to sell clients out of a Charles Schwab bond fund described as “stable in price,” an “alternative to cash,” in November 2007 when the mutual fund share price was doing nothing but faltering.
Although Schwab portfolio management assured us in the field repeatedly that there was “nothing wrong with the fund,” and it wasn’t suffering mass redemptions, it did eventually go bust and Schwab was held accountable for lack of oversight.
Unfortunately, the company got off easy as the settlement with the SEC was nothing but a financial slap on the wrist when the fund held $13.5 billion at its peak.
You tell me this stuff isn’t rigged against retail investors? I believe differently. I always will.
Proactive behavior allowed me to maintain a semblance of stock ownership and then begin to increase exposure through the summer of 2009. I deemed it buy-and-hold with a “protective twist.”
If your broker isn’t actively listening and is discounting concerns, it’s time to replace him or her. Answers received should be thorough and backed by analysis.
If you must invest today, consider dollar-cost averaging.
Usually, dollar-cost averaging where you add a fixed dollar amount to variable investments on a regular schedule, underperforms value or lump-sum investing. Unless the cyclically adjusted price-to-earnings ratio or CAPE exceeds 18.6 (today, it exceeds 25).
The other side of the coin of buy-and-hold isn’t active trading.
Cop out. Lame excuse. I can’t be clearer. Not only are you branded a ‘bear’ if you employ a sell discipline, it appears that the buy-and-hold purists can’t think outside of extremes. They tend to associate selling with active trading. It’s a clever ploy designed to avoid the conversation or even the thought of a sell process. It’s just impossible.
Not it isn’t. And it isn’t active trading either. Active trading isn’t going to generate returns, just activity. Plus, if you consider that trades cost ZERO at most big-box financial retailers, transaction costs aren’t a concern anymore.
For years, the investment industry has tried to scare clients into staying fully invested in the stock market, no matter how high stocks go or what’s going on in the economy. Investors are repeatedly warned that doing anything otherwise is simply foolish because “you can’t time the market.”
Here’s why per Lance Roberts:
“Wall Street firms, despite what the media advertising tells you, are businesses. As a business, their job is to develop and deliver products to investors in whatever form investor appetites demand…Wall Street is always happy to provide ‘products’ to the consumers they serve.
As Wall Street quickly figured out that it was far more lucrative to collect ongoing fees rather than a one-time trading commission…The mutual fund business was booming, and business was ‘brisk’ on Wall Street as profits surged.”
I’ll add:
Frankly, it’s too much work. Financial experts are primarily peddlers of managed products. They’re hired to regurgitate sell-side biased data mined from their employer’s research department. What they’re implying is they’re too busy meeting sales goals to consider risk management (the way you define it as an investor), important.
With that being said, consider other rules to protect your household for when the next ‘outlier’ event occurs (I mean, after this one).
2. The FVC – The Financial Vulnerability Cushion.
The main purpose of the Financial Vulnerability Cushion is to fortify the foundation of a financial house. You’ve heard about maintaining three to six months of living expenses in cash for emergencies. Well, define an emergency. The car breaks down, sure. The A/C goes out? Right. Expenses such as these fit well into a three to six-month cash cushion. However, Black Swan events remind us this cushion isn’t enough. We must finally learn to separate emergency from crisis.
Over the last six months we’ve been discussing on the radio how important it is to build a cash war chest of one to two years’ worth of living expenses and maintain it above everything else. These reserves are for crisis. A sudden job loss; major illness. Unfortunately, millions will be out of work here. Some, long term. I’m increasingly concerned about those who work in the energy sector. Never forget. Don’t listen to mainstream financial media again. Remember this time and work diligently to build a FVC.
3. Create financial rules around debt control and savings. Then stick to them. No matter what. Good times or bad.
Consider strict debt management and savings habits as the blend of robust soil which allows opportunities to be realized. Excessive debt and limited ability to buffer against financial emergencies and crisis can limit a person’s ability to take on riskier but rewarding ventures like career change, entrepreneurial endeavors and risks that may lead to significant, long-term wealth.
Student loan debt: Limited to one year’s worth of total expense, tuition, room & board, expenses.
Personal, unsecured debt (credit card, auto): No more than 25% of gross monthly household income.
4. Be smarter with credit.
Today, credit cards are used for various reasons – convenience, cash back, travel reward points and the most unfortunate, to meet ongoing living expenses in the face of structural wage stagnation. So, consider the following.
Credit Card Debt = No greater than 4% of monthly gross income.
If your household gross income is $50,000 then credit card debt shouldn’t exceed $2,000. Per WalletHub, Texas ranks 46 with $2,848 in average credit card debt.
Survival tip: Take control of your money. Contact your credit card provider today and request a lower interest rate, perhaps the favorable balance transfer rate along with delayed payments. We are in this catastrophe together and it’s the least they can do for at least the rest of the year.
Car Loan Debt-to-Income Ratio:
Cars are required like breathing here in Houston and Texas, overall. However, they are not investments. Their values do not appreciate. If anything, auto values decrease as soon as you drive away from the dealership.
Car Loan Obligation = No greater than 25% of monthly gross income.
For example, a household bringing in $60,000 a year shouldn’t have more than $15,000 in outstanding auto loan debt. In my household, the ratio is less than 10%. I drive a Toyota RAV4. Put your ego aside; consider reliability first.
As I complete interviews with media and news outlets in Houston and across the country, my heart is overwhelmed with sorrow for those who are suffering through this, yet another ‘rare’ historical episode.
Please reach out to our team with questions and for guidance.
Every question is a good question.
Never be afraid to ask.
Everyone Wanting To Buy Suggests The Bear Still Prowls (Full Report)
Everyone Wanting To Buy Suggests The Bear Still Prowls
NOTE: During these tumultuous times, we are unlocking our full newsletter to help you navigate the markets safely. Make sure you subscribe to RIAPRO.NET (Free 30-Day Trial) if you want to keep receiving the full report after the storm passes.
Everyone Wanting To Buy Suggests The Bear Still Prowls
“If you own 10% equities, as we do, and the market falls 100%, you will lose 10%. That said, you have 90 cents on the dollar to buy equities for free.” – Michael Lebowitz
For the last several months, we have been issuing repeated warnings about the market. While such comments are often mistaken for “being bearish,” we have often stated it is our process of managing “risk,” which is most important.
Beginning in mid-January, we began taking profits out of our portfolios and reducing risk. To wit:
‘On Friday, we began the orderly process of reducing exposure in our portfolios to take in profits, reduce portfolio risk, and raise cash levels.’
Importantly, we did not ‘sell everything’ and go to cash.
Since then, we took profits and rebalanced risk again in late January and early February as well.
On Friday/Monday, our ‘limits’ were breached, which required us to sell more.”
There are a couple of important things to understand about our current equity exposure.
To begin with, we never go to 100% cash. The reason is that “psychologically” it is too difficult for clients to start “buying” when the market finally bottoms. Seeing the market begin to recover, along with their portfolio, makes it easier to fight the fear the market is “going to zero.”
Secondly, and most importantly, at just 10% in current equity exposure, the market could literally fall 100% and our portfolios would only decline by 10%.(Of course, given we still have 90% of our capital left, we can buy a tremendous amount of “free assets.”)
Of course, the market isn’t going to zero.
However, let’s map out a more realistic example.
In this week’s MacroView, we discussed the “valuation” issue
“If our, and Mr. Rosenberg’s, estimates are correct of a 5-8% recessionary drag in the second quarter of 2020, then an average reduction in earnings of 30% is most likely overly optimistic.
However, here is the math:
Current Earnings = 132.90
30% Reduction = $100 (rounding down for easier math)
At various P/E multiples, we can predict where “fair value” for the market is based on historical assumptions:
20x earnings: Historically high but markets have traded at high valuations for the last decade.
18x earnings: Still historically high.
15x earnings: Long-Term Average
13x earnings: Undervalued
10x earnings: Extremely undervalued but aligned with secular bear market bottoms.
You can pick your own level where you think P/E’s will account for the global recession but the chart below prices it into the market.”
So, let’s assume our numbers are optimistically in the “ballpark” of a valuation reversion, and earnings are only cut by 30% while the market bottoms at 1800, or 18x earnings.(I say optimistically because normal valuation reversions are 15x earnings or less.)
Here’s the math:
For a “buy and hold” investor (who is already down 20-30% from the peak)will lose an additional 22%.
For a client with 10% equity exposure, they will lose an additional 2.2%.
When the market does eventually bottom, and it will, it will be far easier for our clients to recover 10% of their portfolio versus 50% for most “buy and hold” strategies.
As we have often stated, “getting back to even is not an investment strategy.”
Is The Bear Market Over?
This is THE QUESTION for investors. Here are a few articles from the past couple of days:
Bear markets have three stages – sharp down, reflexive rebound and a drawn-out fundamental downtrend – Rule #8
Bear markets often START with a sharp and swift decline.
After this decline, there is an oversold bounce that retraces a portion of that decline.
The longer-term decline then continues, at a slower and more grinding pace, as the fundamentals deteriorate.
Dow Theory also suggests that bear markets consist of three down legs with reflexive rebounds in between.
The chart above shows the stages of the last two primary cyclical bear markets versus today (the 2020 scale has been adjusted to match.)
The answer to the question is simply this:
“When is it time to start buying the market? When you do NOT want to.”
Bond Market Implosion
At the moment, the Federal Reserve is fighting a potentially losing battle – the bond market.
After cutting rates to zero and launching QE of $700 billion – the markets crashed.
The ECB starts an $800 billion QE program, and the markets fail to move.
The Fed injected liquidity into money markets, the credit market, and is buying municipal bonds.
And the market crashed more.
The Fed has literally turned on a “garden hose” to extinguish a literal “bon(d)fire.”
This was no more evident than their action this past week to revive a program from the financial crisis called the Primary Dealer Credit Facility (PDCF) to bailout hedge funds and banks. Via Mike Witney:
“The Fed is reopening its most controversial and despised crisis-era bailout facility, the Primary Dealer Credit Facility. The facility’s real purpose is to transfer the toxic bonds and securities from failing financial institutions and corporations (through an intermediary) onto the Fed’s balance sheet.
The objective of this sleight of hand is to recapitalize big investors who, through their own bad bets, are now either underwater or in deep trouble. Just like 2008, the Fed is now doing everything in its power to save its friends and mop up the ocean of red ink that was generated during the 10-year orgy of speculation that has ended in crashing markets and a wave of deflation. Check out this excerpt from an article at Wall Street on Parade. Here’s an excerpt:
“Veterans on Wall Street think of the PDCF as the cash-for-trash facility, where Wall Street’s toxic waste from a decade of irresponsible trading and lending, will be purged from the balance sheets of the Wall Street firms and handed over to the balance sheet of the Federal Reserve – just as it was during the last financial crisis on Wall Street.”
In other words, the PDCF is a landfill for distressed assets that have lost much of their value and for which there is little or no demand. And, as bad as that sounds, the details about the resuscitated PDCF are much worse.”
If you have any doubt how bad it is in the bond market, just take a look at what happened to both investment grade and junk bond spreads. (Charts courtesy of David Rosenberg)
As they say: “That clearly ain’t normal.”
More importantly, the “Bear Market” won’t be over until the credit markets get fixed.
Hunting The Bear
It was a pretty stunning week in the market. Over the last 5-days, the market declined an astonishing, or should I say breathtaking, 15%. The last time we saw a one week decline of that magnitude was during the “Lehman” crisis. (Of course, with hedge funds blowing up all week, this is precisely what the Fed has been bailing out.)
Since the peak of the market at the end of February, the market is now down a whopping 32%.
Surely, we are close to a bottom?
Let’s revisit our daily and weekly charts for some clues as to where we are, what could happen next, and what actions to take.
On a daily basis, the market is extremely stretched and deviated to the downside. Friday’s selloff smacked of an “Oriental Rug Company” where it was an “Everything Must Go Liquidation Event.”
Remember all those headlines from early this year:
Well….
This selloff completely reversed the entire advance from the 2018 lows. That’s the bad news.
The good news is the markets are now more extremely oversold on a variety of measures than at just about any other point in history.
Such a reversal, particularly given the “speed and magnitude” of the decline, argues for a “reversal” of some sort.
Warning: Any reversal will NOT BE the bear market bottom. It will be a “bear market” rally you will want to “sell” into. The reason is there are still many investors trapped in “buy and hold” and “passive indexing” strategies which are actively seeking an exit. Any rallies will be met with redemptions.
As noted above, bear markets do not end with investors wanting to “buy” the market. They end when “everyone wants to sell.”
And, NO, investors are “not different this time.”
This “bear market” rally scenario becomes more evident when we view our longer-term weekly “sell signals.” As we warned last week:
“With all of our signals now triggered from fairly high levels, it suggests the current selloff is not over as of yet. In other words, we will see a rally, followed by a secondary failure to lower lows, before the ultimate bottom is put in.”
Unfortunately, we have yet to see any attempt at a sustained rally.
More importantly, with the failure of the markets to hold lows this week, both of our long-term weekly “sell signals” have now been triggered. Such would suggest that a rally back to the “bullish trend line” from 2009 will likely be the best opportunity to “sell” before the “bear market” finds its final low.
Where will that low likely be:
Let’s update our mapping from last week:
A retest of current lows that holds is a 27% decline. – Failed
A retest of the 2018 lows, which is most likely, an average recessionary decline of 32.8% – Current
A retest of the 2016 lows, coincident with a “credit event,” would entail a 50.9% decline. – Pending Possibility.
Given the magnitude, and multiple confirmations, of these signals, it is far too soon to assume the “bear market” is over. This is particularly the case, given the selloff is less than one-month old.
Bear markets, and recessions, tend to last 18-months on average.
The current bear market and recession are not the result of just the “coronavirus” shock. It is the result of many simultaneous shocks from:
Economic disruption
Surging unemployment
Oil price shock
Collapsing consumer confidence, and
A “credit event.”
We likely have more to go before we can safely assume we have turned the corner.
In the meantime, use rallies to raise cash. Don’t worry about trying to “buy the bottom.”There will be plenty of time to see “THE” bottom is in, and having cash will allow you to “buy stocks” from the last of the “weak hands.”
The MacroView
If you need help or have questions, we are always glad to help. Just email me.
See You Next Week
By Lance Roberts, CIO
Market & Sector Analysis
Data Analysis Of The Market & Sectors For Traders
S&P 500 Tear Sheet
Performance Analysis
Technical Composite
Note: The technical gauge is now at the lowest level since both the “Dot.com” and “Financial Crisis.” However, note the gauge bottoms BEFORE the market bottoms. In 2002, lows were retested. In 2008, there was an additional 22% decline into early 2009.
ETF Model Relative Performance Analysis
Sector & Market Analysis:
Be sure and catch our updates on Major Markets (Monday) and Major Sectors (Tuesday) with updated buy/stop/sell levels
Sector-by-Sector
For the 3rd week in a row:
“Everything was crushed again this past week, so the difference between leading and lagging sectors is which sector fell faster or slower than the S&P 500 index itself.”
Improving – Discretionary (XLY), and Real Estate (XLRE)
We previously reduced our weightings to Real Estate and liquidated Discretionary entirely over concerns of the virus and impact to the economy. No change this week.
The correction in Technology last week broke support at the 200-dma but finished the week very close to the May 2019 lows. Communication and Utilities didn’t perform as well but also held up better during the decline on a relative basis. The same is true for Utilities and Staples. These are our core ETF’s right now at which we are carrying substantially reduced exposure.
Current Positions: 1/2 weight XLK, XLC, XLU, XLP, XLV
Weakening – None
No sectors in this quadrant.
Current Position: None
Lagging – Industrials (XLI), Financials (XLF), Materials (XLB), and Energy (XLE)
No change from last week, with the exception that performance continued to be worse than the overall market.
These sectors are THE most sensitive to Fed actions (XLF) and the shutdown of the economy. We eliminated all holdings in late February and early March.
Current Position: None
Market By Market
Small-Cap (SLY) and Mid Cap (MDY) – Three weeks ago, we sold all small-cap and mid-cap exposure over concerns of the impact of the coronavirus. Remain out of these sectors for now.
Current Position: None
Emerging, International (EEM) & Total International Markets (EFA)
Same as small-cap and mid-cap. Given the spread of the virus and the impact on the global supply chain. Trading opportunities only.
Current Position: None
S&P 500 Index (Core Holding) – Given the rapid deterioration of the broad market, we sold our entire core position holdings for the safety of cash.
Current Position: None
Gold (GLD) – Gold broke our stop, and we sold our holdings. We are now on the watch for an entry point if Gold can climb back above the 200-dma.
Bonds collapsed last week as the “credit event” we have been concerned about took shape. We had previously taken profits and reduced our bond holdings duration and increased credit quality. We have now reduced our total bond exposure to 20% of the portfolio from 40% since we are only carrying 10% equity currently. (Rebalanced our hedge.)
Current Positions: SHY, IEF, BIL
Sector / Market Recommendations
The table below shows thoughts on specific actions related to the current market environment.
(These are not recommendations or solicitations to take any action. This is for informational purposes only related to market extremes and contrarian positioning within portfolios. Use at your own risk and peril.)
Portfolio/Client Update:
I know it is ugly.
The S&P 500 is down nearly 32% in just three weeks.
That’s scary.
However, it is important to keep some perspective on where we are currently.
Last Monday, we further reduced our equity to just 10% (from 25% previously) of the portfolio
What does that mean? Here is some math:
If the market goes to ZERO from here, (it’s not going to) your MAXIMUM loss is just 10%.
This is recoverable, particularly if we could buy a portfolio of assets for FREE.
We currently expect a maximum decline from current levels of 20%. This would be a 2% net hit to portfolios leaving us with a LOT of cash to buy distressed assets at 50% off.
This is the opportunity we have been waiting for during the entire last decade.
Currently, we are busy rebuilding all of our portfolio models, rethinking risk management in a post-bear market environment, and what role the future of “fixed income” will play in asset allocations.
These are all essential questions that we need solid answers for.
We are in an excellent position with plenty of cash, reduced bond holdings, and minimal equity exposure in companies we want to own for the next 10-years. We are just patiently waiting to buy large chunks of these holdings soon with both stable and higher yields.
Let me assure you of four things;
The ONLY people who care more about your money than you, is all of us at RIA Advisors.
We will NOT “buy the bottom” of the market. We will buy when we SEE the bottom of the market is in and risk/reward ratios are clearly in our favor.
This has been THE fastest bear market in history. We are doing our best to preserve your capital so that you meet your financial goals. Bear markets are never fun, but they are necessary for future gains.
We’ve got this.
Please don’t hesitate to contact us if you have any questions, or concerns.
Lance Roberts
CIO
THE REAL 401k PLAN MANAGER
A Conservative Strategy For Long-Term Investors
Model performance is based on a two-asset model of stocks and bonds relative to the weighting changes made each week in the newsletter. This is strictly for informational and educational purposes only and should not be relied upon for any reason. Past performance is not a guarantee of future results. Use at your own risk and peril.
401k Plan Manager Live Model
As an RIA PRO subscriber(You get your first 30-days free) you have access to our live 401k p
The code will give you access to the entire site during the 401k-BETA testing process, so not only will you get to help us work out the bugs on the 401k plan manager, you can submit your comments about the rest of the site as well.
We are building models specific to company plans. So, if you would like to see your company plan included specifically, send me the following:
Name of the company
Plan Sponsor
A print out of your plan choices. (Fund Symbol and Fund Name)
If you would like to offer our service to your employees at a deeply discounted corporate rate, please contact me.
Everyone Wanting To Buy Suggests The Bear Still Prowls
Everyone Wanting To Buy Suggests The Bear Still Prowls
Everyone Wanting To Buy Suggests The Bear Still Prowls
“If you own 10% equities, as we do, and the market falls 100%, you will lose 10%. That said, you have 90 cents on the dollar to buy equities for free.” – Michael Lebowitz
For the last several months, we have been issuing repeated warnings about the market. While such comments are often mistaken for “being bearish,” we have often stated it is our process of managing “risk,” which is most important.
Beginning in mid-January, we began taking profits out of our portfolios and reducing risk. To wit:
‘On Friday, we began the orderly process of reducing exposure in our portfolios to take in profits, reduce portfolio risk, and raise cash levels.’
Importantly, we did not ‘sell everything’ and go to cash.
Since then, we took profits and rebalanced risk again in late January and early February as well.
On Friday/Monday, our ‘limits’ were breached, which required us to sell more.”
There are a couple of important things to understand about our current equity exposure.
To begin with, we never go to 100% cash. The reason is that “psychologically” it is too difficult for clients to start “buying” when the market finally bottoms. Seeing the market begin to recover, along with their portfolio, makes it easier to fight the fear the market is “going to zero.”
Secondly, and most importantly, at just 10% in current equity exposure, the market could literally fall 100% and our portfolios would only decline by 10%.(Of course, given we still have 90% of our capital left, we can buy a tremendous amount of “free assets.”)
Of course, the market isn’t going to zero.
However, let’s map out a more realistic example.
In this week’s MacroView, we discussed the “valuation” issue
“If our, and Mr. Rosenberg’s, estimates are correct of a 5-8% recessionary drag in the second quarter of 2020, then an average reduction in earnings of 30% is most likely overly optimistic.
However, here is the math:
Current Earnings = 132.90
30% Reduction = $100 (rounding down for easier math)
At various P/E multiples, we can predict where “fair value” for the market is based on historical assumptions:
20x earnings: Historically high but markets have traded at high valuations for the last decade.
18x earnings: Still historically high.
15x earnings: Long-Term Average
13x earnings: Undervalued
10x earnings: Extremely undervalued but aligned with secular bear market bottoms.
You can pick your own level where you think P/E’s will account for the global recession but the chart below prices it into the market.”
So, let’s assume our numbers are optimistically in the “ballpark” of a valuation reversion, and earnings are only cut by 30% while the market bottoms at 1800, or 18x earnings.(I say optimistically because normal valuation reversions are 15x earnings or less.)
Here’s the math:
For a “buy and hold” investor (who is already down 20-30% from the peak)will lose an additional 22%.
For a client with 10% equity exposure, they will lose an additional 2.2%.
When the market does eventually bottom, and it will, it will be far easier for our clients to recover 10% of their portfolio versus 50% for most “buy and hold” strategies.
As we have often stated, “getting back to even is not an investment strategy.”
Is The Bear Market Over?
This is THE QUESTION for investors. Here are a few articles from the past couple of days:
Bear markets have three stages – sharp down, reflexive rebound and a drawn-out fundamental downtrend – Rule #\8
Bear markets often START with a sharp and swift decline.
After this decline, there is an oversold bounce that retraces a portion of that decline.
The longer-term decline then continues, at a slower and more grinding pace, as the fundamentals deteriorate.
Dow Theory also suggests that bear markets consist of three down legs with reflexive rebounds in between.
The chart above shows the stages of the last two primary cyclical bear markets versus today (the 2020 scale has been adjusted to match.)
The answer to the question is simply this:
“When is it time to start buying the market? When you do NOT want to.”
Bond Market Implosion
At the moment, the Federal Reserve is fighting a potentially losing battle – the bond market.
After cutting rates to zero and launching QE of $700 billion – the markets crashed.
The ECB starts an $800 billion QE program, and the markets fail to move.
The Fed injected liquidity into money markets, the credit market, and is buying municipal bonds.
And the market crashed more.
The Fed has literally turned on a “garden hose” to extinguish a literal “bon(d)fire.”
This was no more evident than their action this past week to revive a program from the financial crisis called the Primary Dealer Credit Facility (PDCF) to bailout hedge funds and banks. Via Mike Witney:
“The Fed is reopening its most controversial and despised crisis-era bailout facility, the Primary Dealer Credit Facility. The facility’s real purpose is to transfer the toxic bonds and securities from failing financial institutions and corporations (through an intermediary) onto the Fed’s balance sheet.
The objective of this sleight of hand is to recapitalize big investors who, through their own bad bets, are now either underwater or in deep trouble. Just like 2008, the Fed is now doing everything in its power to save its friends and mop up the ocean of red ink that was generated during the 10-year orgy of speculation that has ended in crashing markets and a wave of deflation. Check out this excerpt from an article at Wall Street on Parade. Here’s an excerpt:
“Veterans on Wall Street think of the PDCF as the cash-for-trash facility, where Wall Street’s toxic waste from a decade of irresponsible trading and lending, will be purged from the balance sheets of the Wall Street firms and handed over to the balance sheet of the Federal Reserve – just as it was during the last financial crisis on Wall Street.”
In other words, the PDCF is a landfill for distressed assets that have lost much of their value and for which there is little or no demand. And, as bad as that sounds, the details about the resuscitated PDCF are much worse.”
If you have any doubt how bad it is in the bond market, just take a look at what happened to both investment grade and junk bond spreads. (Charts courtesy of David Rosenberg)
As they say: “That clearly ain’t normal.”
More importantly, the “Bear Market” won’t be over until the credit markets get fixed.
Hunting The Bear
It was a pretty stunning week in the market. Over the last 5-days, the market declined an astonishing, or should I say breathtaking, 15%. The last time we saw a one week decline of that magnitude was during the “Lehman” crisis. (Of course, with hedge funds blowing up all week, this is precisely what the Fed has been bailing out.)
Since the peak of the market at the end of February, the market is now down a whopping 32%.
Surely, we are close to a bottom?
Let’s revisit our daily and weekly charts for some clues as to where we are, what could happen next, and what actions to take.
On a daily basis, the market is extremely stretched and deviated to the downside. Friday’s selloff smacked of an “Oriental Rug Company” where it was an “Everything Must Go Liquidation Event.”
Remember all those headlines from early this year:
Well….
This selloff completely reversed the entire advance from the 2018 lows. That’s the bad news.
The good news is the markets are now more extremely oversold on a variety of measures than at just about any other point in history.
Such a reversal, particularly given the “speed and magnitude” of the decline, argues for a “reversal” of some sort.
Warning: Any reversal will NOT BE the bear market bottom. It will be a “bear market” rally you will want to “sell” into. The reason is there are still many investors trapped in “buy and hold” and “passive indexing” strategies which are actively seeking an exit. Any rallies will be met with redemptions.
As noted above, bear markets do not end with investors wanting to “buy” the market. They end when “everyone wants to sell.”
And, NO, investors are “not different this time.”
This “bear market” rally scenario becomes more evident when we view our longer-term weekly “sell signals.” As we warned last week:
“With all of our signals now triggered from fairly high levels, it suggests the current selloff is not over as of yet. In other words, we will see a rally, followed by a secondary failure to lower lows, before the ultimate bottom is put in.”
Unfortunately, we have yet to see any attempt at a sustained rally.
More importantly, with the failure of the markets to hold lows this week, both of our long-term weekly “sell signals” have now been triggered. Such would suggest that a rally back to the “bullish trend line” from 2009 will likely be the best opportunity to “sell” before the “bear market” finds its final low.
Where will that low likely be:
Let’s update our mapping from last week:
A retest of current lows that holds is a 27% decline. – Failed
A retest of the 2018 lows, which is most likely, an average recessionary decline of 32.8% – Current
A retest of the 2016 lows, coincident with a “credit event,” would entail a 50.9% decline. – Pending Possibility.
Given the magnitude, and multiple confirmations, of these signals, it is far too soon to assume the “bear market” is over. This is particularly the case, given the selloff is less than one-month old.
Bear markets, and recessions, tend to last 18-months on average.
The current bear market and recession are not the result of just the “coronavirus” shock. It is the result of many simultaneous shocks from:
Economic disruption
Surging unemployment
Oil price shock
Collapsing consumer confidence, and
A “credit event.”
We likely have more to go before we can safely assume we have turned the corner.
In the meantime, use rallies to raise cash. Don’t worry about trying to “buy the bottom.”There will be plenty of time to see “THE” bottom is in, and having cash will allow you to “buy stocks” from the last of the “weak hands.”
The MacroView
If you need help or have questions, we are always glad to help. Just email me.
See You Next Week
By Lance Roberts, CIO
Market & Sector Analysis
Data Analysis Of The Market & Sectors For Traders
S&P 500 Tear Sheet
Performance Analysis
Technical Composite
Note: The technical gauge is now at the lowest level since both the “Dot.com” and “Financial Crisis.” However, note the gauge bottoms BEFORE the market bottoms. In 2002, lows were retested. In 2008, there was an additional 22% decline into early 2009.
ETF Model Relative Performance Analysis
Sector & Market Analysis:
Be sure and catch our updates on Major Markets (Monday) and Major Sectors (Tuesday) with updated buy/stop/sell levels
Sector-by-Sector
For the 3rd week in a row:
“Everything was crushed again this past week, so the difference between leading and lagging sectors is which sector fell faster or slower than the S&P 500 index itself.”
Improving – Discretionary (XLY), and Real Estate (XLRE)
We previously reduced our weightings to Real Estate and liquidated Discretionary entirely over concerns of the virus and impact to the economy. No change this week.
The correction in Technology last week broke support at the 200-dma but finished the week very close to the May 2019 lows. Communication and Utilities didn’t perform as well but also held up better during the decline on a relative basis. The same is true for Utilities and Staples. These are our core ETF’s right now at which we are carrying substantially reduced exposure.
Current Positions: 1/2 weight XLK, XLC, XLU, XLP, XLV
Weakening – None
No sectors in this quadrant.
Current Position: None
Lagging – Industrials (XLI), Financials (XLF), Materials (XLB), and Energy (XLE)
No change from last week, with the exception that performance continued to be worse than the overall market.
These sectors are THE most sensitive to Fed actions (XLF) and the shutdown of the economy. We eliminated all holdings in late February and early March.
Current Position: None
Market By Market
Small-Cap (SLY) and Mid Cap (MDY) – Three weeks ago, we sold all small-cap and mid-cap exposure over concerns of the impact of the coronavirus. Remain out of these sectors for now.
Current Position: None
Emerging, International (EEM) & Total International Markets (EFA)
Same as small-cap and mid-cap. Given the spread of the virus and the impact on the global supply chain. Trading opportunities only.
Current Position: None
S&P 500 Index (Core Holding) – Given the rapid deterioration of the broad market, we sold our entire core position holdings for the safety of cash.
Current Position: None
Gold (GLD) – Gold broke our stop, and we sold our holdings. We are now on the watch for an entry point if Gold can climb back above the 200-dma.
Bonds collapsed last week as the “credit event” we have been concerned about took shape. We had previously taken profits and reduced our bond holdings duration and increased credit quality. We have now reduced our total bond exposure to 20% of the portfolio from 40% since we are only carrying 10% equity currently. (Rebalanced our hedge.)
Current Positions: SHY, IEF, BIL
Sector / Market Recommendations
The table below shows thoughts on specific actions related to the current market environment.
(These are not recommendations or solicitations to take any action. This is for informational purposes only related to market extremes and contrarian positioning within portfolios. Use at your own risk and peril.)
Portfolio/Client Update:
I know it is ugly.
The S&P 500 is down nearly 32% in just three weeks.
That’s scary.
However, it is important to keep some perspective on where we are currently.
Last Monday, we further reduced our equity to just 10% (from 25% previously) of the portfolio
What does that mean? Here is some math:
If the market goes to ZERO from here, (it’s not going to) your MAXIMUM loss is just 10%.
This is recoverable, particularly if we could buy a portfolio of assets for FREE.
We currently expect a maximum decline from current levels of 20%. This would be a 2% net hit to portfolios leaving us with a LOT of cash to buy distressed assets at 50% off.
This is the opportunity we have been waiting for during the entire last decade.
Currently, we are busy rebuilding all of our portfolio models, rethinking risk management in a post-bear market environment, and what role the future of “fixed income” will play in asset allocations.
These are all essential questions that we need solid answers for.
We are in an excellent position with plenty of cash, reduced bond holdings, and minimal equity exposure in companies we want to own for the next 10-years. We are just patiently waiting to buy large chunks of these holdings soon with both stable and higher yields.
Let me assure you of four things;
The ONLY people who care more about your money than you, is all of us at RIA Advisors.
We will NOT “buy the bottom” of the market. We will buy when we SEE the bottom of the market is in and risk/reward ratios are clearly in our favor.
This has been THE fastest bear market in history. We are doing our best to preserve your capital so that you meet your financial goals. Bear markets are never fun, but they are necessary for future gains.
We’ve got this.
Please don’t hesitate to contact us if you have any questions, or concerns.
Lance Roberts
CIO
THE REAL 401k PLAN MANAGER
A Conservative Strategy For Long-Term Investors
Model performance is based on a two-asset model of stocks and bonds relative to the weighting changes made each week in the newsletter. This is strictly for informational and educational purposes only and should not be relied upon for any reason. Past performance is not a guarantee of future results. Use at your own risk and peril.
401k Plan Manager Live Model
As an RIA PRO subscriber(You get your first 30-days free) you have access to our live 401k p
The code will give you access to the entire site during the 401k-BETA testing process, so not only will you get to help us work out the bugs on the 401k plan manager, you can submit your comments about the rest of the site as well.
We are building models specific to company plans. So, if you would like to see your company plan included specifically, send me the following:
Name of the company
Plan Sponsor
A print out of your plan choices. (Fund Symbol and Fund Name)
If you would like to offer our service to your employees at a deeply discounted corporate rate, please contact me.
Margin Call: You Were Warned Of The Risk
I have been slammed with emails over the last couple of days asking the following questions:
“What just happened to my bonds?”
“What happened to my gold position, shouldn’t it be going up?”
“Why are all my stocks being flushed at the same time?”
“Stocks down, Bonds down, credit down, gold down, oil down, copper down, crypto down, global systemically important banks down, and liquidity down…
Today was the worst day for a combined equity/bond portfolio… ever…”
This Is What A “Margin Call,” Looks Like.
In December 2018,we warned of the risk. At that time, the market was dropping sharply, and Mark Hulbert wrote an article dismissing the risk of margin debt. To wit:
“Plunging margin debt may not doom the bull market after all, reports to the contrary notwithstanding.
According to research conducted in the 1970s by Norman Fosback, then the president of the Institute for Econometric Research, there is an 85% probability that a bull market is in progress when margin debt is above its 12-month moving average, in contrast to just a 41% probability when it’s below.
Why, then, do I suggest not becoming overly pessimistic? For several reasons:
1) The margin debt indicator issues many false signals
2) There is insufficient data
3) Margin debt is a strong coincident indicator.”
I disagreed with Mark on several points at the time. But fortunately the Federal Reserve’s reversal on monetary policy kept the stock market from sinking to levels that would trigger “margin calls.”
As I noted then, margin debt is not a technical indicator that can be used to trade markets. Margin debt is the “gasoline,” which drives markets higher as the leverage provides for the additional purchasing power of assets. However, that “leverage” also works in reverse as it provides the accelerant for larger declines as lenders “force” the sale of assets to cover credit lines without regard to the borrower’s position.
That last sentence is the most important and is what is currently happening in the market.
The issue with margin debt, in terms of the biggest risk, is the unwinding of leverage is NOT at the investor’s discretion.
It is at the discretion of the broker-dealers that extended that leverage in the first place. (In other words, if you don’t sell to cover, the broker-dealer will do it for you.)
When lenders fear they may not be able to recoup their credit-lines, they force the borrower to either put in more cash or sell assets to cover the debt. The problem is that “margin calls” generally happen all at once as falling asset prices impact all lenders simultaneously.
Margin debt is NOT an issue – until it is.
When an “event” occurs that causes lenders to “panic” and call in margin loans, things progress very quickly as the “math” becomes a problem. Here is a simple example.
“If you buy $100,000 of stock on margin, you only need to pay $50,000. Seems like a great deal, especially if the stock price goes up. But what if your stock drops to $60,000? Suddenly, you’ve lost $40,000, leaving you with only $10,000 in your margin account. The rules state that you need to have at least 25 percent of the $60,000 stock value in your account, which is $15,000. So not only do you lose $40,000, but you have to deposit an additional $5,000 in your margin account to stay in business.“
However, when margin calls occur, and equity is sold to meet the call, the equity in the portfolio is reduced further. Any subsequent price decline requires additional coverage leading to a “death spiral” until the margin line is covered.
Example:
$100,000 portfolio declines to $60,000. Requiring a margin call of $5000.
You have to deposit $5000, or sell to cover.
However, if you don’t have the cash, then a problem arises. The sell of equity reduces the collateral requirement requiring a larger transaction: $5000/.25% requirement = $20,000
With the margin requirement met, a balance of $40,000 remains in the account with a $10,000 margin requirement.
The next morning, the market declines again, triggering another margin call.
Wash, rinse, repeat until broke.
This is why you should NEVER invest on margin unless you always have the cash to cover.
Just 20%
As I discussed previously, the level we suspected would trigger a margin event was roughly a 20% decline from the peak.
“If such a decline triggers a 20% fall from the peak, which is around 2340 currently, broker-dealers are likely going to start tightening up margin requirements and requiring coverage of outstanding margin lines.
This is just a guess…it could be at any point at which “credit-risk” becomes a concern. The important point is that ‘when’ it occurs, it will start a ‘liquidation cycle’ as ‘margin calls’ trigger more selling which leads to more margin calls. This cycle will continue until the liquidation process is complete.
The Dow Jones provided the clearest picture of the acceleration in selling as “margin calls” kicked in.
The last time we saw such an event was in 2008.
How Much More Is There To Go?
Unfortunately, FINRA only updates margin debt with about a 2-month lag.
Mark’s second point was a lack of data. This isn’t actually the case as margin debt has been tracked back to 1959. However, for clarity, let’s just start with data back to 1980. The chart below tracks two things:
The actual level of margin debt, and;
The level of “free cash” balances which is the difference between cash and borrowed funds (net cash).
As I stated above, since the data has not been updated since January, the current level of margin, and negative cash balances, has obviously been reduced, and likely sharply so.
However, previous “market bottoms,” have occurred when those negative cash balances are reverted. Given the extreme magnitude of the leverage that was outstanding, I highly suspect the “reversion” is yet complete.
The relationship between cash balances and the market is better illustrated in the next chart. I have inverted free cash balances, to show the relationship between reversals in margin debt and the market. Given the market has only declined by roughly 30% to date, there is likely more to go. This doesn’t mean a fairly sharp reflexive bounce can’t occur before a further liquidation ensues.
If we invert margin debt to the S&P 500, you can see the magnitude of both previous market declines and margin liquidation cycles. As stated, this data is as of January, and margin balances will be substantially lower following the recent rout. I am just not sure we have “squeezed” the last bit of blood out of investors just yet.
You Were Warned
I warned previously, the idea that margin debt levels are simply a function of market activity, and have no bearing on the outcome of the market, was heavily flawed.
“By itself, margin debt is inert.
Investors can leverage their existing portfolios and increase buying power to participate in rising markets. While ‘this time could certainly be different,’ the reality is that leverage of this magnitude is ‘gasoline waiting on a match.’
When an event eventually occurs, it creates a rush to liquidate holdings.The subsequent decline in prices eventually reaches a point that triggers an initial round of margin calls. Since margin debt is a function of the value of the underlying ‘collateral,’ the forced sale of assets will reduce the value of the collateral, triggering further margin calls. Those margin calls will trigger more selling, forcing more margin calls, so forth and so on.
That event was the double-whammy of collapsing oil prices and the economic shutdown in response to the coronavirus.
While it is certainly hoped by many that we are closer to the end of the liquidation cycle, than the beginning, the dollar funding crisis, a blowout in debt yields, and forced selling of assets, suggests there is likely more pain to come before we are done.
It’s not too late to take actions to preserve capital now, so you have capital to invest later.
“With our risk limits hit, and in order to protect our clients from both financial and emotional duress, we made the decision that even the reduced risk we were carrying was still too much.
The good news is that a great ‘buying’ opportunity is coming. Just don’t be in a ‘rush’ to try and buy the bottom.
I can assure you, when we ultimately see a clear ‘risk/reward’ set up to start taking on equity risk again, we will do so ‘with both hands.’
And we are sitting on a lot of cash just for that reason.”
You can’t “buy low,” if you don’t have anything to “buy with.”
Market Crash. Is It Over, Or Is It The “Revenant”
Market Crash: Is It Over, Or Is It The Revenant?
MacroView: Fed Launches A Bazooka To Kill A Virus
Financial Planning Corner: Tips For A Volatile Market
If you haven’t seen the movie “The Revenant” with Leonardo DiCaprio, it is a 2015 American survival drama describing frontiersman Hugh Glass’s experiences in 1823. Early in the movie, Hugh, an expert hunter, and tracker, is mauled by a grizzly bear. (Warning: the scene is very graphic)
In the scene, the attack comes in three distinct waves.
The bear attacks, and brutally mauls Hugh, who plays dead to survive. The attack subsides.
The bear comes back, and Hugh shoots it, provoking the bear to maul him some more.
Finally, Hugh pulls out his knife as the bear attacks for a final fight to the death.(Hugh wins if you don’t want to watch the video.)
Interestingly, this is also how a “bear market” works.
Bear markets have three stages – sharp down, reflexive rebound and a drawn-out fundamental downtrend
Bear markets often START with a sharp and swift decline.
After this decline, there is an oversold bounce that retraces a portion of that decline.
The longer-term decline then continues, at a slower and more grinding pace, as the fundamentals deteriorate.
Dow Theory also suggests that bear markets consist of three down legs with reflexive rebounds in between.
The chart above shows the stages of the last two primary cyclical bear markets versus today (the 2020 scale has been adjusted to match.)
As would be expected, the “Phase 1” selloff has been brutal.
That selloff sets up a “reflexive bounce.” For many individuals, they will “feel like” they are “safe.” This is how “bear market rallies” lure investors back in just before they are mauled again in “Phase 3.”
Just like in 2000, and 2008, the media/Wall Street will be telling you to just “hold on.” Unfortunately, by the time “Phase 3” was finished, there was no one wanting to “buy” anything.
One of the reasons we are fairly certain of a further decline is due to the dual impacts of the “COVID-19” virus, and oil price shock. As noted in our MacroView:
“With the U.S. now shutting down and entrenching itself in response to the virus, the economic impact will be worsened. However, given that economic data is lagging, and we only have numbers that were mostly pre-virus, the reports over the next couple of months will ultimately reveal the extent of the damage.
With oil prices now at $30/bbl and 10-year breakeven rates to 0.9%, the math is significantly worse, and that is what the severity of the recent selloff is telling us. Over the next two quarters, we could see as much as a 3% clip off of current GDP.”
Unfortunately, while asset prices have declined, they have likely not fully accounted for the impact to earnings, permanently lost revenues, and the recessionary impact from falling consumer confidence. Historically, the gap between asset prices and corporate profits gets filled.
“What we know, with almost absolute certainty, is that we will be in an economic recession within the next couple of quarters. We also know that earnings estimates are still way too elevated to account for the disruption coming from the COVID-19.”
“What we DON’T KNOW is where the ultimate bottom for the market is. All we can do is navigate the volatility to the best of our ability and recalibrate portfolios to adjust for downside risk without sacrificing the portfolio’s ability to adjust for a massive ” bazooka-style ” monetary intervention from global Central Banks if needed quickly.
This is why, over the last 6-weeks, we have been getting more “defensive” by increasing our CASH holdings to 15% of the portfolio, with our 40% in bonds doing the majority of the heavy lifting in mitigating the risk in our remaining equity holdings.
Interestingly, the Federal Reserve DID show up on Thursday as expected. In a statement from the New York Fed:
The Federal Reserve said it would inject more than $1.5 trillion of temporary liquidity into Wall Street on Thursday and Friday to prevent ominous trading conditions from creating a sharper economic contraction.
If the transactions are fully subscribed, they would swell the central bank’s $4.2 trillion asset portfolio by more than 35%.” – WSJ
As you can see in the chart below, this is a massive surge of liquidity hitting the market at a time the market is sitting on critical long-term trend support.
Of course, this is what the market has been hoping for.
Rate cuts? Check
Liquidity? Check
On Friday, the market surged, and ALMOST recouped the previous day’s losses. (Sorry, it wasn’t President Trump’s speech that boosted the market.)
However, this rally, and liquidity flush, most likely does not negate the continuation of the bear market. The amount of technical damage combined with a recession, and a potential surge in credit defaults almost ensures another leg of the beg market is yet to come.
A look at the charts can also help us better understand where we currently reside.
Trading The Bounce
In January, when we discussed taking profits out of our portfolios, we noted the markets were trading at 3-standard deviations above their 200-dma, which suggested a pullback, or correction, was likely.
Now, it is the same comment in reverse. The correction over the last couple of weeks has completely reversed the previous bullish exuberance into extreme pessimism. On a daily basis, the market is back to oversold. Historically, this condition has been sufficient for a bounce. Given the oversold condition (top panel) is combined with a very deep “sell signal” in the bottom panel, it suggests a fairly vicious reflexive rally is likely as we saw on Friday.
The question, of course, is where do you sell?
Looking at the chart above, it is possible for a rally to the 38.2%, or 50% retracement levels. However, with the severity of the break below the 200-dma, the 61.8% retracement level, where the 200-dma now resides, will be very formidable resistance. With the Fed’s liquidity push, it is possible for a strong “Phase 2” rally. Our plan will be to reduce equity exposure at each level of resistance and increase our equity hedges before the “Phase 3” mauling ensues.
The following chart is a longer-term analysis of the market and is the format we use for “onboarding” our clients into allocation models. (Vertical black lines are buy periods)
“But Lance, how do you know that Friday wasn’t THE bottom?”
A look at longer-term time-frames gives us some clues.
With all of our longer-term weekly “sell signals” now triggered from fairly high levels, it suggests the current selloff is not over as of yet. In other words, we will see a rally, followed by a secondary failure to lower lows, before the ultimate bottom is put in.
I have mapped out the three most logical secondary bottoms for the market, so you can assess your portfolio risk accordingly.
A retest of current lows that holds is a 27% decline.
A retest of the 2018 lows, most likely, is an average recessionary decline of 32.8%
A retest of the 2016 lows, coincident with a “credit event,” would entail a 50.9% decline.
Given the weekly signals have only recently triggered, we can look at monthly data to confirm we still remain confined to a “bearish market” currently.
On a monthly basis, sell signals have been triggered. However, these signals are NOT VALID until the end of the month. However, given the depth of the decline, it would likely require a rally back to all-time highs to reverse those signals. This is a very high improbability.
Assuming the signals remain, there is an important message being sent, as noted in the top panel. The “negative divergence” of relative strength has only been seen prior to the start of the previous two bear markets, and the 2015-2016 slog. While the current selloff resembles what we saw in late 2015, there is a risk of this developing into a recessionary bear market later this summer. The market is holding the 4-year moving average, which is “make or break” for the bull market trend from the 2009 lows.
However, we suspect those levels will eventually be taken out. Caution is advised.
What We Are Thinking
Since January, we have been regularly discussing taking profits in positions, rebalancing portfolio risks, and, most recently, moving out of areas subject to slower economic growth, supply-chain shutdowns, and the collapse in energy prices. This led us to eliminate all holdings in international, emerging markets, small-cap, mid-cap, financials, transportation, industrials, materials, and energy markets.(RIAPRO Subscribers were notified real-time of changes to our portfolios.)
There is “some truth” to the statement “that no one” could have seen the fallout of the “coronavirus” being escalated by an “oil price” war. However, there have been mounting risks for quite some time from valuations, to price deviations, and a complete disregard of risk by investors. While we have been discussing these issues with you, and making you aware of the risks, it was often deemed as “just being bearish” in the midst of a “bullish rally.”However, it is managing these types of risks, which is ultimately what clients pay advisors for.
It isn’t a perfect science. In times like these, it gets downright messy. But this is where working to preserve capital and limit drawdowns becomes most important. Not just from reducing the recovery time back to breakeven, but in also reducing the “psychological stress,” which leads individuals to make poor investment decisions over time.
As noted last week:
“Given the extreme oversold and deviated measures of current market prices, we are looking for a reflexive rally that we can further reduce risk into, add hedges, and stabilize portfolios for the duration of the correction. When it is clear, the correction, or worse a bear market, is complete, we will reallocate capital back to equities at better risk/reward measures.”
We highly suspect that we have seen the highs for the year. Most likely, we are moving into an environment where portfolio management will be more tactical in nature, versus buying and holding.
Take some action on this rally.
If this is a “Phase 2” relief rally of a bear market, you really don’t want to be around for the “final mauling.”
The MacroView
If you need help or have questions, we are always glad to help. Just email me.
WE ARE UNLOCKING OUR SUBSCRIBER SECTION AGAIN THIS WEEK TO ASSIST YOU IN MANAGING YOUR PORTFOLIO IN THESE CHALLENGING TIMES.
Need to know what specifically to buy and sell in your portfolio? We cover it every week, and every day on RIA PRO along with everything we are doing in our client portfolios.
Try RISK-FREE for 30-days
S&P 500 Tear Sheet
Performance Analysis
Technical Composite
ETF Model Relative Performance Analysis
Sector & Market Analysis:
Be sure and catch our updates on Major Markets (Monday) and Major Sectors (Tuesday) with updated buy/stop/sell levels
Sector-by-Sector
Everything was crushed again this past week, so the difference between leading and lagging sectors is which sector fell faster or slower than the S&P 500 index itself.
Improving – Discretionary (XLY), Real Estate (XLRE), and Staples (XLP)
Last week, we rebalanced our weightings in Real Estate and Staples, as these sectors are now improving in terms of relative performance. After getting very beaten up, we are looking not only for the “risk hedge” of non-virus related sectors but an eventual outperformance of the groups.
We sold our entire stake in Discretionary due to potential earnings impacts from a slowdown in consumption, supply chain problems, and inventory issues. This worked well as Discretionary fell sharply last week.
Current Positions: Target Weight XLU, XLRE
Outperforming – Technology (XLK), Communications (XLC), and Utilities (XLU)
The correction in Technology this past week broke support at the 200-dma but finished the week very close to our entry point, where we had slightly increased our exposure. These have “anti-virus” properties, so we are looking for the “risk hedge” relative to the broader market. Communication and Utilities didn’t perform as well but also held up better during the decline on a relative basis. We are watching Utilities and may reduce exposure if interest rates begin to rise due to the Fed. The same with Real Estate as well.
We did bring our healthcare positioning back to portfolio weight as the sector will ultimately benefit from a “cure” for the “coronavirus.” Also, with Bernie Sanders now lagging Joe Biden on the Democratic ticket, this removes some of the risks of “nationalized healthcare” from the sector.
Lagging – Industrials (XLI), Financials (XLF), Materials (XLB), and Energy (XLE)
We had started to buy a little energy exposure previously but closed out of the positions as we were stopped out of our holdings week before last. We are going to continue to monitor the space due to its extreme oversold condition and relative value and will re-enter our positions when stability starts to take hold.
We also sold Financials due to the financial risk from a recessionary impact on the outstanding corporate debt which currently exists. The Fed’s rate cut also impacts the bank’s Net Interest Margins, which makes them less attractive. Industrials and Materials have too much exposure to the “virus risk” for now.
Current Position: None
Market By Market
Small-Cap (SLY) and Mid Cap (MDY) – Week before last, we sold all small-cap and mid-cap exposure over concerns of the impact of the coronavirus. Remain out of these sectors for now. However, given that Central Banks are going “all in” on stimulus, we may look for a trade in these sectors short-term.
Current Position: None
Emerging, International (EEM) & Total International Markets (EFA)
Same as small-cap and mid-cap. Given the spread of the virus and the impact on the global supply chain. Trading opportunity only.
Current Position: None
Dividends (VYM), Market (IVV), and Equal Weight (RSP) – We have decided to consolidate our long-term “core” holding into IVV only. We sold RSP and VYM and added to IVV. The reason for doing this is the disparity of performance between the 3-holdings. Since we want an “exact hedge” for our portfolio, IVV is the best match for a short-S&P 500 ETF.
Current Position:IVV
Gold (GLD) – This past week, Gold sold off as the Fed introduced liquidity giving the bulls hope and removing the “fear” factor in stocks. There was also a massive “margin call” that led to a liquidation event. Gold is VERY oversold currently. Add positions to portfolios with a stop $140. We sold our GDX position due to the fact mining is people-intensive and is located in countries most susceptible to the virus.
Bonds also broke out to new highs as the correction ensued. Last Friday, we took profits in our 20-year bond position (TLT) to reduce our duration slightly, raise cash, and take in some profits. Bonds are extremely overbought now, so be cautious, we are maintaining the rest of our exposures for now, but we did rebalance our duration by selling 1/2 of IEF and adding to BIL.
Current Positions:DBLTX, SHY, IEF, PTIAX, BIL
Sector / Market Recommendations
The table below shows thoughts on specific actions related to the current market environment.
(These are not recommendations or solicitations to take any action. This is for informational purposes only related to market extremes and contrarian positioning within portfolios. Use at your own risk and peril.)
Portfolio/Client Update:
Thank goodness. The market finally responded to the Fed on Friday.
Please read “Trading The Bounce” above as it details our plan on how we are going to trade this liquidity rally.
As noted last week:
“Staying true to our discipline and strategy is difficult when you have this type of volatility. We question everything, every day. Are we in the right place? Do we have too much risk? Are we missing something?
The ghosts of 2000, and 2008, stalk us both, and we are overly protective of YOUR money. We do not take our jobs lightly.”
We took some further actions to increase cash, further rebalance risks this past week. We are now using this rally to add hedges, and reduce equities until the current “sell signals” reverse. As noted, this is most likely a “bear market” rally that will fail.
However, if it is the beginning of a new “bull market,” then we will simply remove hedges and add to our equity longs.
Be assured we are watching your portfolios very closely. However, if you have ANY questions, comments, or concerns, please don’t hesitate to email me.
Portfolio Actions Taken Last Week
New clients:Only adding new positions as needed.
Dynamic Model: Sold VOOG, and hedged portfolio. Currently unhedged.
Equity Model: Sold IEF and added to BIL to shorten bond portfolio duration. Sold RSP and VYM, and added slightly to IVV to rebalance our CORE holdings for more effective hedges.
ETF Model: Same as Equity Model.
Note for new clients:
It is important to understand that when we add to our equity allocations, ALL purchases are initially “trades” that can, and will, be closed out quickly if they fail to work as anticipated. This is why we “step” into positions initially. Once a “trade” begins to work as anticipated, it is then brought to the appropriate portfolio weight and becomes a long-term investment. We will unwind these actions either by reducing, selling, or hedging if the market environment changes for the worse.
THE REAL 401k PLAN MANAGER
A Conservative Strategy For Long-Term Investors
Model performance is based on a two-asset model of stocks and bonds relative to the weighting changes made each week in the newsletter. This is strictly for informational and educational purposes only and should not be relied upon for any reason. Past performance is not a guarantee of future results. Use at your own risk and peril.
401k Plan Manager Live Model
As an RIA PRO subscriber(You get your first 30-days free) you have access to our live 401k p
The code will give you access to the entire site during the 401k-BETA testing process, so not only will you get to help us work out the bugs on the 401k plan manager, you can submit your comments about the rest of the site as well.
We are building models specific to company plans. So, if you would like to see your company plan included specifically, send me the following:
Name of the company
Plan Sponsor
A print out of your plan choices. (Fund Symbol and Fund Name)
If you would like to offer our service to your employees at a deeply discounted corporate rate, please contact me.
Market Crash. Is It Over, Or Is It The “Revenant”
Market Crash: Is It Over, Or Is It The Revenant?
MacroView: Fed Launches A Bazooka To Kill A Virus
Financial Planning Corner: Tips For A Volatile Market
If you haven’t seen the moving “The Revenant” with Leonardo DiCaprio, it is a 2015 American survival drama describing frontiersman Hugh Glass’s experiences in 1823. Early in the movie, Hugh, an expert hunter, and tracker, is mauled by a grizzly bear. (Warning: the scene is very graphic)
In the scene, the attack comes in three distinct waves.
The bear attacks, and brutally mauls Hugh, who plays dead to survive. The attack subsides.
The bear comes back, and Huge shoots it, provoking the bear to maul him some more.
Finally, Huge pulls out his knife as the bear attacks for a final fight to the death.(Hugh wins if you don’t want to watch the video.)
Interestingly, this is also how a “bear market” works.
Bear markets have three stages – sharp down, reflexive rebound and a drawn-out fundamental downtrend
Bear markets often START with a sharp and swift decline.
After this decline, there is an oversold bounce that retraces a portion of that decline.
The longer-term decline then continues, at a slower and more grinding pace, as the fundamentals deteriorate.
Dow Theory also suggests that bear markets consist of three down legs with reflexive rebounds in between.
The chart above shows the stages of the last two primary cyclical bear markets versus today (the 2020 scale has been adjusted to match.)
As would be expected, the “Phase 1” selloff has been brutal.
That selloff sets up a “reflexive bounce.” For many individuals, they will “feel like” they are “safe.” This is how “bear market rallies” lure investors back in just before they are mauled again in “Phase 3.”
Just like in 2000, and 2008, the media/Wall Street will be telling you to just “hold on.” Unfortunately, by the time “Phase 3” was finished, there was no one wanting to “buy” anything.
One of the reasons we are fairly certain of a further decline is due to the dual impacts of the “COVID-19” virus, and oil price shock. As noted in our MacroView:
“With the U.S. now shutting down and entrenching itself in response to the virus, the economic impact will be worsened. However, given that economic data is lagging, and we only have numbers that were mostly pre-virus, the reports over the next couple of months will ultimately reveal the extent of the damage.
With oil prices now at $30/bbl and 10-year breakeven rates to 0.9%, the math is significantly worse, and that is what the severity of the recent selloff is telling us. Over the next two quarters, we could see as much as a 3% clip off of current GDP.”
Unfortunately, while asset prices have declined, they have likely not fully accounted for the impact to earnings, permanently lost revenues, and the recessionary impact from falling consumer confidence. Historically, the gap between asset prices and corporate profits gets filled.
“What we know, with almost absolute certainty, is that we will be in an economic recession within the next couple of quarters. We also know that earnings estimates are still way too elevated to account for the disruption coming from the COVID-19.”
“What we DON’T KNOW is where the ultimate bottom for the market is. All we can do is navigate the volatility to the best of our ability and recalibrate portfolios to adjust for downside risk without sacrificing the portfolio’s ability to adjust for a massive ” bazooka-style ” monetary intervention from global Central Banks if needed quickly.
This is why, over the last 6-weeks, we have been getting more “defensive” by increasing our CASH holdings to 15% of the portfolio, with our 40% in bonds doing the majority of the heavy lifting in mitigating the risk in our remaining equity holdings.
Interestingly, the Federal Reserve DID show up on Thursday as expected. In a statement from the New York Fed:
The Federal Reserve said it would inject more than $1.5 trillion of temporary liquidity into Wall Street on Thursday and Friday to prevent ominous trading conditions from creating a sharper economic contraction.
If the transactions are fully subscribed, they would swell the central bank’s $4.2 trillion asset portfolio by more than 35%.” – WSJ
As you can see in the chart below, this is a massive surge of liquidity hitting the market at a time the market is sitting on critical long-term trend support.
Of course, this is what the market has been hoping for.
Rate cuts? Check
Liquidity? Check
On Friday, the market surged, and ALMOST recouped the previous days losses. (Sorry, it wasn’t President Trump’s speech that boosted the market.)
However, this rally, and liquidity flush, most likely does not negate the continuation of the bear market. The amount of technical damage combined with a recession, and a potential surge in credit defaults almost ensures another leg of the beg market is yet to come.
A look at the charts can also help us better understand where we currently reside.
Trading The Bounce
In January, when we discussed taking profits out of our portfolios, we noted the markets were trading at 3-standard deviations above their 200-dma, which suggested a pullback, or correction, was likely.
Now, it is the same comment in reverse. The correction over the last couple of weeks has completely reversed the previous bullish exuberance into extreme pessimism. On a daily basis, the market is back to oversold. Historically, this condition has been sufficient for a bounce. Given the oversold condition (top panel) is combined with a very deep “sell signal” in the bottom panel, it suggests a fairly vicious reflexive rally is likely as we saw on Friday.
The question, of course, is where do you sell?
Looking at the chart above, it is possible for a rally to the 38.2%, or 50% retracement levels. However, with the severity of the break below the 200-dma, the 61.8% retracement level, where the 200-dma now resides, will be very formidable resistance. With the Fed’s liquidity push, it is possible for a strong “Phase 2” rally. Our plan will be to reduce equity exposure at each level of resistance and increase our equity hedges before the “Phase 3” mauling ensues.
The following chart is a longer-term analysis of the market and is the format we use for “onboarding” our clients into allocation models. (Vertical black lines are buy periods)
“But Lance, how do you know that Friday wasn’t THE bottom?”
A look at longer-term time-frames gives us some clues.
With all of our longer-term weekly “sell signals” now triggered from fairly high levels, it suggests the current selloff is not over as of yet. In other words, we will see a rally, followed by a secondary failure to lower lows, before the ultimate bottom is put in.
I have mapped out the three most logical secondary bottoms for the market, so you can assess your portfolio risk accordingly.
A retest of current lows that holds is a 27% decline.
A retest of the 2018 lows, most likely, is an average recessionary decline of 32.8%
A retest of the 2016 lows, coincident with a “credit event,” would entail a 50.9% decline.
Given the weekly signals have only recently triggered, we can look at monthly data to confirm we still remain confined to a “bearish market” currently.
On a monthly basis, sell signals have been triggered. However, these signals are NOT VALID until the end of the month. However, given the depth of the decline, it would likely require a rally back to all-time highs to reverse those signals. This is a very high improbability.
Assuming the signals remain, there is an important message being sent, as noted in the top panel. The “negative divergence” of relative strength has only been seen prior to the start of the previous two bear markets, and the 2015-2016 slog. While the current selloff resembles what we saw in late 2015, there is a risk of this developing into a recessionary bear market later this summer. The market is holding the 4-year moving average, which is “make or break” for the bull market trend from the 2009 lows.
However, we suspect those levels will eventually be taken out. Caution is advised.
What We Are Thinking
Since January, we have been regularly discussing taking profits in positions, rebalancing portfolio risks, and, most recently, moving out of areas subject to slower economic growth, supply-chain shutdowns, and the collapse in energy prices. This led us to eliminate all holdings in international, emerging markets, small-cap, mid-cap, financials, transportation, industrials, materials, and energy markets.(RIAPRO Subscribers were notified real-time of changes to our portfolios.)
There is “some truth” to the statement “that no one” could have seen the fallout of the “coronavirus” being escalated by an “oil price” war. However, there have been mounting risks for quite some time from valuations, to price deviations, and a complete disregard of risk by investors. While we have been discussing these issues with you, and making you aware of the risks, it was often deemed as “just being bearish” in the midst of a “bullish rally.”However, it is managing these types of risks, which is ultimately what clients pay advisors for.
It isn’t a perfect science. In times like these, it gets downright messy. But this is where working to preserve capital and limit drawdowns becomes most important. Not just from reducing the recovery time back to breakeven, but in also reducing the “psychological stress,” which leads individuals to make poor investment decisions over time.
As noted last week:
“Given the extreme oversold and deviated measures of current market prices, we are looking for a reflexive rally that we can further reduce risk into, add hedges, and stabilize portfolios for the duration of the correction. When it is clear, the correction, or worse a bear market, is complete, we will reallocate capital back to equities at better risk/reward measures.”
We highly suspect that we have seen the highs for the year. Most likely, we are moving into an environment where portfolio management will be more tactical in nature, versus buying and holding.
Take some action on this rally.
If this is a “Phase 2” relief rally of a bear market, you really don’t want to be around for the “final mauling.”
The MacroView
If you need help or have questions, we are always glad to help. Just email me.
Be sure and catch our updates on Major Markets (Monday) and Major Sectors (Tuesday) with updated buy/stop/sell levels
Sector-by-Sector
Everything was crushed again this past week, so the difference between leading and lagging sectors is which sector fell faster or slower than the S&P 500 index itself.
Improving – Discretionary (XLY), Real Estate (XLRE), and Staples (XLP)
Last week, we rebalanced our weightings in Real Estate and Staples, as these sectors are now improving in terms of relative performance. After getting very beaten up, we are looking not only for the “risk hedge” of non-virus related sectors but an eventual outperformance of the groups.
We sold our entire stake in Discretionary due to potential earnings impacts from a slowdown in consumption, supply chain problems, and inventory issues. This worked well as Discretionary fell sharply last week.
Current Positions: Target Weight XLU, XLRE
Outperforming – Technology (XLK), Communications (XLC), and Utilities (XLU)
The correction in Technology this past week broke support at the 200-dma but finished the week very close to our entry point, where we had slightly increased our exposure. These have “anti-virus” properties, so we are looking for the “risk hedge” relative to the broader market. Communication and Utilities didn’t perform as well but also held up better during the decline on a relative basis. We are watching Utilities and may reduce exposure if interest rates begin to rise due to the Fed. The same with Real Estate as well.
We did bring our healthcare positioning back to portfolio weight as the sector will ultimately benefit from a “cure” for the “coronavirus.” Also, with Bernie Sanders now lagging Joe Biden on the Democratic ticket, this removes some of the risks of “nationalized healthcare” from the sector.
Lagging – Industrials (XLI), Financials (XLF), Materials (XLB), and Energy (XLE)
We had started to buy a little energy exposure previously but closed out of the positions as we were stopped out of our holdings week before last. We are going to continue to monitor the space due to its extreme oversold condition and relative value and will re-enter our positions when stability starts to take hold.
We also sold Financials due to the financial risk from a recessionary impact on the outstanding corporate debt which currently exists. The Fed’s rate cut also impacts the bank’s Net Interest Margins, which makes them less attractive. Industrials and Materials have too much exposure to the “virus risk” for now.
Current Position: None
Market By Market
Small-Cap (SLY) and Mid Cap (MDY) – Week before last, we sold all small-cap and mid-cap exposure over concerns of the impact of the coronavirus. Remain out of these sectors for now. However, given that Central Banks are going “all in” on stimulus, we may look for a trade in these sectors short-term.
Current Position: None
Emerging, International (EEM) & Total International Markets (EFA)
Same as small-cap and mid-cap. Given the spread of the virus and the impact on the global supply chain. Trading opportunity only.
Current Position: None
Dividends (VYM), Market (IVV), and Equal Weight (RSP) – We have decided to consolidate our long-term “core” holding into IVV only. We sold RSP and VYM and added to IVV. The reason for doing this is the disparity of performance between the 3-holdings. Since we want an “exact hedge” for our portfolio, IVV is the best match for a short-S&P 500 ETF.
Current Position:IVV
Gold (GLD) – This past week, Gold sold off as the Fed introduced liquidity giving the bulls hope and removing the “fear” factor in stocks. There was also a massive “margin call” that led to a liquidation event. Gold is VERY oversold currently. Add positions to portfolios with a stop $140. We sold our GDX position due to the fact mining is people-intensive and is located in countries most susceptible to the virus.
Bonds also broke out to new highs as the correction ensued. Last Friday, we took profits in our 20-year bond position (TLT) to reduce our duration slightly, raise cash, and take in some profits. Bonds are extremely overbought now, so be cautious, we are maintaining the rest of our exposures for now, but we did rebalance our duration by selling 1/2 of IEF and adding to BIL.
Current Positions:DBLTX, SHY, IEF, PTIAX, BIL
Sector / Market Recommendations
The table below shows thoughts on specific actions related to the current market environment.
(These are not recommendations or solicitations to take any action. This is for informational purposes only related to market extremes and contrarian positioning within portfolios. Use at your own risk and peril.)
Portfolio/Client Update:
Thank goodness. The market finally responded to the Fed on Friday.
Please read “Trading The Bounce” above as it details our plan on how we are going to trade this liquidity rally.
As noted last week:
“Staying true to our discipline and strategy is difficult when you have this type of volatility. We question everything, every day. Are we in the right place? Do we have too much risk? Are we missing something?
The ghosts of 2000, and 2008, stalk us both, and we are overly protective of YOUR money. We do not take our jobs lightly.”
We took some further actions to increase cash, further rebalance risks this past week. We are now using this rally to add hedges, and reduce equities until the current “sell signals” reverse. As noted, this is most likely a “bear market” rally that will fail.
However, if it is the beginning of a new “bull market,” then we will simply remove hedges and add to our equity longs.
Be assured we are watching your portfolios very closely. However, if you have ANY questions, comments, or concerns, please don’t hesitate to email me.
Portfolio Actions Taken Last Week
New clients:Only adding new positions as needed.
Dynamic Model: Sold VOOG, and hedged portfolio. Currently unhedged.
Equity Model: Sold IEF and added to BIL to shorten bond portfolio duration. Sold RSP and VYM, and added slightly to IVV to rebalance our CORE holdings for more effective hedges.
ETF Model: Same as Equity Model.
Note for new clients:
It is important to understand that when we add to our equity allocations, ALL purchases are initially “trades” that can, and will, be closed out quickly if they fail to work as anticipated. This is why we “step” into positions initially. Once a “trade” begins to work as anticipated, it is then brought to the appropriate portfolio weight and becomes a long-term investment. We will unwind these actions either by reducing, selling, or hedging if the market environment changes for the worse.
THE REAL 401k PLAN MANAGER
A Conservative Strategy For Long-Term Investors
Model performance is based on a two-asset model of stocks and bonds relative to the weighting changes made each week in the newsletter. This is strictly for informational and educational purposes only and should not be relied upon for any reason. Past performance is not a guarantee of future results. Use at your own risk and peril.
401k Plan Manager Live Model
As an RIA PRO subscriber(You get your first 30-days free) you have access to our live 401k p
The code will give you access to the entire site during the 401k-BETA testing process, so not only will you get to help us work out the bugs on the 401k plan manager, you can submit your comments about the rest of the site as well.
We are building models specific to company plans. So, if you would like to see your company plan included specifically, send me the following:
Name of the company
Plan Sponsor
A print out of your plan choices. (Fund Symbol and Fund Name)
If you would like to offer our service to your employees at a deeply discounted corporate rate, please contact me.
We also included a set of “rules to follow,” based on our analysis. (For your review, you will find them posted again at the bottom)
Importantly, while we have adhered to our investment process and discipline, to protect capital while participating in the markets, the volatility over the last couple of weeks has been unnerving to say the least. The chart below shows the daily percentage swings.
With markets swinging wildly by 2-3% daily, it has been more nauseating than the 418-foot drop of the Kingda Ka roller coaster in Jackson, NJ. While it seems like last week was another “horrible” week for the market, it actually ended slightly above where we ended last week.
It’s important to keep some perspective with respect to your portfolio management, particularly when volatility surges. Emotions are the biggest risk to your investments, and capital, over time.
We Really Don’t Know
While we laid out a fairly detailed game plan last week, looking a daily, weekly, and monthly indicators, the reality is that we don’t know with any certainty what happens next, particularly when you have an exogenous situation like “COVID-19.”
However, we agree with Carl Swenlin that you can’t rule out a “bear market” has now started, like we saw in 2018, and the highs of the year are in.
“Even though it is not officially a bear market, I think we should begin to interpret charts and indicators in the context of a bear market template.”
We agree, particularly within the scope of the comments made by my colleague Doug Kass on Friday morning:
“The proximate cause for the precipitous drop in yields is the spread of the coronavirus – which is delivering a body blow to global economic growth (which will come to a standstill in the months ahead).
In all likelihood, world GDP growth will likely be flat over the next few months – to unnaturally low levels of activity. To be sure some segments of the economy (in this reset) will not recoup sales and will have a permanent loss, i.e., hotels, travel, etc.
However, other segments of the economy – like technology – will likely recoup almost all the growth delayed by the coronavirus shock.
The next few months will be challenging from an economic standpoint and volatile from a stock market perspective. Moreover, evolving market structure issues will introduce more uncertainty – and likely deliver a continuation of the extreme volatility seen since mid-February.”
We agree with Doug’s view and have spent the last month moving OUT of areas like Basic Materials (XLB), Industrials (XLI), Discretionary (XLY), Energy (XLE), Transports (XTN), and Financials (XLF).
While financials don’t have as much direct “virus” related risk, the risk to major banks is two-fold:
The collapse in “net interest margins” as the Fed cuts rates; and
Potential for a wave of corporate-debt defaults coming from the economic slowdown/recession, particularly in the Energy sector.
The second point was noted by Mish Shedlockon Friday:
“There is a credit implosion coming up. A lot of leveraged drillers and crude suppliers dependent on prices above $50/bbl are going to facing credit defaults.
This will lead to a deflationary outcome. But you can blame the Fed.
Deflation is not really about prices. It’s about the value of debt on the books of banks that cannot be paid back by zombie corporations and individuals.”
Collapsing yields, oil prices, and “emergency rate cuts,” are signs which suggest something has “broken” in the economy. These ramifications are not inconsequential. My friend Eric Hickman, of Kessler Investment Advisors, sent me an excellent note on Friday:
“Unsurprisingly, I think that the Coronavirus is the catalyst to tip the U.S. into a recession. We all know that recessions are not good for stocks, but by how much, and which ones?
The last two recessions hit all sectors of the S&P 500 significantly. Even so-called “defensive sectors” like consumer staples and healthcare got hit by at least a third of their value (33%). We are just two weeks, and 11% away from an all-time high in the S&P 500. There is plenty of downside left.”
He is right.
What we know, with almost absolute certainty, is that we will be in an economic recession within the next couple of quarters. We also know that earnings estimates are still way too elevated to account for the disruption coming from the COVID-19.
What we DON’T KNOW is where the ultimate bottom for the market is. All we can do is navigate the volatility to the best of our ability and recalibrate portfolio risk to adjust for downside risk without sacrificing the portfolio’s ability to quickly adjust for a massive “bazooka-style” monetary intervention from global Central Banks if needed.
This is why, over the last 6-weeks, we have been getting more “defensive” by increasing our CASH holdings to 15% of the portfolio, with our 40% in bonds doing the majority of the heavy lifting in mitigating the risk in our remaining equity holdings.
Regardless, of the hedges and cash, the portfolio management process over the last two weeks has not been pretty and has frayed our nerves. (Despite our best efforts, we are still subject to human emotions). However, for the year, the Sector Rotation model is down 1.7% versus 9% for the S&P 500.
That is volatility we can live with.
Back To Selling Rallies
“At market extremes you are trading nothing but psychology. So…is it time to sell panic? Or is the hysteria just beginning? What’s your time frame? What’s your pain threshold? Volatility has exploded as liquidity has vanished. Bid/offer spreads are wide but not deep. Credit spreads are widening. Here are some stats from the past week:
The 10 year UST yield has dropped from ~1.6% to ~0.8% in just 12 trading sessions.
Gold is up ~$100,
WTI is down ~$12 (a 4 year low,)
S&P is down ~500 points, and
The US Dollar Index has tumbled from a 2 year high to a 1 year low.
The CNN Fear/Greed barometer is at 5.“ – Victor Adair, Polar Futures Group
I have been in this business for a long-time and have rarely seen moves this extreme in a two-week period. For the average investor, it is nearly impossible to stomach. It is times like these, which we have repeatedly warned about, that “buy and hold” strategies become “How Do I Get Out?”
“With the markets extremely extended to the downside so a reflexive rally is likely. However, SPY will trigger a sell signal in the lower panel suggesting that any initial rally will fail and retest of support is likely.”
That is exactly what happened this past week. While we will likely get another reflexive rally in the next week or so, any advance will be one of your better opportunities to raise cash, and reduce overall equity risk, for the time being.
The “equity exposure” in our portfolio models is driven by a series of “weekly signals” which we use to control risk. Importantly, it requires a “confirmation” of the indicators to adjust risk exposure in portfolios accordingly.
On Friday, the markets confirmed that risk exposure in portfolios should be reduced lower for now. Fortunately, we have been reducing risk over the last 6-weeks, as noted above, but the signals have now confirmed our previous actions were correct. If the market breaks the 2-year moving average, we will need to substantially reduce risk further.
As I said above, I am reprinting our rules from last week to use on any rally into the “sell zone” over the next week.
These are the same rules we use to reduce the risk in our portfolio management process, with the exception of #7.
Move slowly. There is no rush in making dramatic changes. Doing anything in a moment of “panic” tends to be the wrong thing.
If you are over-weight equities, DO NOT try and fully adjust your portfolio to your target allocation in one move. Again, after big declines, individuals feel like they “must” do something. Think logically above where you want to be and use the rally to adjust to that level.
Begin by selling laggards and losers. These positions were dragging on performance as the market rose and they led on the way down.
Add to sectors, or positions, that are performing with, or outperforming the broader market if you need risk exposure.
Move “stop-loss” levels up to recent lows for each position. Managing a portfolio without “stop-loss” levels is like driving with your eyes closed.
Be prepared to sell into the rally and reduce overall portfolio risk. There are a lot of positions you are going to sell at a loss simply because you overpaid for them to begin with. Selling at a loss DOES NOT make you a loser. It just means you made a mistake. Sell it, and move on with managing your portfolio. Not every trade will always be a winner. But keeping a loser will make you a loser of both capital and opportunity.
If none of this makes any sense to you – please consider hiring someone to manage your portfolio for you. It will be worth the additional expense over the long term.
In the short-term, there is no need to take on exceptional risk. It is time to take precautionary measures and tighten up stops, add non-correlated assets, raise cash levels, and hedge risk opportunistically on any rally.
As noted last week, this just our approach to controlling risk.
The only unacceptable method of managing risk at this juncture is not having a method to begin with.
The MacroView
If you need help or have questions, we are always glad to help. Just email me.
Be sure and catch our updates on Major Markets (Monday) and Major Sectors (Tuesday) with updated buy/stop/sell levels
Sector-by-Sector
Everything was crushed again this past week, so the difference between leading and lagging sectors is which sector fell faster or slower than the S&P 500 index itself.
Improving – Discretionary (XLY), Real Estate (XLRE), and Staples (XLP)
Last week, we rebalanced our weightings in Real Estate and Staples, as these sectors are now improving in terms of relative performance. After getting very beaten up, we are looking not only for the “risk hedge” of non-virus related sectors but an eventual outperformance of the groups.
We sold our entire stake in Discretionary due to potential earnings impacts from a slowdown in consumption, to supply chain problems, and inventory issues.
Current Positions: Target Weight XLU, XLRE
Outperforming – Technology (XLK), Communications (XLC), and Utilities (XLU)
The correction this past week found support at the 200-dma and we used that opportunity to bring our weightings in all three sectors back to target weights for now. These have “anti-virus” properties, so we are looking for the “risk hedge” relative to the broader market.
We did bring our healthcare positioning back to portfolio weight as the sector will ultimately benefit from a “cure” for the “coronavirus.” Also, with Bernie Sanders now lagging Joe Biden on the Democratic ticket, this removes some of the risk of “nationalized healthcare” from the sector.
Lagging – Industrials (XLI), Financials (XLF), Materials (XLB), and Energy (XLE)
We had started to buy a little energy exposure previously, but closed out of the positions as we were stopped out of our holdings for now. We are going to continue to monitor the space due to its extreme oversold condition and relative value, and will re-enter our positions when stability starts to take hold.
We also sold Financials due to the financial risk from a recessionary impact on the outstanding corporate debt which currently exists. The Fed’s rate cut also impacts the banks Net Interest Margins which makes them less attractive.
Current Position: None
Market By Market
Small-Cap (SLY) and Mid Cap (MDY) – Early last week we sold all small-cap and mid-cap exposure over concerns of the impact of the coronavirus. Remain out of these sectors for now.
Current Position: None
Emerging, International (EEM) & Total International Markets (EFA)
Same as small-cap and mid-cap. Given the spread of the virus and the impact on the global supply chain.
Current Position: None
Dividends (VYM), Market (IVV), and Equal Weight (RSP) – These positions are our long-term “core” positions for the portfolio given that over the long-term markets do rise with economic growth and inflation. We are currently maintaining our core positions unhedged for now. However, on a rally back to short-term resistance we will add hedges to the core.
Current Position:RSP, VYM, IVV, VOOG
Gold (GLD) – This past week, Gold continued its surge higher as stocks plunged lower. Gold is extremely overbought, so be patient for now and move stops up to the recent breakout levels. We sold our GDX position due to the fact mining is people-intensive and is located in countries most susceptible to the virus.
Bonds also broke out to new highs as the correction ensued. On Friday, we took profits in our 20-year bond position (TLT) to reduce our duration slightly, raise cash, and take in some profits. Bonds are extremely overbought now, so be cautious, we are maintaining the rest of our exposures for now but will look to hedge if we begin to see a reversal in rates.
Current Positions:DBLTX, SHY, IEF, PTIAX
Sector / Market Recommendations
The table below shows thoughts on specific actions related to the current market environment.
(These are not recommendations or solicitations to take any action. This is for informational purposes only related to market extremes and contrarian positioning within portfolios. Use at your own risk and peril.)
Portfolio/Client Update:
It’s been a brutal couple of weeks.
This is when portfolio management gets extremely difficult. It is when we have the biggest urge to give in to our emotions. It is when Mike and I lose the most sleep.
Staying true to our discipline and strategy is difficult in times like these. We question everything, every day. Are we in the right place? Do we have too much risk? Are we missing something?
The ghosts of 2000, and 2008, stalk us both, and we are overly protective of YOUR money. We do not take our jobs lightly.
Again this past week, we made some additional changes to the portfolio composition to reduce risk away from the “COVID-19” virus. This rebalancing of risk lowered overall equity exposure, and continued to shift away from risk.
As noted last week, we use WEEKLY signals in order to manage equity exposures and make portfolio adjustments. Therefore, signals are ONLY VALID after the close of business on Friday. Yesterday, we now have a CONFIRMED sell signal to reduce portfolio exposures to 75% of our target allocations.
Fortunately, we are already there, and the hedges in our portfolios, along with bonds, are doing their jobs. We took some further actions to increase cash, and take some profits, and sell some of our laggards.
Be assured we are watching your portfolios very closely. However, if you have ANY questions, comments, or concerns, please don’t hesitate to email me.
Portfolio Actions Taken Last Week
New clients:Only adding new positions as needed.
Dynamic Model: Sold all energy holdings RDS/A, AMLP.
Equity Model: Sold all energy holdings RDS/A, AMLP, and XOM. We were too early on the trade and got stopped out. We will watch for a bottom to re-enter the positions. Sold DOV, VMC, JPM to reduce exposure to Fed rate cuts and virus areas.
ETF Model: Sold XLB, XLI, AMLP, and XLF
Note for new clients:
It is important to understand that when we add to our equity allocations, ALL purchases are initially “trades” that can, and will, be closed out quickly if they fail to work as anticipated. This is why we “step” into positions initially. Once a “trade” begins to work as anticipated, it is then brought to the appropriate portfolio weight and becomes a long-term investment. We will unwind these actions either by reducing, selling, or hedging if the market environment changes for the worse.
THE REAL 401k PLAN MANAGER
A Conservative Strategy For Long-Term Investors
The 401k plan allocation plan below follows the K.I.S.S. principle. By keeping the allocation simplified, it allows for better control of the allocation, and closer tracking to the benchmark objective over time. (If you want to make it more complicated, you can, however, statistics show simply adding more funds does not increase performance to any significant degree.)
If you need help after reading the alert; do not hesitate to contact me.
Model performance is based on a two-asset model of stocks and bonds relative to the weighting changes made each week in the newsletter. This is strictly for informational and educational purposes only and should not be relied upon for any reason. Past performance is not a guarantee of future results. Use at your own risk and peril.
401k Plan Manager Live Model
As an RIA PRO subscriber(You get your first 30-days free) you have access to our live 401k p
The code will give you access to the entire site during the 401k-BETA testing process, so not only will you get to help us work out the bugs on the 401k plan manager, you can submit your comments about the rest of the site as well.
We are building models specific to company plans. So, if you would like to see your company plan included specifically, send me the following:
Name of the company
Plan Sponsor
A print out of your plan choices. (Fund Symbol and Fund Name)
If you would like to offer our service to your employees at a deeply discounted corporate rate, please contact me.
#FPC: Tips For A Volatile Market
These last couple of weeks have been crazy in the markets, last week we saw steady declines and this week we’re yo-yoing from one of the best days in the market to date to one of the worst. It seems like the sky is falling, it always does when we get into one of these environments, but fret not we’ve been here before. The question is what will you do different this time around? Since you’re here you’re probably already doing something different in reading the Real Investment Advice Newsletter, maybe you’re a client or a RIA Pro subscriber. Those resources will help you navigate these choppy waters.
Here are a few additional tips.
Understand that it’s ok to take profits and pay taxes.
Have a discipline to your investing approach.
Wall Street promotes an “it’s always a good time to buy” philosophy, but rarely does it give advice on when to reduce risk or increase it. For Wall Street it’s always about you… well, you staying invested. Have an exit strategy or a strategy to take profits, reduce risk and eliminate areas you no longer need to invest in. Markets change and so should your investments. Set it and forget it is not good enough.
Buy and hold is dead.
Portfolios should be monitored and changes should be made when needed. Not only when you visit or call your advisor. Buy, hold, monitor and sell. Buy and hold is for vampires who live forever, your life is finite. Getting back to even shouldn’t be a long term strategy.
Diversification is all but dead.
Wall Street will claim diversification is all you need, but we all know the type of diversification Wall Street refers to is all but dead. Markets are to intertwined in 2020, global supply chains, money flows, coordinated central bank interventions and the speed of information.
Speed of information is a loud, but silent killer to portfolios.
Years ago someone may be shot across the globe and we’d never hear about it or if we did by the time we received the information it was old news, outdated or like the game of telephone you may have played as a child: widely inaccurate. Now we get information in minutes if not seconds.
Everyone is an expert.
Have a Twitter account and an opinion or following and you are automatically an expert. There are many platforms out there for people to express their views, be careful what you consume. Facebook, Twitter or any other site may be a vacuum for your thoughts or may be a sales pitch in hiding. When I hear or see information I always want to know someone’s motive.
It’s ok to have a motive or promote your business. We promote ours daily by telling people what we do inside our business, how we invest and things you should be doing inside of your own financial plan.
Just remember, most of those so-called expert were in grade school during our last market down turn.
Nothing against being young, we were all there. But more and more advisors or experts have never been through a bear market. Many of these new investing platforms haven’t been around long enough to experience one either. A bear market or a recession does more than impact your investments it can take a part of your soul. It changes people, I’ve heard many older advisors who’ve been around the block that they may not make it through another bad market. The emotional toll and stress is real. If you’ve never experienced a bad market it’s difficult to guide people through it. All the more reason you must guard against elation and have a process surrounding your investments, your actions and your emotions.
Watch for the wolf in sheep’s clothing.
Fear sells. Period. We get lots of calls from readers, our daily radio show or podcast and our television interviews. A big question I get from prospects or in the form of a general question is do you guys sell annuities? Typically the reason why is they were told something bad about one, preyed on by an insurance salesman or have had a bad experience with one. I’m telling you this because just this last week I’ve had more calls asking about annuities with guarantees. Fixed annuities, fixed indexed annuities or any other that will guarantee 7%.
The reasoning for these calls is that fear sells. When markets are as volatile as they currently are we make some of our worst mistakes and the annuity sales force knows this. I’m not saying annuities are bad, just don’t get sold one and live to regret it. We believe that annuities should be planned for not sold.
Understand your financial plan.
Many have financial plans that use only the rosiest of data. Don’t be afraid to stress your plan, use low performance numbers, bad market returns, give yourself a raise annually-stress your plan! I’m not saying that any of those events above will happen, but what if they did? We want you to be prepared. Our job is to educate you on how all of your financial world combines to help you meet your goals and provide you with the best results and the retirement you hoped for your family.
Keep your cool.
This is difficult to do when you see your life’s savings eroding quickly. Markets are very reflexive when they are at extreme deviations and markets moving as quick as they have over these last couple of weeks can be a scary event. You will come out on the other side. The markets don’t just go up and no one has taken a recession out of the business cycle. It will be ok, if you work with a good advisor they have a plan, an exit strategy, maybe they’ve already reduced your equity exposure, they’ve accounted for this in your financial plan. It doesn’t feel good. Investing is difficult because we let our emotions get in the way.
Just because we CAN do something doesn’t mean we should. We’re often our own worst enemy.
Our brains and gimmicky marketing often get in our way. Have you ever seen the E Trade commercial where they tell you all about your high school buddy that trades on E Trade from his yacht or the Vanguard ad with the guy next to his personal plane? When the markets go up investing can be fairly easy, but what about when markets begin to drop? Dalbar did a study in 2019 that shows since 1988 the stock market’s average return has been 10% per year, but stock fund investors have earned only 4.1% annually. Why the big difference? Fear. Human nature is for us to get into something when it’s high and get out when it’s bad. We buy high and sell low even when we know the number one rule of investing is buy low and sell high. I need a degree in Psychology just as much as I do in Finance. We study Behavioral Finance to limit the biases, help with self control and help make rational decisions.
Communicate
Reach out to your advisor, we have sent numerous emails, videos, hold investor summits and one on one phone calls or meetings to discuss the overall impact and to reinforce the plan and strategy. This is when good advisors earn their keep.
If you have questions, concerns or want to know more about how to implement these strategies for your family please don’t hesitate to reach out. We’d love to help.
Three Ways to Avoid the ‘Lost Highway’ of Financial ‘Advice.’
Now boys don’t start to ramblin’ round On this road of sin are you sorrow bound Take my advice or you’ll curse the day You started rollin’ down that lost highway
Hank Williams.
On the road to personal financial milestones, investors aspire to reach multiple destinations that are important to them – whether it’s saving for a college education or retirement, we all seek to assess travel risks, regularly track progress and hope to avoid hazardous conditions.
We all long to -cheer – “I have arrived!”
However, there is imminent danger on the path to our destinations; like a low fog that hangs heavy, there are forces out there which blind and misdirect investors from the major road onto a lost highway. Unfortunately, obstacles to wealth are created by Wall Street, mainstream financial pundits and the social media they employ as a conduit of misinformation. And investors? You’re not off the hook. Your emotions are going to facilitate a major portfolio accident.
As I prepare framework for a screenplay “Lost Highway,” titled after a song written by Hank Williams, Sr., I gravitate to the Johnny Horton version which is slower, more haunting. Consider the ‘Lost Highway’ one of regret and foreboding, a weigh station between life and death, certainty and the unknown. Singer Johnny Horton, a spiritualist, knew for certain his demise was imminent and and it would be tragic. On November 5, 1960; at 2 am on a bridge in Milano Texas, Mr. Horton’s premonition became an unfortunate reality. More on that story later.
For now, it’s important for readers to navigate their own financial life highway and avoid the diversions which grow larger, deeper, as this bull market rages on.
As investors, let’s attempt to navigate away from these 3 financial potholes, shall we?
1 – As a retail investor, I’d avoid Twitter.
It’s called ‘FinTwit.’ A lost highway where financial experts who appear to know everything pat each other on the backs with joyous volleys of endless-scrolling bon mot. Most of these Twitter folk were running around the house in their Underoos during the last bear market or blew up portfolios during the financial crisis and conveniently chose to forget it because market recovery cures all ills – except for yours of course, because time is more valuable than money.
I mean, why not? The market recovery gave many advisors and big-box financial retailers a free pass. Of course, markets recover, don’t they? Sure they do. If you’re willing to wait a decade or so to break even. In the span of a human life, lots of events occur, lots of hair is lost, lots of wrinkles, lots of wealth stagnates over the years. The stock market is the Dorian Gray of money and the Twitter Twits believe you, as a human, have the lifespan of a vampire.
Let me show you.
Nothing wrong with Meb; he’s a very academic, smart guy. I like his work. I understand why he shared this tweet. But as my grandfather would say – OOFA! We’re being shamed as advisors for limited exposure to international stocks. I get it. It’s a big world out there. Most investors – professionals and novices – will never seek to invest outside their borders. And that’s a bad idea.
It’s a formidable, worldwide issue deemed Home Country Bias. However, over the last decade it’s been a fruitful endeavor for U.S. advisors and investors to diversify mostly among U.S. stocks. International money managers should have, in hindsight, been overweight in overseas or U.S. stocks. Home-based bias has cost them. The EliteTwits would scoff at me for writing this (not that I care), – I do not see a reason to invest in an asset class that underperforms for extended periods. I don’t find it of value to be diversified at all or at the least, greatly exposed to dormant asset classes just to ‘spread the risk.’
Diversification can indeed minimize specific company risk. If the majority of retail investors owned individual stock portfolios and sought to own ‘oil’ and ‘bleach’ in their portfolios from various countries, diversification from an unsystemic perspective would be effective. After all, if oil stocks falter, it’s most likely food & beverage stocks are thriving or at the least, not faltering as hard as non-cyclical stocks. Anybody you know still own individual stocks? Bueller? Heck, they don’t even split anymore.
Most investors today are encouraged to buy baskets of stocks through index funds or their exchange-traded brethren. So, if I own an investment that represents the S&P 500 and the MSCI EAFE Index i.e; international stocks, and one underperforms for an extended period of time, well then, why do I need to own it? Because mainstream financial media tells me so?
You must understand what diversification is and most crucial, what it isn’t. Certainly, it’s not the panacea it’s communicated to be. There’s no ‘free lunch,’ here, although I continue to hear and read this dangerous adage in the media and on Twitter. The word gets thrown around like a remedy for everything which ails a portfolio. It’s the industry’s ‘catch all’ that can lull investors into complacency, inaction.
So, who buys into this free lunch theory, again? After all, what is free on Wall Street? Investors who let their guard down, buy in to the myth of free lunches on Wall Street, find their money on the menu.
Due to unprecedented central bank intervention, there exists extreme distortion in stock and bond prices. Global risk-averse investors have purchased bonds with a voracious appetite. The odds of negative rates even at least briefly, can manifest here in the states. As I’ve lamented on the radio show in December and January – domestic interest rates will be lower in 2020.
A way to effectively manage risk has morphed into two disparate perceptions. The investor’s definition of diversification and that of the industry has parted, leaving an asset allocation plan increasingly vulnerable.
Today, the practice of diversification is Pablum. Watered down. Reduced to a dangerous buzzword.
What is the staid mainstream definition of diversification?
According to Investopedia – An internet reference guide on money and investments:
Diversification strives to smooth out unsystematic risk events in a portfolio so the positive performance of some investments neutralizes the negative performance of others. Therefore, the benefits of diversification hold only if the securities in the portfolio are not perfectly correlated.
Diversification benefits can be gained by investing in foreign securities because they tend to be less closely correlated with domestic investments. For example, an economic downturn in the U.S. economy may not affect Japan’s economy in the same way; therefore, having Japanese investments gives an investor a small cushion of protection against losses due to an American economic downturn.
Now let’s break down the lunch and examine how free it is.
Unsystematic risk – This is the risk the industry seeks to help you manage. It’s the risks related to failure of a specific business or underperformance of an industry.
To wit:
This is a company- or industry-specific hazard that is inherent in each investment. Unsystematic risk, also known as “nonsystematic risk,” “specific risk,” “diversifiable risk” or “residual risk,” can be reduced through diversification.
So, by owning stocks in different companies and in different industries, as well as by owning other types of securities such as Treasuries and municipal securities, investors will be less affected by an event or decision that has a strong impact on one company, industry or investment type.
So, think of it this way: A ‘diversified’ portfolio represents a blend of investments – stocks, bonds for example, that are designed to generate returns with less overall business risk. While this information is absolutely valid, the financial industry encourages you to think of diversification as risk management, which it isn’t.
Here’s what you need to remember:
Bleach (consumer staples) and oil (consumer cyclicals) eventually all run down-hill, in the same direction in corrections or bear markets.
Sure, ketchup or bleach may run behind, roll slower, but the direction is the one direction that destroys wealth – SOUTH. Large, small, international stocks. Regardless of the risk within different industries, stocks move together (they connect in down markets).
Consider:
What are the odds of one or two companies in a balanced portfolio to go bust or face an industry-specific hazard at the same time?
What’s the greater risk to you? One company going out of business or underperforming or your entire stock portfolio suffers losses great enough to change your life, alter your financial plan.
You already know the answer.
Diversification is not risk management, it’s risk reduction.
When your broker preaches diversification as a risk management technique, what does he or she mean?
It’s not risk management the pros believe in, but risk dilution.
There’s a difference. The misunderstanding can be painful.
To you, as an investor, diversification is believed to be risk management where portfolio losses are controlled or minimized. Think of risk management as a technique to reduce portfolio losses through down or bear cycles and the establishment of price-sell or rebalancing targets to maintain portfolio allocations. Consider risk dilution as method to spread or combine different investments of various risk to minimize volatility.
Even the best financial professionals only consider half the equation. Beware the lamb (risk management) in wolf’s clothing (risk dilution). The goal of risk dilution is to “cover all bases.” It employs vehicles, usually mutual funds, to cover every asset class so business risk can be managed. The root of the process is to spread your dollars and risk widely across and within asset classes like stocks and bonds to reduce company-specific risk.
There’s a false sense of comfort in covering your bases. Diversification in its present form is not effective reduce the risk you care about as an individual investor – risk of loss.
Today, risk dilution has become a substitute for risk management, but it should be a compliment to it. Risk dilution is a reduction of volatility or how a portfolio moves up or down in relation to the overall market.
Risk dilution works best during rising, or up markets as since most investments move together, especially stocks. Think about betting on every horse in a race.
In other words, a rising tide, raises all boats.
So, why is risk reduction not risk management, the prevailing sentiment?
Sales Goals: Most financial pros are saddled with aggressive sales goals. Risk dilution is a set and forget strategy. Ongoing risk management is time consuming and takes time away from the selling process. Unfortunately, the financial industry as a whole, has watered it down and broadened it to such a degree it’s become absolutely ineffective as a safeguard against losses. One reason are the sales targets that force financial representatives to spend less time with client portfolios.
Compliance Departments: A targeted diversification strategy places accountability on the advisor and poses risk to the firm. A wider approach makes it easier to vector responsibility to broad market ‘random walks’ so if a global crisis occurs and most assets move down together, an advisor and the compliance department, can “blame” everything outside their control. Here’s a perfect compliance department question: “so why isn’t this investor allocated appropriately to international stocks?” Appropriate for whom?
At RIA, we monitor global trends. We don’t believe investors need to participate in an asset class that’s been out of favor for over ten years. That doesn’t mean we won’t; it means our exposure has been minimal. That stance can change at any time. I mean, isn’t that what your advisor is supposed to do? The average investor holding period is less than two years. So imagine attempting to convince most investors to sit on poor performance for longer than decade. In the trenches, it’s never gonna happen.
I have hundreds of examples of Twitter commentary. that will send you down a Lost Highway. To repeat, my advice to retail investors: Please avoid the medium. It’s generally unhealthy for your psyche. Yes, we’re on Twitter too because we need to be. Avoid our feed too. Follow and read the blog instead.
2 – Avoid an ‘accumulation’ mindset if you’re five years or sooner from retirement, or you may never exit the Lost Highway.
Here’s another unusual tweet. I have yet to meet an investor, average, above-average, HUMAN, over the last 30 years who’s gained 300% after losing 30%. Those who are close to retirement must avoid information like this which fosters overconfidence and complacency.
Investors five years or less until retirement must avoid FOMO or Fear Of Missing Out, when it comes to blowing up their overall asset allocations; tempted to take on more risk than they’re prepared to handle. In January when the S&P 500 was three-standard deviations above its 200-week moving average, retirees or those close to retirement were questioning their tolerance for risk even though their portfolio returns were greater than four times the personalized benchmark rate required to achieve long-term financial goals.
Lance Roberts recently wrote: “There have only been a few points over the last 25-years where such deviations from the long-term mean were prevalent. In every case, the extensions were met by a decline, sometimes mild, sometimes much more extreme.”
And while we were trimming gains, rebalancing and facing challenges to add money to equities for new clients, tenured ones were wondering why we were being so cautious. Now that markets have fallen precipitously, the same retirees now question why they sought greater risk in the first place. Some of the same investors wonder why we’re buying at lower prices or dipping our pinky toe into stock waters. It’s an emotional roller-coaster that ostensibly will destroy portfolio returns.
As we teach around town at our popular Retirement Right Lane Classes, the financial services industry preaches a wholesale accumulation mindset where every downturn is a buying opportunity. However, retirees who are need to re-create a paycheck, withdraw a fixed amount or percentage from variable assets like stocks and bonds, must realize they need to protect capital over time and severe losses must be avoided. Limited losses are inevitable. That’s the price you pay for investing in stocks. If you cannot handle an ebb and flow of risk assets, you shouldn’t be invested in the market. It’s a harsh reality; the recent downturn my serve as a valuable lesson.
James B. Sandidge, JD in his paper “Adaptive Distribution Theory,” for The Journal of Investment Consulting, describes The Butterfly Effect for retirees. The effect refers to the ability of small changes early on in a process that lead to significant impact later.
Depending on the length of this correction and damage incurred, systematic withdrawal rates may need to stay the same (do not increase cash flow requirements in any year during the first 5 that has a negative return) or reduced altogether. James’ chart from his paper below, outlines how the sacred ‘4 percent withdrawal rule,’ can place a retiree in jeopardy if withdrawals aren’t monitored, revisited through bear market cycles.
3 – Emotions are going to be the demise of your portfolio performance.
I get it. Many investors – novice or seasoned – have forgotten markets correct; newer investors are hard-pressed to believe that bear markets are possible. I personally embrace rough markets. They provide valuable lessons, great wisdom; a dose of humility, a chance to purchase stocks at attractive prices. Each downturn is different and I take notes. It’s through times like this I’m thankful that I’m no longer with my former employer and part of a team who employs a surgical, rules-based sell discipline.
Tenured investors need to be reminded again that portfolios fluctuate! Being all in or all out of stocks is the worst move I’ve ever witnessed. In other words, selling all stocks low, purchasing again higher or ‘when the crisis blows over’ (already too late), tells me that you my friend, should avoid stocks at all costs, through every cycle. It’s a caveman reaction that will lead to very poor returns over time. Stocks are risk assets and over the last decade, we’ve forgotten what the word ‘risk’ means.
Oh, you will bleed through bear markets; it’s crucial not to hemorrhage. Can you surgically sell through down cycles like we do at RIA? If you have solid rules to do so, yes. Should you take a chainsaw to your wealth and sell everything in a panic? No. Personally, I’m using this downturn to place cash I’ve sat on for two years, selectively, slowly, to work in stocks. Our investment team is doing the same at RIA. We maintain a rules-based, three-prong approach to take profits, sell weak players and add to positions we believe are good opportunities.
I pray a prolonged downturn doesn’t turn off yet another generation of young adults from investing in equities. These generations have embraced Twitter, so I fear the messages they’ve taken in as gospel from the FinTwit stars over the years. I believe the FinTwit club members with insensitive tweets which outline how Jeff Bezos lost more wealth (to help followers keep the ‘downturn in perspective,’) are nothing short of idiocy. There’s no way in hell these people deal with clients on a consistent basis.
To keep it in perspective – Bezos, the founder of Amazon, bled close to $12 billion during the market downturn. Don’t feel bad: He’s still worth $116 billion. If you’re not seated at the Bezos table of wealth, big losses can derail future plans. However, an acceptable rate of loss must be accepted and built into a financial plan. Holistic investors are guided by rules; their guidebooks are their personalized financial plans. Investors who fly by the seat of their pants and get absorbed in fear and greed at bottoms and tops are going to find investing a disappointing experience.
Johnny Horton was a singer of folk/country story songs such as The Battle of New Orleans and Johnny Reb. However, my two favorites are North to Alaska and his rendition of Hank Williams’ Lost Highway. Mr. Horton was haunted by a premonition that he’d be killed by a drunk driver. So much so, he cancelled his attendance for the opening of the theatrical film, North to Alaska. He was hesitant to play the famous Skyline Club in Austin.
From Arden Lambert who wrote of the fatal night:
“Soon after the gig was over, he kissed his wife Billie Jean good-bye. Jean was Hank Williams’ widow whom Horton married a year after Williams’ death in 1952. Horton gave his goodbye kiss to Jean in the same place on the same cheek where Hank had kissed her after his last gig at the Skyline.
Horton, together with his bass player Tillman Franks and manager Tommy Tomlinson, headed to Shreveport, Louisiana. From the beginning, Franks noted that Horton was driving too fast (though that wasn’t new about him as he always drove fast). Suddenly, a pick-up truck smashed head-on into Horton’s car. Horton’s companions were severely injured, and he was still alive when the ambulance came. He died, however, on their way to the hospital.”
I imagine Johnny and his bass player still driving that fatal stretch of road in Milano, Texas. Forever trapped on the Lost Highway. Two men who died way too soon.
I implore that you don’t place your portfolio and emotions on a similar road.
Today, it’s easier than ever to do so.
Here’s Johnny’s version of the song. Let me know what you think…
Market Crash & Navigating What Happens Next 02-28-20
Market Crash & Navigating What Happens Next
MacroView: The Ghosts Of 2018
Financial Planning Corner: Why Dave Ramsey Is Wrong On Life Insurance
“With the market now trading 12% above its 200-dma, and well into 3-standard deviations of the mean, a correction is coming.’ But the belief is currently ‘more stimulus’ will offset the ‘virus.’
This is probably a wrong guess.
Extensions to this degree rarely last long without a correction. Maintain exposures, but tighten up stop-losses.”
Unfortunately, it escalated more rapidly than even we anticipated.
“It only took the S&P 500 six days to fall from an all-time high into correction levels, marking the broad index’s fastest drop of that magnitude outside of a one-day crash. Friday’s losses built on this week’s massive losses. The Dow and S&P 500 have fallen 14% and 13%, respectively, week to date. The two indexes were on pace for their biggest one-week loss since the 2008 financial crisis. The Nasdaq has lost 12.3% this week.” – CNBC
If that headline doesn’t startle you, you are also probably lacking a pulse.
However, it was two Monday’s ago, CNBC was cheering the market’s record highs and dismissing the impact of the virus as “it was just people getting sick in China.” We disagreed, which is why over the last several weeks, we have been detailing our warnings.
The correction this past week has been in the making for a while. It is why we have discussed carrying extra cash, adjusting our bond positioning, and rebalancing portfolio risks weekly for the past couple of months. Just as a reminder, this is what we wrote last week:
We have been concerned about the potential for a correction for the last three weeks.
We previously took profits near the market peak in January.
However, we did extend the duration of our bond portfolio a bit, and changed some of the underlying mixes of bonds, to prepare for a correction.
We are using this correction to rebalance some of our equity risks as well.
The bull market is still intact, so it is not time to be bearish in terms of positioning, just yet.
We are maintaining our hedges for now until we get a better understanding of where the markets are headed next.
While those actions did not entirely shield our portfolios for such a steep and swift correction, it did limit the damage to a great degree.
This now gives us an opportunity to use the correction as an opportunity to “buy assets” which are now oversold and have a much improved “risk vs reward” profile.
This is the advantage of “risk management” versus a “buy and hold” strategy. You can’t “buy cheap” if you don’t have any cash to “buy” with.
I want to use the rest the article this week to quickly review the market after the brutal selloff this past week. Here are the questions we want to answer:
Is the correction over?
Is this a buying opportunity?
Has the decade long bull market ended?
Let’s review some charts, and I will answer these questions at the end.
Daily
On a daily basis, the market is back to a level of oversold (top panel) rarely seen from a historical perspective. Furthermore, the rapid decline this week took the markets 5-standard deviations below the 50-dma.
To put this into some perspective, prices tend to exist within a 2-standard deviation range above and below the 50-dma. The top or bottom of that range constitutes 95.45% of ALL POSSIBLE price movements within a given period.
A 5-standard deviation event equates to 99.9999% of all potential price movement in a given direction.
This is the equivalent of taking a rubber band and stretching it to its absolute maximum.
Importantly, like a rubber band, this suggests the market “snap back” could be fairly substantial, and should be used to reduce equity risk, raise cash, and add hedges.
If we rework the analysis a bit, we can see in both the top and bottom panels the more extreme oversold condition. Assuming a short-term bottom was put in on Friday, a reflexive “counter-trend” rally will likely see the markets retrace back 38.2% to 50% of the previous decline.
Given the beating that many investors took over the past week, it is highly likely any short-term rallies will be met with more selling as investors try and “get out” of the market.
Weekly
On a weekly basis, the rising “bull trend support” from the 2016 lows is clear. That trend also coincides with our longer-term moving average which drives our allocation models.
Importantly, the market decline this past week DID NOT violate that trend currently, which suggests maintaining our allocation to equity risk in portfolios currently. However, the two longer-term sell signals, bottom panels, are close to registering a “risk reduction” change to our portfolios. (This will reduce our model from 100% to 75%)
With the market currently very oversold, individuals are quick to assume this is 2018 all over again. However, the technical backdrop from where the signals are being triggered is more akin to 2015-2016 (yellow highlights).Such suggests that a rally will likely give way to another decline before the final bottom is in place.
Monthly
This chart has ONE purpose, to tell us when a “bear market” has officially started.
On a monthly basis, the bulls remain in control. The decline in the market this past week wiped out all the “Fed Repo” gains from last October.
However, there are some VERY important points of concern that we will likely see play out over the rest of 2020.
The most important WARNING is the negative divergence in relative strength (top panel). This negative divergence was seen at every important market correction event over the last 25-years.
As we have noted previously:
“The market had triggered a ‘buy’ signal in October of last year as the Fed ‘repo’ operations went into overdrive. These monthly signals are ‘important,’ but it won’t take a tremendous decline to reverse those signals.
It’s okay to remain optimistic short-term, just don’t be complacent.”
As shown in the bottom two panels, both of the monthly “buy” signals are very close to reversing. It will take a breakout to “all-time highs” at this point to keep those signals from triggering. This lends support to our thesis of how the rest of 2020 will play out.
Let’s Answer Those Important Questions
Is the correction over?
Given the extreme 5-standard deviation below the 50-dma, combined with the massive short-term oversold condition discussed above, it is very likely we have seen the bulk of the correction on a short-term basis.
This is NOT an absolute statement, promise, or guarantee. It is the best guess. If there is a major outbreak of the virus in the U.S., or the Fed fails to act, or a myriad of other factors, another wave of selling could easily be sparked.
Is this a buying opportunity?
For longer-term investors, people close to, or in, retirement, or for individuals who don’t pay close attention to the markets or their investments, this is NOT a buying opportunity.
While we have, and will, likely add some “trading rentals” to our portfolio for a reflexive bounce, they will be sold appropriately, risk reduced, and hedges added accordingly.
Let me be clear.
There is currently EVERY indication given the speed and magnitude of the decline, that any short-term reflexive bounce will likely fail. Such a failure will lead to a retest of the recent lows, or worse, the beginning of a bear market brought on by a recession.
Please read that last sentence again.
Has the decade long bull market ended?
As noted in the last chart above, the bull market that began in 2009 has NOT ended as of yet. This keeps our portfolios primarily long-biased at the current time.
With that said, our primary concern is that the impact on the global supply chain in China, South Korea, and Japan will have much more severe economic impacts than currently anticipated which will likely push the U.S. economy towards a recession later this year.(This is something the collapsing yield curve is already suggesting.)
Importantly, the global supply chain is an exogenous risk that monetary interventions can NOT alleviate.(Supplying liquidity to financial markets does not fix plants being closed, people slowing consumption, transportation being halted, etc.)
As noted in the monthly chart above, it is entirely possible that by mid-summer we could well be dealing with a recessionary economic environment, slower earnings growth, and rising unemployment. Such will cause markets to reprice current valuations leading to the onset of a bear market.
The purpose of the analysis above is to provide you with the information to make educated guesses about the “probabilities” versus the “possibilities” of what could occur in the markets over the months ahead.
It is absolutely “possible” the markets could find a reason to rally back to all-time highs and continue the bullish trend. (For us, such would be the easiest and best outcome.)
However, the analysis currently suggests the risks currently outweigh potential reward and a deeper correction is the most “probable” at this juncture.
Don’t take that statement lightly.
I am suggesting reducing risk opportunistically, and being pragmatic about your portfolio, and your money.
Here are our rules that we will be following on the next rally.
Move slowly. There is no rush in making dramatic changes. Doing anything in a moment of “panic” tends to be the wrong thing.
If you are over-weight equities, DO NOT try and fully adjust your portfolio to your target allocation in one move. Again, after big declines, individuals feel like they “must” do something. Think logically above where you want to be and use the rally to adjust to that level.
Begin by selling laggards and losers. These positions were dragging on performance as the market rose and they led on the way down.
Add to sectors, or positions, that are performing with, or outperforming the broader market if you need risk exposure.
Move “stop-loss” levels up to recent lows for each position. Managing a portfolio without “stop-loss” levels is like driving with your eyes closed.
Be prepared to sell into the rally and reduce overall portfolio risk. There are a lot of positions you are going to sell at a loss simply because you overpaid for them to begin with. Selling at a loss DOES NOT make you a loser. It just means you made a mistake. Sell it, and move on with managing your portfolio. Not every trade will always be a winner. But keeping a loser will make you a loser of both capital and opportunity.
If none of this makes any sense to you – please consider hiring someone to manage your portfolio for you. It will be worth the additional expense over the long term.
While we remain optimistic about the markets currently, we are also taking precautionary steps of tightening up stops, adding non-correlated assets, raising some cash, and looking to hedge risk opportunistically on any rally.
Everyone approaches money management differently. This is just our approach to the process of controlling risk.
We hope you find something useful in it.
The MacroView
If you need help or have questions, we are always glad to help. Just email me.
This is what our RIAPRO.NETsubscribers are reading right now!
Sector & Market Analysis
Technical Gauges
Sector Rotation Analysis
Portfolio Positioning
Sector & Market Recommendations
Client Portfolio Updates
Live 401k Plan Manager
THE REAL 401k PLAN MANAGER
A Conservative Strategy For Long-Term Investors
The 401k plan allocation plan below follows the K.I.S.S. principle. By keeping the allocation simplified, it allows for better control of the allocation, and closer tracking to the benchmark objective over time. (If you want to make it more complicated, you can, however, statistics show simply adding more funds does not increase performance to any significant degree.)
If you need help after reading the alert; do not hesitate to contact me.
Model performance is based on a two-asset model of stocks and bonds relative to the weighting changes made each week in the newsletter. This is strictly for informational and educational purposes only and should not be relied upon for any reason. Past performance is not a guarantee of future results. Use at your own risk and peril.
401k Plan Manager Live Model
As an RIA PRO subscriber(You get your first 30-days free) you have access to our live 401k p
The code will give you access to the entire site during the 401k-BETA testing process, so not only will you get to help us work out the bugs on the 401k plan manager, you can submit your comments about the rest of the site as well.
We are building models specific to company plans. So, if you would like to see your company plan included specifically, send me the following:
Name of the company
Plan Sponsor
A print out of your plan choices. (Fund Symbol and Fund Name)
If you would like to offer our service to your employees at a deeply discounted corporate rate, please contact me.
“With the market now trading 12% above its 200-dma, and well into 3-standard deviations of the mean, a correction is coming.’ But the belief is currently ‘more stimulus’ will offset the ‘virus.’
This is probably a wrong guess.
Extensions to this degree rarely last long without a correction. Maintain exposures, but tighten up stop-losses.”
Unfortunately, it escalated more rapidly than even we anticipated.
“It only took the S&P 500 six days to fall from an all-time high into correction levels, marking the broad index’s fastest drop of that magnitude outside of a one-day crash. Friday’s losses built on this week’s massive losses. The Dow and S&P 500 have fallen 14% and 13%, respectively, week to date. The two indexes were on pace for their biggest one-week loss since the 2008 financial crisis. The Nasdaq has lost 12.3% this week.” – CNBC
If that headline doesn’t startle you, you are also probably lacking a pulse.
However, it was two Monday’s ago, CNBC was cheering the market’s record highs and dismissing the impact of the virus as “it was just people getting sick in China.” We disagreed, which is why over the last several weeks, we have been detailing our warnings.
The correction this past week has been in the making for a while. It is why we have discussed carrying extra cash, adjusting our bond positioning, and rebalancing portfolio risks weekly for the past couple of months. Just as a reminder, this is what we wrote last week:
We have been concerned about the potential for a correction for the last three weeks.
We previously took profits near the market peak in January.
However, we did extend the duration of our bond portfolio a bit, and changed some of the underlying mixes of bonds, to prepare for a correction.
We are using this correction to rebalance some of our equity risks as well.
The bull market is still intact, so it is not time to be bearish in terms of positioning, just yet.
We are maintaining our hedges for now until we get a better understanding of where the markets are headed next.
While those actions did not entirely shield our portfolios for such a steep and swift correction, it did limit the damage to a great degree.
This now gives us an opportunity to use the correction as an opportunity to “buy assets” which are now oversold and have a much improved “risk vs reward” profile.
This is the advantage of “risk management” versus a “buy and hold” strategy. You can’t “buy cheap” if you don’t have any cash to “buy” with.
I want to use the rest the article this week to quickly review the market after the brutal selloff this past week. Here are the questions we want to answer:
Is the correction over?
Is this a buying opportunity?
Has the decade long bull market ended?
Let’s review some charts, and I will answer these questions at the end.
Daily
On a daily basis, the market is back to a level of oversold (top panel) rarely seen from a historical perspective. Furthermore, the rapid decline this week took the markets 5-standard deviations below the 50-dma.
To put this into some perspective, prices tend to exist within a 2-standard deviation range above and below the 50-dma. The top or bottom of that range constitutes 95.45% of ALL POSSIBLE price movements within a given period.
A 5-standard deviation event equates to 99.9999% of all potential price movement in a given direction.
This is the equivalent of taking a rubber band and stretching it to its absolute maximum.
Importantly, like a rubber band, this suggests the market “snap back” could be fairly substantial, and should be used to reduce equity risk, raise cash, and add hedges.
If we rework the analysis a bit, we can see in both the top and bottom panels the more extreme oversold condition. Assuming a short-term bottom was put in on Friday, a reflexive “counter-trend” rally will likely see the markets retrace back 38.2% to 50% of the previous decline.
Given the beating that many investors took over the past week, it is highly likely any short-term rallies will be met with more selling as investors try and “get out” of the market.
Weekly
On a weekly basis, the rising “bull trend support” from the 2016 lows is clear. That trend also coincides with our longer-term moving average which drives our allocation models.
Importantly, the market decline this past week DID NOT violate that trend currently, which suggests maintaining our allocation to equity risk in portfolios currently. However, the two longer-term sell signals, bottom panels, are close to registering a “risk reduction” change to our portfolios. (This will reduce our model from 100% to 75%)
With the market currently very oversold, individuals are quick to assume this is 2018 all over again. However, the technical backdrop from where the signals are being triggered is more akin to 2015-2016 (yellow highlights).Such suggests that a rally will likely give way to another decline before the final bottom is in place.
Monthly
This chart has ONE purpose, to tell us when a “bear market” has officially started.
On a monthly basis, the bulls remain in control. The decline in the market this past week wiped out all the “Fed Repo” gains from last October.
However, there are some VERY important points of concern that we will likely see play out over the rest of 2020.
The most important WARNING is the negative divergence in relative strength (top panel). This negative divergence was seen at every important market correction event over the last 25-years.
As we have noted previously:
“The market had triggered a ‘buy’ signal in October of last year as the Fed ‘repo’ operations went into overdrive. These monthly signals are ‘important,’ but it won’t take a tremendous decline to reverse those signals.
It’s okay to remain optimistic short-term, just don’t be complacent.”
As shown in the bottom two panels, both of the monthly “buy” signals are very close to reversing. It will take a breakout to “all-time highs” at this point to keep those signals from triggering. This lends support to our thesis of how the rest of 2020 will play out.
Let’s Answer Those Important Questions
Is the correction over?
Given the extreme 5-standard deviation below the 50-dma, combined with the massive short-term oversold condition discussed above, it is very likely we have seen the bulk of the correction on a short-term basis.
This is NOT an absolute statement, promise, or guarantee. It is the best guess. If there is a major outbreak of the virus in the U.S., or the Fed fails to act, or a myriad of other factors, another wave of selling could easily be sparked.
Is this a buying opportunity?
For longer-term investors, people close to, or in, retirement, or for individuals who don’t pay close attention to the markets or their investments, this is NOT a buying opportunity.
While we have, and will, likely add some “trading rentals” to our portfolio for a reflexive bounce, they will be sold appropriately, risk reduced, and hedges added accordingly.
Let me be clear.
There is currently EVERY indication given the speed and magnitude of the decline, that any short-term reflexive bounce will likely fail. Such a failure will lead to a retest of the recent lows, or worse, the beginning of a bear market brought on by a recession.
Please read that last sentence again.
Has the decade long bull market ended?
As noted in the last chart above, the bull market that began in 2009 has NOT ended as of yet. This keeps our portfolios primarily long-biased at the current time.
With that said, our primary concern is that the impact on the global supply chain in China, South Korea, and Japan will have much more severe economic impacts than currently anticipated which will likely push the U.S. economy towards a recession later this year.(This is something the collapsing yield curve is already suggesting.)
Importantly, the global supply chain is an exogenous risk that monetary interventions can NOT alleviate.(Supplying liquidity to financial markets does not fix plants being closed, people slowing consumption, transportation being halted, etc.)
As noted in the monthly chart above, it is entirely possible that by mid-summer we could well be dealing with a recessionary economic environment, slower earnings growth, and rising unemployment. Such will cause markets to reprice current valuations leading to the onset of a bear market.
The purpose of the analysis above is to provide you with the information to make educated guesses about the “probabilities” versus the “possibilities” of what could occur in the markets over the months ahead.
It is absolutely “possible” the markets could find a reason to rally back to all-time highs and continue the bullish trend. (For us, such would be the easiest and best outcome.)
However, the analysis currently suggests the risks currently outweigh potential reward and a deeper correction is the most “probable” at this juncture.
Don’t take that statement lightly.
I am suggesting reducing risk opportunistically, and being pragmatic about your portfolio, and your money.
Here are our rules that we will be following on the next rally.
Move slowly. There is no rush in making dramatic changes. Doing anything in a moment of “panic” tends to be the wrong thing.
If you are over-weight equities, DO NOT try and fully adjust your portfolio to your target allocation in one move. Again, after big declines, individuals feel like they “must” do something. Think logically above where you want to be and use the rally to adjust to that level.
Begin by selling laggards and losers. These positions were dragging on performance as the market rose and they led on the way down.
Add to sectors, or positions, that are performing with, or outperforming the broader market if you need risk exposure.
Move “stop-loss” levels up to recent lows for each position. Managing a portfolio without “stop-loss” levels is like driving with your eyes closed.
Be prepared to sell into the rally and reduce overall portfolio risk. There are a lot of positions you are going to sell at a loss simply because you overpaid for them to begin with. Selling at a loss DOES NOT make you a loser. It just means you made a mistake. Sell it, and move on with managing your portfolio. Not every trade will always be a winner. But keeping a loser will make you a loser of both capital and opportunity.
If none of this makes any sense to you – please consider hiring someone to manage your portfolio for you. It will be worth the additional expense over the long term.
While we remain optimistic about the markets currently, we are also taking precautionary steps of tightening up stops, adding non-correlated assets, raising some cash, and looking to hedge risk opportunistically on any rally.
Everyone approaches money management differently. This is just our approach to the process of controlling risk.
We hope you find something useful in it.
The MacroView
If you need help or have questions, we are always glad to help. Just email me.
Be sure and catch our updates on Major Markets (Monday) and Major Sectors (Tuesday) with updated buy/stop/sell levels
Sector-by-Sector
Everything was crushed this past week, so the difference between leading and lagging sectors is which sector fell faster or slower than the S&P 500 index itself.
Improving – Discretionary (XLY), Real Estate (XLRE), and Utilities (XLU)
As noted previously, we reduced exposure to Utilities, Real Estate, and Discretionary due to their extreme overbought condition.
This past week, the correction alleviated much of that condition so we are now looking for opportunistic adds to our portfolio. However, since these sectors are interest rate sensitive, with yields extremely compressed, we will enter positions as needed very cautiously.
We previously recommended taking profits in Technology, which has not only been leading the market but has gotten extremely overbought. The correction this past week found support at the 200-dma and the sector is extremely oversold. We will look for a reasonable opportunity to add to our technology and communication sectors as they are less prone to the coronavirus impact.
We noted previously we had added to our healthcare positioning slightly. The correction to this sector this past week was brutal but we are looking to add more to our holdings as healthcare will ultimately benefit from healthcare needs from the impact of the virus.
Lagging – Industrials (XLI), Financials (XLF), Staples (XLP), Materials (XLB), and Energy (XLE)
All of these sectors are back to oversold. We are looking for a counter-trend bounce to sell Industrials and Materials which are most susceptible to supply chain disruptions. We are starting to buy a little energy exposure this past week and are going to continue to add to that space due to its extreme oversold condition and relative value. We will also SELL Financials due to the financial risk from a recessionary impact on the outstanding corporate debt which currently exists.
Current Position: Reduced weight XLY, XLP, Full weight AMLP, 1/2 weight XLF, XLB and XLI
Market By Market
Small-Cap (SLY) and Mid Cap (MDY) – Early last week we sold all small-cap and mid-cap exposure over concerns of the impact of the coronavirus. Remain out of these sectors for now.
Current Position: None
Emerging, International (EEM) & Total International Markets (EFA)
Same as small-cap and mid-cap. Given the spread of the virus and the impact on the global supply chain, not to mention the rising U.S. dollar, all exposures were sold early this past week.
Current Position: None
Dividends (VYM), Market (IVV), and Equal Weight (RSP) – These positions are our long-term “core” positions for the portfolio given that over the long-term markets do rise with economic growth and inflation. We are currently maintaining our core positions unhedged for now. However, on a rally back to short-term resistance we will add hedges to the core.
Current Position:RSP, VYM, IVV, VOOG
Gold (GLD) – This past week, Gold continued its surge higher as stock markets fell into a correction. Gold is extremely overbought, so be patient for now and move stops up to the recent breakout levels. We sold our GDX position due to the fact mining is people-intensive and is located in countries most susceptible to the virus.
Bonds also broke out to new highs as the correction ensued. On Friday, we took profits in our 20-year bond position (TLT) to reduce our duration slightly, raise cash, and take in some profits. Bonds are extremely overbought now, so be cautious, we are maintaining the rest of our exposures for now but will look to hedge if we begin to see a reversal in rates.
Current Positions:DBLTX, SHY, IEF, PTIAX
Sector / Market Recommendations
The table below shows thoughts on specific actions related to the current market environment.
(These are not recommendations or solicitations to take any action. This is for informational purposes only related to market extremes and contrarian positioning within portfolios. Use at your own risk and peril.)
Portfolio/Client Update:
Wow.
As noted last week:
Over the last couple of weeks, we have made some minor changes to the portfolio which change very little in terms of the overall makeup. While this rebalancing of risk did not dramatically increase equity exposure, we are very aware of our positioning and risk and will take action accordingly.
We are being deliberately slow in on-boarding client portfolios into our models, and are monitoring risks very closely. We are not in a rush to make any drastic moves in either direction, and prefer to wait for the market to “tell us” what we need to do.
We have taken profits, moved up stop-loss levels, and have hedged our risks. We will take action when necessary.”
Here is the problem.
We use WEEKLY signals in order to manage equity exposures and make portfolio adjustments. Therefore, signals are ONLY VALID after the close of business on Friday.
This keeps portfolio turnover lower and reduces the “whipsaw” effect of one or two-day declines. However, weekly signals become ineffective when you have a 14% decline within a single week.
Fortunately, we had already hedged our portfolios to some degree, and had taken some actions to increase cash, take some profits, and add some “rental trades” for a reflexive rally. Those “rentals” will be sold and replaced with hedges as necessary.
Be assured we are watching your portfolios very closely. However, if you have ANY questions, comments, or concerns, please don’t hesitate to email me.
Portfolio Actions Taken Last Week
New clients:Slowing adding exposure as needed.
Dynamic Model: Added to VOOG last week, sold our short-position to take in the profit. We also begin building some positions in RDS/A, AMLP and will be adding to XOM which are now 5-standard deviations oversold. We will sell some positions on a reflexive rally and reinstate our hedges.
Equity Model: Sold TLT, GDX, DEM, EFV, and SLYV to raise cash. Added a small “rental” of VOOG and started building exposure in RDS/A.
ETF Model: Sold TLT, DEM, EFV and SLYV. Added a small “rental” of VOOG and added exposure in AMLP. We will start building exposure to XLE shortly, and will be selling XLB, XLI, and XLF on a rally.
Note for new clients:
It is important to understand that when we add to our equity allocations, ALL purchases are initially “trades” that can, and will, be closed out quickly if they fail to work as anticipated. This is why we “step” into positions initially. Once a “trade” begins to work as anticipated, it is then brought to the appropriate portfolio weight and becomes a long-term investment. We will unwind these actions either by reducing, selling, or hedging if the market environment changes for the worse.
THE REAL 401k PLAN MANAGER
A Conservative Strategy For Long-Term Investors
The 401k plan allocation plan below follows the K.I.S.S. principle. By keeping the allocation simplified, it allows for better control of the allocation, and closer tracking to the benchmark objective over time. (If you want to make it more complicated, you can, however, statistics show simply adding more funds does not increase performance to any significant degree.)
If you need help after reading the alert; do not hesitate to contact me.
Model performance is based on a two-asset model of stocks and bonds relative to the weighting changes made each week in the newsletter. This is strictly for informational and educational purposes only and should not be relied upon for any reason. Past performance is not a guarantee of future results. Use at your own risk and peril.
401k Plan Manager Live Model
As an RIA PRO subscriber(You get your first 30-days free) you have access to our live 401k p
The code will give you access to the entire site during the 401k-BETA testing process, so not only will you get to help us work out the bugs on the 401k plan manager, you can submit your comments about the rest of the site as well.
We are building models specific to company plans. So, if you would like to see your company plan included specifically, send me the following:
Name of the company
Plan Sponsor
A print out of your plan choices. (Fund Symbol and Fund Name)
If you would like to offer our service to your employees at a deeply discounted corporate rate, please contact me.
Earnings Lies & Why Munger Says “EBITDA is Bull S***”
Earnings Worse Than You Think
Just like the hit series “House Of Cards,” Wall Street earnings season has become rife with manipulation, deceit and obfuscation that could rival the dark corners of Washington, D.C.
What is most fascinating is that so many individuals invest hard earned capital based on these manipulated numbers. The failure to understand the “quality” of earnings, rather than the “quantity,” has always led to disappointing outcomes at some point in the future.
“Non-GAAP financials are not audited and are most often disclosed through earnings press releases and investor presentations, rather than in the company’s annual report filed with the Securities and Exchange Commission.
Once upon a time, non-GAAP financials were used to isolate the impact of significant one-time events like a major restructuring or sizable acquisition. In recent years, they have become increasingly prevalent and prominent, used by both the shiniest new-economy IPO companies and the old-economy stalwarts.”
Back in the 80’s and early 90’s companies used to report GAAP earnings in their quarterly releases. If an investor dug through the report they would find “adjusted” and “proforma” earnings buried in the back.
Today, it is GAAP earnings which are buried in the back hoping investors will miss the ugly truth.
These “adjusted or Pro-forma earnings” exclude items that a company deems “special, one-time or extraordinary.” The problem is that these “special, one-time” items appear “every” quarter leaving investors with a muddier picture of what companies are really making.
An in-depth study by Audit Analytics revealed that 97% of companies in the S&P 500 used non-GAAP financials in 2017, up from 59% in 1996, while the average number of different non-GAAP metrics used per filing rose from 2.35 to 7.45 over two decades.
This growing divergence between the earnings calculated according to accepted accounting principles, and the “earnings” touted in press releases and analyst research reports, has put investors at a disadvantage of understanding exactly what they are paying for.
As BofAML stated:
“We are increasingly concerned with the number of companies (non-commodity) reporting earnings on an adjusted basis versus those that are stressing GAAP accounting, and find the divergence a consequence of less earnings power.
Consider that when US GDP growth was averaging 3% (the 5 quarters September 2013 through September 2014) on average 80% of US HY companies reported earnings on an adjusted basis. Since September 2014, however, with US GDP averaging just 1.9%, over 87% of companies have reported on an adjusted basis. Perhaps even more telling, between the end of 2010 and 2013, the percentage of companies reporting adjusted EBITDA was relatively constant, and since 2013, the number has been on a steady rise.
So, why do companies regularly report these Non-GAAP earnings? Drew has the answer:
“When management is asked why they resort to non-GAAP reporting, the most common response is that these measures are requested by the analysts and are commonly used in earnings models employed to value the company. Indeed, sell-side analysts and funds with a long position in the stock may have incentives to encourage a more favorable alternative presentation of earnings results.”
If non-GAAP reporting is used as a supplemental means to help investors identify underlying trends in the business, one might reasonably expect that both favorable and unfavorable events would be “adjusted” in equal measure.
Why has there been such a rise is Non-GAAP reporting?
Money, of course.
“A recent study from MIT has found that when companies make large positive adjustments to non-GAAP earnings, their CEOs make 23 percent more than their expected annual compensation would be if GAAP numbers were used. This is despite such firms having weak contemporaneous and future operating performance relative to other firms.” –Financial Executives International.
The researchers at MIT combed through the annual earnings press releases of S&P 500 firms for fiscal years 2010 through 2015 and recorded GAAP net income and non-GAAP net income when the firms disclosed it. About 67 percent of the firms in the sample disclose non-GAAP net income.
The researchers then obtained CEO compensation, accounting, and return data for the sample firms and found that “firms making the largest positive non-GAAP adjustments… exhibit the worst GAAP performance.”
The CEOs of these firms, meanwhile, earned about 23 percent more than would be predicted using a compensation model; in terms of raw dollars. In other words, they made about $2.7 million more than the approximately $12 million of an average CEO.
It should not be surprising that anytime you compensate individuals based on some level of performance, they are going to figure out ways to improve performance, legal or not. Examples run rampant through sports from Barry Bonds to Lance Armstrong, as well as in business from Enron to WorldCom.
“One out of five [20%] U.S. finance chiefs have been scrambling to fiddle with their companies’ earnings.”
This rather “open secret” of companies manipulating bottom line earnings by utilizing “cookie-jar” reserves, heavy use of accruals, and other accounting instruments to flatter earnings is not new.
“The tricks are well-known: A difficult quarter can be made easier by releasing reserves set aside for a rainy day or recognizing revenues before sales are made, while a good quarter is often the time to hide a big ‘restructuring charge’ that would otherwise stand out like a sore thumb.
What is more surprising though is CFOs’ belief that these practices leave a significant mark on companies’ reported profits and losses. When asked about the magnitude of the earnings misrepresentation, the study’s respondents said it was around 10% of earnings per share.“
Manipulating earnings may work in the short-term, eventually, cost cutting, wage suppression, earnings adjustments, share-buybacks, etc. reach an effective limit. When that limit is reached, companies can no longer hide the weakness in their actual operating revenues.
There’s a big difference between companies’ advertised performance, and how they actually did. We discussed this recently by looking at the growing deviation between corporate earnings and corporate profits. There has only been one other point where earnings, and stock market prices, were surging while corporate profits were flat. Shortly thereafter, we found out the “truth” about WorldCom, Enron, and Global Crossing.
TheAmerican Accounting Association found that over the past decade or so, more companies have shifted to emphasizing adjusted earnings. But those same companies’ results under generally accepted accounting principles, or GAAP, often only match or slightly exceed analysts’ predictions.
“There are those who might claim that so far this century the U.S. economy has experienced such an unusual period of economic growth that it has taken analysts and investors by surprise each quarter … for almost two decades. This view strains credulity.” – Paul Griffin, University of California & David Lont, University of Otago
After reviewing hundreds of thousands of quarterly earnings forecasts and reports of 4,700 companies over 17 years, Griffin and Lont believe companies shoot well above analysts’ targets because consistently beating earnings per share by only a penny or two became a red flag.
“If they pull out all the accounting tricks to get their earnings much higher than expected, then they are less likely to be accused of manipulation.”
The truth is that stocks go up when companies beat their numbers, and analysts are generally biased toward wanting the stock they cover to go up. As we discussed in “Chasing The Market”, it behooves analysts to consistently lower their estimates so companies can beat them, and adjusted earnings are making it easier for them to do it.
For investors, the impact from these distortions will only be realized during the next bear market. For now, there is little help for investors as the Securities and Exchange Commission has blessed the use of adjusted results as long as companies disclose how they are calculated. The disclosures are minimal, and are easy to get around when it comes to forecasts. Worse, adjusted earnings are used to determine executive bonuses and whether companies are meeting their loan covenants. No wonder CEO pay, and leverage, just goes up.
Conclusion & Why EBITDA Is BullS***
Wall Street is an insider system where legally manipulating earnings to create the best possible outcome, and increase executive compensation has run amok,. The adults in the room, a.k.a. the Securities & Exchange Commission, have “left the children in charge,”but will most assuredly leap into action to pass new regulations to rectify reckless misbehavior AFTER the next crash.
For fundamental investors, the manipulation of earnings not only skews valuation analysis, but specifically impacts any analysis involving earnings such as P/E’s, EV/EBITDA, PEG, etc.
“One of the things that I thought that I knew well was the importance of income-based metrics such as EBITDA, and that cash flow information is not as important. It turned out that common garden variety metrics, such as EBITDA, could be hazardous to your health.”
The article is worth reading and chocked full of good information, however, here are the four-crucial points:
EBITDA is not a good surrogate for cash flow analysis because it assumes that all revenues are collected immediately and all expenses are paid immediately, leading to a false sense of liquidity.
Superficial common garden-variety accounting ratios will fail to detect signs of liquidity problems.
Direct cash flow statements provide a much deeper insight than the indirect cash flow statements as to what happened in operating cash flows. Note that the vast majority (well over 90%) of public companies use the indirect format.
EBITDA, just like net income is very sensitive to accounting manipulations.
The last point is the most critical. As Charlie Munger recently stated:
“I think there are lots of troubles coming. There’s too much wretched excess.
I don’t like when investment bankers talk about EBITDA, which I call bulls— earnings.
It’s ridiculous. EBITDA does not accurately reflect how much money a company makes, unlike traditional earnings. Think of the basic intellectual dishonesty that comes when you start talking about adjusted EBITDA. You’re almost announcing you’re a flake.”
In a world of adjusted earnings, where every company is way above average, every quarter, investors quickly lose sight of what matters most in investing.
“This unfortunate cycle will only be broken when the end-users of financial reporting — institutional investors, analysts, lenders, and the media — agree that we are on the verge of systemic failure in financial reporting. In the history of financial markets, such moments of mental clarity most often occur following the loss of vast sums of capital.” – American Accounting Association
Imaginary worlds are nice, it’s just impossible to live there.
Did The Market Just Get Infected?
Did The Market Just Get Infected?
MacroView: Japan, The Fed, & The Limits Of QE
Financial Planning Corner: Part 2: Dave Ramsey Is Wrong About Life Insurance
“As noted last week: ‘With the market now trading 12% above its 200-dma, and well into 3-standard deviations of the mean, a correction is coming.’ But the belief is currently ‘more stimulus’ will offset the ‘virus.’
This is probably a wrong guess.
Extensions to this degree rarely last long without a correction. Maintain exposures, but tighten up stop-losses.”
That correction came hard, and fast on Thursday and Friday.
For the week, the market declined, but it was the “5-Horseman Of The Rally”(Apple, Microsoft, Google, Facebook, Amazon) which led the way lower. This is the first time we have seen a real rotation out of the “momentum chase” into fixed income and was a point we discussed in Thursday’s RIAPRO Intermarket Analysis Report. To wit:
“Stocks and bonds play an interesting ‘risk on/risk off’ relationship over time. As shown above while stocks are extremely outperforming bonds currently, the relationship is now suppressed to levels where a reversion would be expected. This suggests that we will likely see a a correction in equity prices, and a rise in bond prices (yields lower), in the near future.”
Currently, this is just a correction within the ongoing bullish trend, however, there are things occurring that do not rule out the possibility of a larger correction in the short-term.
Carl Swenlin from Decision Point (h/t G. O’Brien) came to a similar conclusion.
“Yesterday (Thursday) SPY penetrated the bottom of a short-term rising wedge, but couldn’t make it stick. Today was a different story, but the support line drawn across the January top impeded excessive downward progress. The VIX didn’t quite reach the bottom Bollinger Band, but it is possible that we will see continued weak price action similar to the short January decline if the VIX breaks through the band. Being so close to the band, the VIX is also oversold, so it is also possible that we’ll see a bounce.”
“The intermediate-term market trend is UP and the condition is SOMEWHAT OVERBOUGHT. The negative divergences spell trouble, and all four indicators are below their signal line and falling.
The market has been so resilient that it is hard to think that anything more than a minor pullback is possible. A critical breakdown below the January top hasn’t happened yet, but that could be the first move on Monday. Indicators in the short- and intermediate-term are falling, and negative divergences are abundant, so I think that next week will be negative. That may just be the beginning.”
We agree with that assessment. Remember, it never just starts raining; clouds gather, skies darken, wind speeds pick up, and barometric pressures decline. When you have a consensus of the evidence, you typically carry an umbrella.
Evidence is clearly mounting, and one of the bigger concerns to the market, and particularly to the commodity space, is the surge in the U.S. dollar. This past Monday, we wrote:
“As noted previously, the dollar has rallied back to that all important previous resistance line. IF the dollar can break back above that level, and hold, then commodities, and oil, will likely struggle.”
That is exactly what happened over the last two weeks and the dollar has strengthened that rally as concerns over the ‘coronavirus’ persist. With the dollar testing previous highs, a break above that resistance could result in a sharp move higher for the dollar.
The rising dollar is not bullish for Oil, commodities or international exposures. The ‘sell’ signal has began to reverse. Pay attention.”
This surge in the dollar is also responsible for the sharp drop in bond yields as money is flooding into USD denominated assets due to the coming global impact from the coronavirus.
This is a substantial risk to the markets over the rest of this year which has not been factored into asset prices as of yet.
Furthermore, the main driver behind stock prices since last October has been the flood of liquidity from the Federal Reserve. However, that push of liquidity has quietly gone subsided over the last few weeks.
This was well telegraphed by the Fed previously but was reasserted this past week as the Fed noted it was in no rush to cut rates and would continue reducing “repo operations,” both into, and following, April.
Given the “bull thesis” has been “liquidity trumps all other risks,” with the Fed funds rate at 1.5% currently, and liquidity flows being reduced, “risks” now have a stronger hand. When you combine reduced liquidity with a surging U.S. Dollar, and collapsing yields, investors should reassess their positioning accordingly.
As my friend Victor Adair from Polar Futures Group stated on Friday:
“The EURUSD jumped sharply (after falling steadily YTD) and the spooz took another leg down. Could there have been a European institutional account positioned in US stocks which suddenly decided, like the Jeremy Irons character in the Margin Call movie, that they didn’t “hear the music” anymore, and decide to sell? If they had owned US stocks without hedging their FX risk the temptation to hit the SELL button given the recent huge rallies in both US stocks and the US Dollar would have been huge! I think the S&P 500 can continue lower.”
Positioning Review & Update
We have been concerned about the potential for a correction for the last three weeks. Given that we previously took profits near the market peak in January, there was not a tremendous amount of work we needed to do on the equity side of the ledger.
However, this past Monday we did extend the duration of our bond portfolio a bit, and changed some of the underlying mixes of bonds, to prepare for a correction. With the sharp yield spike over the last couple of days, those positioning changes worked well to reduce volatility.
We are using this correction to rebalance some of our equity risks as well. The bull market is still intact, so it is not time to be bearish in terms of positioning, just yet. However, we are maintaining our hedges for now until we get a better understanding of where the markets are headed next.
Currently, there are several levels of support short-term. The market bounced off initial support at the 38.2% retracement level at the end of the day on Friday. However, we suspect we will likely see more follow-through next week, particularly if the dollar continues to strengthen. Downside risk currently resides at 3250, but a break below that level will suggest a much bigger correction is underway.
Longer-term, given the unrecognized impact of the virus on the economy, we expect a bigger decline down the road. As Doug Kass noted on Thursday:
“Caution is warranted. What we have all learned of the virus is that it is easily transmitted. It is asymptomatic, well established and it is spreading. As I have also noted its spreading has been under reported and, unlike other market headwinds, the liquidity provided by central bankers will have NO impact on the damage inflicted by the virus’ contagion.
Among other issues, global travel will be decimated and this will have unusual ‘knock on’ effects. Tourists, especially Chinese ones, spend lots of money. This will be a GLOBAL problem as China was to be a source of big growth for this sector. Retailers of EVERYTHING are going to miss budgets and economies like Japan and South Korea are going to be devastated by the impact.
In Japan, this will come after a massive (and ill timed) tax increase. Tech will play the role of major (not minor) collateral damage as long held supply chains are damaged/crushed.
Most investors, focused on price action, have little idea what could hit them.”
We are keenly aware of the risk, and while we are not “selling heavily and moving to cash” currently, it doesn’t mean we won’t.
We are paying attention to what the market is saying, and following directions accordingly.
Are you?
The MacroView
If you need help or have questions, we are always glad to help. Just email me.
See You Next Week
By Lance Roberts, CIO
Financial Planning Corner
REGISTER NOW: RIGHT-LANE RETIREMENT WORKSHOP
When:February 29th, 9-11 am (Social Security, Medicare, Income planning, Investing & More)
This is what our RIAPRO.NETsubscribers are reading right now!
Sector & Market Analysis
Technical Gauges
Sector Rotation Analysis
Portfolio Positioning
Sector & Market Recommendations
Client Portfolio Updates
Live 401k Plan Manager
THE REAL 401k PLAN MANAGER
A Conservative Strategy For Long-Term Investors
The 401k plan allocation plan below follows the K.I.S.S. principle. By keeping the allocation simplified, it allows for better control of the allocation, and closer tracking to the benchmark objective over time. (If you want to make it more complicated, you can, however, statistics show simply adding more funds does not increase performance to any significant degree.)
If you need help after reading the alert; do not hesitate to contact me.
Model performance is based on a two-asset model of stocks and bonds relative to the weighting changes made each week in the newsletter. This is strictly for informational and educational purposes only and should not be relied upon for any reason. Past performance is not a guarantee of future results. Use at your own risk and peril.
401k Plan Manager Live Model
As an RIA PRO subscriber(You get your first 30-days free) you have access to our live 401k p
The code will give you access to the entire site during the 401k-BETA testing process, so not only will you get to help us work out the bugs on the 401k plan manager, you can submit your comments about the rest of the site as well.
We are building models specific to company plans. So, if you would like to see your company plan included specifically, send me the following:
Name of the company
Plan Sponsor
A print out of your plan choices. (Fund Symbol and Fund Name)
If you would like to offer our service to your employees at a deeply discounted corporate rate, please contact me.
RIA PRO: Did The Market Just Get Infected?
Did The Market Just Get Infected?
MacroView: Japan, The Fed, & The Limits Of QE
Financial Planning Corner: Part 2: Dave Ramsey Is Wrong About Life Insurance
“As noted last week: ‘With the market now trading 12% above its 200-dma, and well into 3-standard deviations of the mean, a correction is coming.’ But the belief is currently ‘more stimulus’ will offset the ‘virus.’
This is probably a wrong guess.
Extensions to this degree rarely last long without a correction. Maintain exposures, but tighten up stop-losses.”
That correction came hard, and fast on Thursday and Friday.
For the week, the market declined, but it was the “5-Horseman Of The Rally”(Apple, Microsoft, Google, Facebook, Amazon) which led the way lower. This is the first time we have seen a real rotation out of the “momentum chase” into fixed income and was a point we discussed in Thursday’s RIAPRO Intermarket Analysis Report. To wit:
“Stocks and bonds play an interesting ‘risk on/risk off’ relationship over time. As shown above while stocks are extremely outperforming bonds currently, the relationship is now suppressed to levels where a reversion would be expected. This suggests that we will likely see a a correction in equity prices, and a rise in bond prices (yields lower), in the near future.”
Currently, this is just a correction within the ongoing bullish trend, however, there are things occurring that do not rule out the possibility of a larger correction in the short-term.
Carl Swenlin from Decision Point (h/t G. O’Brien) came to a similar conclusion.
“Yesterday (Thursday) SPY penetrated the bottom of a short-term rising wedge, but couldn’t make it stick. Today was a different story, but the support line drawn across the January top impeded excessive downward progress. The VIX didn’t quite reach the bottom Bollinger Band, but it is possible that we will see continued weak price action similar to the short January decline if the VIX breaks through the band. Being so close to the band, the VIX is also oversold, so it is also possible that we’ll see a bounce.”
“The intermediate-term market trend is UP and the condition is SOMEWHAT OVERBOUGHT. The negative divergences spell trouble., and all four indicators are below their signal line and falling.
The market has so resilient that it is hard to think that anything more than a minor pullback is possible. A critical breakdown below the January top hasn’t happened yet, but that could be the first move on Monday. Indicators in the short- and intermediate-term are falling, and negative divergences are abundant, so I think that next week will be negative. That may just be the beginning.”
We agree with that assessment. Remember, it never just starts raining; clouds gather, skies darken, wind speeds pick up, and barometric pressures decline. When you have a consensus of the evidence, you typically carry an umbrella.
Evidence is clearly mounting, and one of the bigger concerns to the market, and particularly to the commodity space, is the surge in the U.S. dollar. This past Monday, we wrote:
“As noted previously, the dollar has rallied back to that all important previous resistance line. IF the dollar can break back above that level, and hold, then commodities, and oil, will likely struggle.”
That is exactly what happened over the last two weeks and the dollar has strengthened that rally as concerns over the ‘coronavirus’ persist. With the dollar testing previous highs, a break above that resistance could result in a sharp move higher for the dollar.
The rising dollar is not bullish for Oil, commodities or international exposures. The ‘sell’ signal has began to reverse. Pay attention.”
This surge in the dollar is also responsible for the sharp drop in bond yields as money is flooding into USD denominated assets due to the coming global impact from the coronavirus.
This is a substantial risk to the markets over the rest of this year which has not been factored into asset prices as of yet.
Furthermore, the main driver behind stock prices since last October has been the flood of liquidity from the Federal Reserve. However, that push of liquidity has quietly gone subsided over the last few weeks.
This was well telegraphed by the Fed previously but was reasserted this past week as the Fed noted it was in no rush to cut rates and would continue reducing “repo operations,” both into, and following, April.
Given the “bull thesis” has been “liquidity trumps all other risks,” with the Fed funds rate at 1.5% currently, and liquidity flows being reduced, “risks” now have a stronger hand. When you combine reduced liquidity with a surging U.S. Dollar, and collapsing yields, investors should reassess their positioning accordingly.
“The EURUSD jumped sharply (after falling steadily YTD) and the spooz took another leg down. Could there have been a European institutional account positioned in US stocks which suddenly decided, like the Jeremy Irons character in the Margin Call movie, that they didn’t “hear the music” anymore, and decide to sell? If they had owned US stocks without hedging their FX risk the temptation to hit the SELL button given the recent huge rallies in both US stocks and the US Dollar would have been huge! I think the S&P 500 can continue lower.”
Positioning Review & Update
We have been concerned about the potential for a correction for the last three weeks. Given that we previously took profits near the market peak in January, there was not a tremendous amount of work we needed to do on the equity side of the ledger.
However, this past Monday we did extend the duration of our bond portfolio a bit, and changed some of the underlying mixes of bonds, to prepare for a correction. With the sharp yield spike over the last couple of days, those positioning changes worked well to reduce volatility.
We are using this correction to rebalance some of our equity risks as well. The bull market is still intact, so it is not time to be bearish in terms of positioning, just yet. However, we are maintaining our hedges for now until we get a better understanding of where the markets are headed next.
Currently, there are several levels of support short-term. The market bounced off initial support at the 38.2% retracement level at the end of the day on Friday. However, we suspect we will likely see more follow-through next week, particularly if the dollar continues to strengthen. Downside risk currently resides at 3250, but a break below that level will suggest a much bigger correction is underway.
Longer-term, given the unrecognized impact of the virus on the economy, we expect a bigger decline down the road. As Doug Kass noted on Thursday:
“Caution is warranted. What we have all learned of the virus is that it is easily transmitted. It is asymptomatic, well established and it is spreading. As I have also noted its spreading has been under reported and, unlike other market headwinds, the liquidity provided by central bankers will have NO impact on the damage inflicted by the virus’ contagion.
Among other issues, global travel will be decimated and this will have unusual ‘knock on’ effects. Tourists, especially Chinese ones, spend lots of money. This will be a GLOBAL problem as China was to be a source of big growth for this sector. Retailers of EVERYTHING are going to miss budgets and economies like Japan and South Korea are going to be devastated by the impact.
In Japan, this will come after a massive (and ill timed) tax increase. Tech will play the role of major (not minor) collateral damage as long held supply chains are damaged/crushed.
Most investors, focused on price action, have little idea what could hit them.”
We are keenly aware of the risk, and while we are not “selling heavily and moving to cash” currently, it doesn’t mean we won’t.
We are paying attention to what the market is saying, and following directions accordingly.
Are you?
The MacroView
If you need help or have questions, we are always glad to help. Just email me.
See You Next Week
By Lance Roberts, CIO
Financial Planning Corner
REGISTER NOW: RIGHT-LANE RETIREMENT WORKSHOP
When:February 29th, 9-11 am (Social Security, Medicare, Income planning, Investing & More)
Be sure and catch our updates on Major Markets (Monday) and Major Sectors (Tuesday) with updated buy/stop/sell levels
Sector-by-Sector
Improving – Discretionary (XLY), Real Estate (XLRE), and Utilities (XLU)
As noted previously, we reduced exposure to Utilities, Real Estate, and Discretionary due to their extreme overbought condition. Unfortunately, that overbought extension has not been alleviated enough at this time to add back to our holdings. We started to see a bit of correction in Discretionary this past week, but the plunge in yields pushed Real Estate and Utilities further into orbit. We will see a correction in yield-related positions in the next couple of weeks.
We previously recommended taking profits in Technology, which has not only been leading the market but has gotten extremely overbought. The correction in the markets last week hit the Technology sector the hardest, but Communications fell also. Hold positions for now, and be patient and let this correction play itself out before adding exposure.
We noted previously we had added to our healthcare positioning slightly. No changes are required currently, but the current correction is pulling some of the overbought conditions out of the sector. We will re-evaluate our holdings next week.
Lagging – Industrials (XLI), Financials (XLF), Staples (XLP), Materials (XLB), and Energy (XLE)
On Thursday and Friday, we finally begin to see the early signs of the correction we have been talking about over the last couple of weeks. The correction did little so far to work off the extreme overbought and extended conditions. However, it is a start and we will wait and see what happens from here.
If we get sectors back to oversold, and markets are holding the bullish trendline support, we will recommend adding exposure to these areas. For now, be patient.
Current Position: Reduced weight XLY, XLP, Full weight AMLP, 1/2 weight XLF, XLB and XLI
Market By Market
Small-Cap (SLY) and Mid Cap (MDY) – Despite the rally in the broader markets, Small- and Mid-caps continue to underperform currently. Both markets sold off on Friday, with Small-cap stocks breaking below support at the 50-dma. Mid-caps look stronger but failed at recent highs establishing a short-term double top. Neither small or mid-caps are oversold currently, so there is more risk to the downside particularly if we begin to see further economic impacts from the corona-virus.
Current Position: KGGIX, SLYV
Emerging, International (EEM) & Total International Markets (EFA)
Emerging and International Markets, look a lot like small-caps above. Both had gotten extremely overbought and needed to correct. That correction broke support and their respective 50-dma. With neither market oversold currently, and the dollar getting stronger, we are likely going to close our of our positions on any bounce next week that fails to move above the 50-dma.
Current Position:EFV, DEM
Dividends (VYM), Market (IVV), and Equal Weight (RSP) – These positions are our long-term “core” positions for the portfolio given that over the long-term markets do rise with economic growth and inflation. We are currently maintaining our core positions unhedged for now. If we see deterioration in the broader markets, we will begin to add short-positions to hedge our long-term core holdings.
Current Position:RSP, VYM, IVV
Gold (GLD) – Over the last few weeks, we have been discussing that gold has been consolidating near recent highs. This past week, Gold broke out and surged higher as stock markets fell into a correction. Gold is extremely overbought, so be patient for now and move stops up to the recent breakout levels.
Bonds also broke out to new highs on Friday as the dollar rallied as money rotated into bonds for “safety” as the market weakened. After previously recommending adding to bonds, hold current positions for now. Bonds are extremely overbought now, so be cautious, we added a small portion of TLT to portfolios last week, and added PTIAX to rebalance weighting and extend our current duration.
Current Positions:DBLTX, SHY, IEF, Added TLT & PTIAX
Sector / Market Recommendations
The table below shows thoughts on specific actions related to the current market environment.
(These are not recommendations or solicitations to take any action. This is for informational purposes only related to market extremes and contrarian positioning within portfolios. Use at your own risk and peril.)
Portfolio/Client Update:
Finally, the market cracked last week and gave us a little room to operate. It is too early to become too “negative,” as the market is still convinced the Fed will intervene sooner, or later, with liquidity to offset the risk of the coronavirus. Despite the “sell-off” on Friday, investors don’t want to “miss out” on the liquidity party when it happens, so we will likely see the “buy the dip” crowd show up next week.
Over the last couple of weeks, we have made some minor changes to the portfolio which change very little in terms of the overall makeup. While this rebalancing of risk did not dramatically increase equity exposure, we are very aware of our positioning and risk and will take action accordingly.
We are being deliberately slow in on-boarding client portfolios into our models, and are monitoring risks very closely. We are not in a rush to make any drastic moves in either direction, and prefer to wait for the market to “tell us” what we need to do.
We taken profits, moved up stop-loss levels, and have hedged our risks. We will take action when necessary.
Be assured we are watching your portfolios very closely. However, if you have ANY questions, comments, or concerns, please don’t hesitate to email me.
Portfolio Actions Taken Last Week
New clients:Slowing adding exposure as needed.
Dynamic Model: Added 1/2 position in VOOG on Friday, as we continue to build out our “core” equity positioning in the portfolio. We still remain hedged with the Short-S&P 500 position to balance risk while trying to build out the overall model.
Equity Model: Sold 1/2 of DBLTX and added an equal amount of PTIAX to rebalance our bond exposure in portfolios to further hedge downside risk.
ETF Model: Sold 1/2 of DBLTX and added an equal amount of PTIAX to rebalance our bond exposure in portfolios to further hedge downside risk.
Note for new clients:
It is important to understand that when we add to our equity allocations, ALL purchases are initially “trades” that can, and will, be closed out quickly if they fail to work as anticipated. This is why we “step” into positions initially. Once a “trade” begins to work as anticipated, it is then brought to the appropriate portfolio weight and becomes a long-term investment. We will unwind these actions either by reducing, selling, or hedging if the market environment changes for the worse.
THE REAL 401k PLAN MANAGER
A Conservative Strategy For Long-Term Investors
The 401k plan allocation plan below follows the K.I.S.S. principle. By keeping the allocation simplified, it allows for better control of the allocation, and closer tracking to the benchmark objective over time. (If you want to make it more complicated, you can, however, statistics show simply adding more funds does not increase performance to any significant degree.)
If you need help after reading the alert; do not hesitate to contact me.
Model performance is based on a two-asset model of stocks and bonds relative to the weighting changes made each week in the newsletter. This is strictly for informational and educational purposes only and should not be relied upon for any reason. Past performance is not a guarantee of future results. Use at your own risk and peril.
401k Plan Manager Live Model
As an RIA PRO subscriber(You get your first 30-days free) you have access to our live 401k p
The code will give you access to the entire site during the 401k-BETA testing process, so not only will you get to help us work out the bugs on the 401k plan manager, you can submit your comments about the rest of the site as well.
We are building models specific to company plans. So, if you would like to see your company plan included specifically, send me the following:
Name of the company
Plan Sponsor
A print out of your plan choices. (Fund Symbol and Fund Name)
If you would like to offer our service to your employees at a deeply discounted corporate rate, please contact me.
#FPC: Dave Ramsey Is Right & Very Wrong About Permanent Life Insurance (Pt. 2)
Last week’s piecewas on why Dave Ramsey is right and wrong about permanent life insurance and some of the reasons you may consider using a permanent life insurance policy.
To reiterate last week’s sentiment-permanent life insurance is not for most, but if you:
Max out your retirement savings
Make too much to contribute to a Roth
Have accumulated a large savings account
Want to gain flexibility from taxes
Want growth, but would like some protection from high valuations
Have a large estate that needs estate tax protection
Keep reading…
Let’s discuss some of the benefits of these policy’s:
No 1099’s– your cash value isn’t taxed year to year like most non-qualified investments, in fact if used properly the funds will never be taxed
Distributions aren’t considered income (when done properly) so unlike your pre-tax 401K, you’ll be using these funds tax free, which will be a big deal in retirement
No Income limitations-that’s right say goodbye to those income limitations most are familiar with on IRA’s
No Contribution Limits– it’s difficult to super charge your savings in tax free or tax deferred accounts due to the contribution limits. In 2020, you can contribute $19,500 to an employer sponsored plan with a catch-up provision of $6,500 for those over 50. In an IRA you’re much more limited. You may contribute up to $6,000 with an additional $1,000 catch up provision for workers 50 or older. Another great tool that’s finally gaining the recognition it deserves is the HAS or Health Savings Account. If you have access to an HSA an individual may contribute $3,550 and a family can contribute $7,100. If you’re maxing out all of these and hopefully utilizing a Roth you’re likely in pretty good shape, but where do those additional funds go?
No age requirement for distributions– cash value can be used at any time. Need funds for kid’s college, or retired early prior to 59 1/2-no problem.
Likelihood of tax reform impacting your policy is low– this is a little loop-hole that many think may change in the future because of the ability to grow and distribute funds on a tax free basis. With the path the government is on I’m concerned not to have this tool. The 80’s were the last time changes were made to these types of plans and current policy holders were grandfathered to have no changes made to their policies, but only impacting future policy holders. The belief is that the precedent has been set and it would be unfair to materially impact the plans already underway.
Creditor Protection-most all states offer some sort of creditor protection some full and some partial. Check with your state to determine how protected you are from potential creditors or judgments.
All these advantageous aspects why don’t we hear more about these types of tools or why do they get a bad wrap?
Dave Ramsey is right. They’re not for everyone. BUT for the few who already know how to save, high income earners or those just looking to be a little more strategic this could be a viable option.
I think many also have an aversion to these products because they are misunderstood or they felt the pressure of someone trying to make a hard sell. Let’s be very clear, a recommendation for such a policy should only come after a thorough financial plan is done. We often say planned, not sold, they are a complex piece to an already complicated puzzle.
Buyer Beware:
Many agents, or “financial advisors,” who sell insurance are held captive to 1 firm and 1 product or are limited in some way. Here I use the term “financial advisors” very loosely, because many are just salesman trying to make a quick buck, not advisors. Have hammer, see nail. Unfortunately, it’s not that easy or at least it shouldn’t be.
I believe any and all financial decisions should be made holistically by looking at the big picture through a telescope and then bringing it back down to each star in your universe with a microscope. Not sparing any detail. After all, each piece of the puzzle must fit and work together. Ideally, you want to work with someone who is independent from working only with one firm so they may scorch the earth to find the best policy for you and your family.
Life insurance, or an annuity, is also not a tool you put all of your funds in and if anyone advises so, RUN!
In the coming weeks we’ll discuss how to use permanent life insurance for cash accumulation or estate planning, what to look for in a policy and the different types of permanent life insurance available.
6 Considerations for Long-Term Care Coverage.
Retirement is a a continuous road; mile markers that represent age may be visualized along the path.
However, if one looks to retire at 67 and in relatively good health, it’s a challenge to comprehend what quality of life may be like at 80. It’s easy to understand how 40 may not look too different from 60 from a quality of health perspective. The stretch from 60 to 90 may be so dramatically different, it’s a challenge to envision.
How does one contemplate their own increasing frailty?
People tend to avoid the topic of long-term care which is defined as financial and caregiver resources required to perform daily activities such as bathing and dressing. Services range from temporary home health services to full-time care through assisted living or memory care. At RIA, we find that investors are hesitant to confront the topic of long-term care. It’s understandable. After all, the mitigation of long-term care risk is expensive. People barely save enough for retirement, overall. Imagine planning for the possible additional six-figure burden of long-term care services.
Also, consumers don’t understand how coverage works, premiums have the ability to skyrocket every few years which can break constrained budgets, and insurance underwriting can be a challenge. It’s reported that over 30% of those who apply for traditional long-term care coverage are rejected for health reasons. Realistically, after age 62, premiums become cost prohibitive for consumers. It’s in their mid-sixties we find people scramble to put together some patchwork plan. We call long-term care the ‘financial elephant in the room.’ You can try to lift it, move it to another area of your financial house however, wherever you go, there it is!
As we lament at workshops, on the radio, to clients at face-to-face meetings – heck, to anybody who’ll listen! – Long-term care expenses are the greatest threat to a secure retirement. Confounding about this specific study is that over 53% of Boomers are confident about managing long-term care costs yet the majority have nothing set aside. The results lead me to conclude there’s a strong and dangerous case of DENIAL going on here. Is there more to the story? Since 50% of middle-income Boomers maintain less than $5,000 in emergency reserves, saving for retirement AND retirement care is most likely too burdensome.
Don’t ignore the elephant. Prepare for it. If traditional long-term care insurance isn’t in your future, hope isn’t lost. Consider these alternatives.
Bankers Life Center for Secure Retirement in a study conducted by Blackstone Group in October 2018, discovered that middle-income Baby Boomers (those with an annual household income between $30 and $100,000 and have less than $1 million in investable assets), are increasingly concerned about staying healthy enough to enjoy retirement (56%). Yet, an astounding 4 in 5 (79%) of Boomers sampled have no money set aside specifically for retirement care needs.
First Step: Don’t Ignore the Elephant!
Your rightful concern, if I got you thinking, is to take a deep breath and find a Certified Financial Planner® who is also a fiduciary. In other words, your interests above all else. Financial plans laud strengths; plans also expose financial vulnerabilities that require remedy.
Per the Center For A Secure Retirement® study, six out of ten Baby Boomers have a plan for how they will fund retirement. Only one-third have a retirement long-term care strategy which leads me to believe this group is not undertaking holistic financial planning which considers every facet of a fiscal life including the possible need for long-term care from custodial to skilled nursing. I’m not surprised that 88% of Boomers who have included a retirement care strategy reported a positive impact to their overall plan.
Second Step: Cover the Spouse Who’ll Most Likely Live Longest.
I’m not going to lie; the mitigation of long-term care risk using insurance isn’t cheap. According to the American Association for Long-Term Care Insurance, the best age to apply is in your mid-fifties. To obtain coverage, the current condition of your health matters or you may not qualify. Only 38% of those age 60-69 make the cut. Even if healthy, at a point in life, especially around the mid-sixties, premiums are known to be household budget nightmare. For example, a couple both age 60 in a preferred health class can wind up paying close to $5,000 a year in premiums and will likely experience premium increases over time.
The number of insurance carriers is shrinking – down to less than 12 from more than 100. Recently, Genworth, one of the heavy hitter providers of long-term care insurance temporarily suspended sales of traditional individual policies and an annuity product designed to provide income to cover long-term costs such as nursing home stays.
If you’re astute enough to plan for retirement care and concerned about the impact of dual premiums on the household budget including saving for other goals, work with a Certified Financial Planner to create a scenario to consider at least partial coverage for the spouse with a greater probability of longevity. For example, on average, women outlive men by 7 years.
If single and do not have a reason to leave a legacy to children or grandchildren, it’s likely that asset liquidation can adequately cover a long-term care event. Again, it’s best to work with a CFP Fiduciary who can help create a liquidation strategy.
Third Step: Take the Kids Out of It.
I’m shocked by parents who assume their adult children will take care of them or ‘take them in’ in the case of a long-term care event. Personally, I find it too painful to interrupt my daughter’s life and impact her physical, emotional and financial health by providing long-term assistance to her dad.
According to www.caregiver.org, 44 million Americans provide $37 billion hours of unpaid informal care for adult family members and friends with chronic illnesses and conditions. Women provide over 75% of caregiving support. Caregiving roles are going to do nothing but blossom in importance as the 65+ age cohort is expected to double by 2030. There will be a tremendous negative impact, financial as well as emotional, on family caregivers who will possibly need to suspend employment, dramatically interrupt their own lives to assist loved ones who require assistance with activities of daily living.
Parents must begin a dialogue with adult children to determine if or how they may become caregivers. Armed with information learned from discussion, I have helped children prepare for some form of caregiving for parents.
A 47-year-old client has added financial support for parents as a specific needs-based goal in her plan; another recently purchased a larger one-story home with an additional and easily accessible bedroom and bath. Yet another has commenced building a granny pod on his property for his elderly (and still independent), mother. All these actions have taken place due to open, continuous dialogue with parents and siblings.
In addition, elder parents have been receptive to allocating financial resources to aid caregiver children. Siblings who reside too far away to provide day-to-day support have been willing to offer financial support as well. However, these initiatives weren’t pushed on children. Children weren’t forced into a situation based on an assumption. If you’re a parent, ask children if they’d be willing to provide care. As an adult child, don’t be afraid to ask parents how they plan to cover long-term care expenses.
Fourth Step: Get Creative.
Three out of every five financial plans I create reflect deficiencies to meet long-term care expenses. Medical insurance like Medicare does not cover long-term care expenses – a common misperception. Close to 56% of people surveyed in the Bankers Life Center study are under the false impression that Medicare covers long-term care expenses.
Genworth’s results assume an annual 3% inflation rate. In today’s dollars a home-health aide who assists with cleaning, cooking, and other responsibilities for those who seek to age in place or require temporary assistance with activities of daily living, can cost over $45,000 a year in the Houston area. On average, these services may be required for 3 years – a hefty sum of $137,000. We use a 4.25-4.5% inflation rate for financial planning purposes to reflect recent median annual costs for assisted living and nursing home care.
As I examine long-term care policies issued recently vs. those 10 years or later, it’s glaringly obvious that coverage isn’t as comprehensive and costs more prohibitive. It will require unorthodox thinking to get the job done.
One option is to consider a reverse mortgage, specifically a home equity conversion mortgage. The horror stories about these products are way overblown. The most astute of planners and academics study and understand how for those who seek to age in place, incorporating the equity from a primary residence in a retirement income strategy or as a method to meet long-term care costs can no longer be ignored. Those who talk down these products are speaking out of lack of knowledge and falling easily for overblown, pervasive false narratives.
Reverse mortgages have several layers of costs (nothing like they were in the past), and it pays for consumers to shop around for the best deals. Understand to qualify for a reverse mortgage, the homeowner must be 62, the home must be a primary residence and the debt limited to mortgage debt. There are several ways to receive payouts.
One of the smartest strategies is to establish a reverse mortgage line of credit at age 62, leave it untapped and allowed to grow along with the value of the home. The line may be tapped for long-term care expenses if needed or to mitigate sequence of poor return risk in portfolios. Simply, in years where portfolios are down, the reverse mortgage line can be used for income thus buying time for the portfolio to recover. Once assets do recover, rebalancing proceeds or gains may be used to pay back the reverse mortgage loan consequently restoring the line of credit.
Our planning software allows our team to consider a reverse mortgage in the analysis. Those plans have a high probability of success. We explain that income is as necessary as water when it comes to retirement. For many retirees, converting the glacier of a home into the water of income using a reverse mortgage is going to be required for retirement survival and especially long-term care expenses.
American College Professor Wade Pfau along with Bob French, CFA are thought leaders on reverse mortgage education and have created the best reverse mortgage calculator I’ve studied. To access the calculator and invaluable analysis of reverse mortgages click here.
Insurance companies are currently creating products that have similar benefits of current long-term care policies along with features that allow beneficiaries to receive a policy’s full death benefit equal to or greater than the premiums paid. The long-term care coverage which is linked to a fixed-premium universal life policy, allows for payments to informal caregivers such as family or friends, does not require you to submit monthly bills and receipts, have less stringent underwriting criteria and allow an option to recover premiums paid if services are not rendered (after a specified period).
Unfortunately, to purchase these policies you’ll need to come up with a policy premium of $50,000 either in a lump sum or paid over five to ten years. However, for example, paying monthly for 10 years can be more cost effective than traditional long-term care policies, payments remain fixed throughout the period (a big plus), and there’s an opportunity to have premiums returned to you if long-term care isn’t necessary (usually five years from the time your $50,000 premium is paid in full). Benefit periods can range from 3-7 years and provide two to five times worth of premium paid for qualified long-term care expenses. As a benchmark, keep in mind the average nursing home stay is three years.
I personally went with this hybrid strategy. For a total of $60,000 in premium, I purchased six years of coverage, indexed for inflation, for a total benefit of close to $190,000.
Also, pay closer attention to your employers’ benefits open enrollment. It’s amazing to discover how many people have bypassed or didn’t realize their employers offer long-term care insurance coverage. Those with health issues and possibly ineligible for coverage in the open marketplace will find employer-offered long-term care insurance their best deal.
Fifth Step: Formalize a Liquidation/Downsize Plan.
Consider a liquidation/downsizing hierarchy to subsidize long-term care costs. According to a Deutsche Bank report from January 2018 titled US Wealth and Income Inequality, a record high 30% of Americans hold no wealth outside their primary residences which makes me wonder how that group is going to fund retirement, let alone long-term care expenses.
We partner with clients who can’t afford premiums or not able to pass long-term care insurance underwriting with liquidation strategies which look to begin 3-5 years before retirement. Liquidation of a primary residence can be a workable option especially if an individual is widowed or living alone. Empty-nesters can aspire to sell and move into one-story smaller digs early into or before retirement to lower overall fixed costs. They include in their plan home improvements such as ramps, easy access baths, kitchen cabinets and the cost of caregiver services which complement a spouse or life partner’s long-term care responsibilities.
Per the Center for Retirement Research from their analysis dated February 11, 2020, most older Americans prefer to age in their homes. However, it’s important to decide whether a current residence is appropriate for the task. In other words, many older Baby Boomers look to remain in large homes with empty rooms and two stories which is absolutely not practical – Especially in the face of property taxes that increase annually, sometimes dramatically!
The Center’s paper discovered that:
Seventy percent of households have very stable homeownership patterns, even over several decades. They either stay in the home they own in their 50s (53 percent) or purchase a new home around retirement and stay for the rest of their life (17 percent).
The 30 percent of households that do move consist of two distinct subgroups. Frequent movers (14 percent) appear to face labor market challenges. Late movers (16 percent) look like a slightly more affluent version of the households that never move, but then face a health shock that forces them out of the home that they owned into a rental unit or a long-term services and supports facility.
Overall, the findings largely support the narrative from prior research that most people want to age in place and move only in response to a shock.
Sixth Step: Consider Long-Term Care Riders for Permanent Life Insurance.
Permanent life insurance unlike term, builds cash value. Policies can be ‘over funded’ above the cost of insurance to allocate to a fixed interest sleeve and other investment choices attached through various calculations, to stock indexes such as the S&P 500. There is no chance of loss in cash-value accumulation therefore balances have the true opportunity to compound.
A living benefits rider allows the insured to accelerate access to death benefits due to certain conditions such as long-term care needs and terminal illness. There are benefits to utilizing permanent life insurance to subsidize long-term care needs. Premiums remain level (unlike long-term care insurance premiums that tend to increase on a regular basis, sometimes dramatically), second, of course unlike long-term care insurance, at least there’s life insurance or dollars at the end of the road for heirs.
In addition, underwriting for morbidity risk (long-term care) can be draconian compared to mortality risk (life insurance). In other words, medical issues that have potential to affect activities of daily living may not have the same effect on life expectancy; consumers who don’t qualify for long-term care insurance may still qualify for life insurance. There are a couple of drawbacks to these life insurance riders: Funds accessed during a lifetime will inevitably reduce the face value or death benefit of a life insurance policy. Second, riders cost money. So, before adding a living benefits rider, through holistic financial planning be certain you require insurance to mitigate long-term care risk. Through proper planning, we discover that four out of every ten clients have assets to liquidate or are able to self-insure.
Retirement care analysis is a deep dive into the overall retirement planning process. Unlike income planning, retirement care planning requires us to face our inevitable physical limitations and the toll it can have on personal finances along with the negative ripple effects on wealth and health of loved ones.
It’s best to expose vulnerability and plan accordingly while there’s precious time to do so.
Market Believes It Has Immunity To Risks 02-15-20
Market Believes It Has Immunity To Risk
MacroView: Debt, Deficits & The Path To MMT
Financial Planning Corner: Why Dave Ramsey Is Wrong About Life Insurance
As noted last week, the spread of the coronavirus has had little impact on the markets so far.
“”The market bounced firmly off the 50-dma and rallied back to new highs on Thursday. While Friday saw a bit of retracement, which isn’t surprising given the torrid move early in the week, the ‘virus correction’ was recovered. Importantly, sharp early-week rally kept ‘sell’ signal from triggering,“
Chart Updated Through Friday
In review, we previously took some profits out of portfolios as we were expecting between a 3-5% correction to allow for a better entry point to add equity exposure. While the “viruscorrection” did encompass a correction of 3%, it was too shallow to reverse the rather extreme extension of the market.
The continued rally this past week has fully reversed the corrective process and returned the markets to 3-standard deviations above the 200-dma. Furthermore, all daily, weekly, and monthly conditions have returned to more extreme overbought levels as well.
On a weekly basis, the market backdrop remains bullish with a weekly buy signal still intact.
However, that buy signal is extremely extended and has started to reverse with the market extremely overbought on a weekly basis.
This is an ideal setup for a bigger correction so some caution is advised.
With the market trading above 2-standard deviations, and testing the third, of the intermediate term moving average, some caution is suggested in adding additional exposure. A correction is likely over the next month which will provide a better opportunity. Remain patient for now.
It is here that investors tend to go astray.
In the short-term, the market dynamics are indeed bullish which suggests that investors remain invested at the current time.
However, on a long-term basis, the picture becomes much more concerning.
As noted above, this chart is not about short-term trading but the long-term management of risks in portfolios. This is a quarterly chart of the market going back to 1920.
Note the market has, only on a few rare occasions, been as overbought as it is currently. The recent advance has pushed the market into 3-standard deviations above the 3-year moving average. In every single case, the reversion was not kind to investors.
Secondly, in the bottom panel, the market has never been this overbought and extended in history.
As an investor it is important to keep some perspective about where we are in the current cycle, there is every bit of evidence that a major mean reverting event will occur. Timing is always the issue which is why use daily and weekly measures to manage risk.
Don’t get lost in the mainstream media. This is a very important chart.
“The markets must figure that the coronavirus outbreak will be contained soon and go into remission, as did SARS, MERS, and Ebola. If that doesn’t happen, then there will be a vaccine that will make us feel better. It won’t be a miracle cure coming from a drug company. Rather, it will be injections of more liquidity into the global financial markets by the major central banks.
On Tuesday, Fed Chair Jerome Powell implied that the Fed is on standby to do just that. In his testimony on monetary policy to Congress, he said, ‘Some of the uncertainties around trade have diminished recently, but risks to the outlook remain. In particular, we are closely monitoring the emergence of the coronavirus, which could lead to disruptions in China that spill over to the rest of the global economy.’”
Interestingly, however, was that during Powell’s testimony to the Senate Banking Committee this past week, he said:
“There is nothing about this economy that is out of kilter or imbalanced.”
Okay, I’ll bite.
“Mr. Powell, if there is nothing out of kilter or imbalanced in the economy, then why are you flooding the system with a greater level of ’emergency’ measures than seen during the ‘financial crisis.'”
Side Note:The irony of that particular clip, is that Mr. Lorensax is asking his class about the “The Smoot-Hawley Act,” which was intended to raise revenue via tariffs and lift the U.S. out of the “Great Depression.” Just as with Trump’s recent “tariff” and “trade war,” neither worked as intended.
There is clearly something amiss within the financial complex. However, investors have been trained to disregard the “risk” under the assumption the Federal Reserve has everything under control.
Currently, it certainly seems to be the case as markets hover near all-time highs even as earnings, and corporate profit, growth has weakened. If the coronavirus impacts the global supply chain harder than is currently anticipated, which is likely, the deviation between prices and earnings will become tougher to justify.
Scott Minerd, the CIO of Guggenheim Investments, had a salient point:
“Yet as a major economic problem looms on the horizon, the cognitive disconnect between current asset prices and reality feels like the market equivalent of “peace for our time.” The average BBB bond yields just 2.9 percent. A recent 10-year BB-rated healthcare bond came to market at 3.5 percent and subsequently was increased in size from $1 billion to $1.7 billion due to excess demand.
For those investors who perceive the disconnect between risk assets which are priced for a rosy outcome and the reality of the looming risks to growth and earnings, any attempt to reduce risk leads to underperformance. It is a mind-numbing exercise for investors who see the cognitive dissonance. The frantic race to accumulate securities has cast price discovery to the side.
I have never in my career seen anything as crazy as what’s going on right now, this will eventually end badly.“
Of course, it will.
The only problem, as he notes, is that between now and then, there is a demand for performance regardless of the underlying risk. Or rather, there is a widely adopted belief the markets can never have a decline again as witnessed by an email I received last week:
“Why do you think there will ever be a correction when the central banks are never going to let credit contract. I see no corrections. Ever. When the US enters a recession, the reality is it will be the biggest buy signal yet. There is literally nowhere to go but up in this market.”
The lessons taught by previous bear markets are always forgotten during enduring bull markets which seem without end. The relearning of those lessons are always painful.
The Path Ahead
The path ahead for stocks is much less certain than in late 2018 when we were coming off deeply depressed sentiment levels, and the Fed was rapidly reversing monetary policy from “tightening” to “easing.”
With equities now more than 30% higher than they were then, the Fed mostly on hold in terms of rate cuts, and “repo” operations starting to slow, it certainly seems that expectations for substantially higher market values may be a bit optimistic.
Furthermore, as noted above, earnings expectations declined for the entirety of 2019, as shown in the chart below. However, the impact of the “coronavirus” has not been adopted into these reduced estimates as of yet.These estimates WILL fall, and likely markedly so, which as stated above, is going to make justifying record asset prices more problematic.
Conversely, if by some miracle, the economy does show actual improvement, it could result in yields rising on the long-end of the curve, which would also make stocks less attractive.
This is the problem of overpaying for value. The current environment is so richly priced there is little opportunity for investors to extract additional gains from risk-based investments.
There is one true axiom of the market which is always forgotten.
“Investors buy the most at the top, and the least at the bottom.”
If you feel you must chase the markets currently, then at least do it with a set of guidelines to follow in case things turn against you. We printed these a couple of weeks ago but felt there are worth mentioning again.
Move slowly. There is no rush in adding equity exposure to your portfolio. Use pullbacks to previous support levels to make adjustments.
If you are heavily UNDER-weight equities, DO NOT try and fully adjust your portfolio to your target allocation in one move. This could be disastrous if the market reverses sharply in the short term. Again, move slowly.
Begin by selling laggards and losers. These positions are dragging on performance as the market rises and tends to lead when markets fall. Like “weeds choking a garden,” pull them.
Add to sectors, or positions, that are performing with, or outperforming the broader market.
Move “stop-loss” levels up to current breakout levels for each position. Managing a portfolio without “stop-loss” levels is like driving with your eyes closed.
While the technical trends are intact, risk considerably outweighs the reward. If you are not comfortable with potentially having to sell at a LOSS what you just bought, then wait for a larger correction to add exposure more safely. There is no harm in waiting for the “fat pitch” as the current market setup is not one.
If none of this makes any sense to you – please consider hiring someone to manage your portfolio for you. It will be worth the additional expense over the long term.
While we remain optimistic about the markets currently, we are also taking precautionary steps of tightening up stops, adding non-correlated assets, raising some cash, and looking to hedge risk opportunistically.
Just because it isn’t raining right now, doesn’t mean it won’t. Nobody has ever gotten hurt by keeping an umbrella handy.
The MacroView
If you need help or have questions, we are always glad to help. Just email me.
See You Next Week
By Lance Roberts, CIO
Financial Planning Corner
REGISTER NOW: RIGHT-LANE RETIREMENT WORKSHOP
When:February 29th, 9-11 am (Social Security, Medicare, Income planning, Investing & More)
This is what our RIAPRO.NETsubscribers are reading right now!
Sector & Market Analysis
Technical Gauges
Sector Rotation Analysis
Portfolio Positioning
Sector & Market Recommendations
Client Portfolio Updates
Live 401k Plan Manager
THE REAL 401k PLAN MANAGER
A Conservative Strategy For Long-Term Investors
The 401k plan allocation plan below follows the K.I.S.S. principle. By keeping the allocation simplified, it allows for better control of the allocation, and closer tracking to the benchmark objective over time. (If you want to make it more complicated, you can, however, statistics show simply adding more funds does not increase performance to any significant degree.)
If you need help after reading the alert; do not hesitate to contact me.
Model performance is based on a two-asset model of stocks and bonds relative to the weighting changes made each week in the newsletter. This is strictly for informational and educational purposes only and should not be relied upon for any reason. Past performance is not a guarantee of future results. Use at your own risk and peril.
401k Plan Manager Live Model
As an RIA PRO subscriber(You get your first 30-days free) you have access to our live 401k p
The code will give you access to the entire site during the 401k-BETA testing process, so not only will you get to help us work out the bugs on the 401k plan manager, you can submit your comments about the rest of the site as well.
We are building models specific to company plans. So, if you would like to see your company plan included specifically, send me the following:
Name of the company
Plan Sponsor
A print out of your plan choices. (Fund Symbol and Fund Name)
If you would like to offer our service to your employees at a deeply discounted corporate rate, please contact me.
RIA PRO: Market Believes It Has Immunity To Risks
Market Believes It Has Immunity To Risk
MacroView: Debt, Deficits & The Path To MMT
Financial Planning Corner: Why Dave Ramsey Is Wrong About Life Insurance
As noted last week, the spread of the coronavirus has had little impact on the markets so far.
“”The market bounced firmly off the 50-dma and rallied back to new highs on Thursday. While Friday saw a bit of retracement, which isn’t surprising given the torrid move early in the week, the ‘virus correction’ was recovered. Importantly, sharp early-week rally kept ‘sell’ signal from triggering,“
Chart Updated Through Friday
In review, we previously took some profits out of portfolios as we were expecting between a 3-5% correction to allow for a better entry point to add equity exposure. While the “viruscorrection” did encompass a correction of 3%, it was too shallow to reverse the rather extreme extension of the market.
The continued rally this past week has fully reversed the corrective process and returned the markets to 3-standard deviations above the 200-dma. Furthermore, all daily, weekly, and monthly conditions have returned to more extreme overbought levels as well.
On a weekly basis, the market backdrop remains bullish with a weekly buy signal still intact.
However, that buy signal is extremely extended and has started to reverse with the market extremely overbought on a weekly basis.
This is an ideal setup for a bigger correction so some caution is advised.
With the market trading above 2-standard deviations, and testing the third, of the intermediate term moving average, some caution is suggested in adding additional exposure. A correction is likely over the next month which will provide a better opportunity. Remain patient for now.
It is here that investors tend to go astray.
In the short-term, the market dynamics are indeed bullish which suggests that investors remain invested at the current time.
However, on a long-term basis, the picture becomes much more concerning.
As noted above, this chart is not about short-term trading but the long-term management of risks in portfolios. This is a quarterly chart of the market going back to 1920.
Note the market has, only on a few rare occasions, been as overbought as it is currently. The recent advance has pushed the market into 3-standard deviations above the 3-year moving average. In every single case, the reversion was not kind to investors.
Secondly, in the bottom panel, the market has never been this overbought and extended in history.
As an investor it is important to keep some perspective about where we are in the current cycle, there is every bit of evidence that a major mean reverting event will occur. Timing is always the issue which is why use daily and weekly measures to manage risk.
Don’t get lost in the mainstream media. This is a very important chart.
“The markets must figure that the coronavirus outbreak will be contained soon and go into remission, as did SARS, MERS, and Ebola. If that doesn’t happen, then there will be a vaccine that will make us feel better. It won’t be a miracle cure coming from a drug company. Rather, it will be injections of more liquidity into the global financial markets by the major central banks.
On Tuesday, Fed Chair Jerome Powell implied that the Fed is on standby to do just that. In his testimony on monetary policy to Congress, he said, ‘Some of the uncertainties around trade have diminished recently, but risks to the outlook remain. In particular, we are closely monitoring the emergence of the coronavirus, which could lead to disruptions in China that spill over to the rest of the global economy.’”
Interestingly, however, was that during Powell’s testimony to the Senate Banking Committee this past week, he said:
“There is nothing about this economy that is out of kilter or imbalanced.”
Okay, I’ll bite.
“Mr. Powell, if there is nothing out of kilter or imbalanced in the economy, then why are you flooding the system with a greater level of ’emergency’ measures than seen during the ‘financial crisis.'”
Side Note:The irony of that particular clip, is that Mr. Lorensax is asking his class about the “The Smoot-Hawley Act,” which was intended to raise revenue via tariffs and lift the U.S. out of the “Great Depression.” Just as with Trump’s recent “tariff” and “trade war,” neither worked as intended.
There is clearly something amiss within the financial complex. However, investors have been trained to disregard the “risk” under the assumption the Federal Reserve has everything under control.
Currently, it certainly seems to be the case as markets hover near all-time highs even as earnings, and corporate profit, growth has weakened. If the coronavirus impacts the global supply chain harder than is currently anticipated, which is likely, the deviation between prices and earnings will become tougher to justify.
Scott Minerd, the CIO of Guggenheim Investments, had a salient point:
“Yet as a major economic problem looms on the horizon, the cognitive disconnect between current asset prices and reality feels like the market equivalent of “peace for our time.” The average BBB bond yields just 2.9 percent. A recent 10-year BB-rated healthcare bond came to market at 3.5 percent and subsequently was increased in size from $1 billion to $1.7 billion due to excess demand.
For those investors who perceive the disconnect between risk assets which are priced for a rosy outcome and the reality of the looming risks to growth and earnings, any attempt to reduce risk leads to underperformance. It is a mind-numbing exercise for investors who see the cognitive dissonance. The frantic race to accumulate securities has cast price discovery to the side.
I have never in my career seen anything as crazy as what’s going on right now, this will eventually end badly.“
Of course, it will.
The only problem, as he notes, is that between now and then, there is a demand for performance regardless of the underlying risk. Or rather, there is a widely adopted belief the markets can never have a decline again as witnessed by an email I received last week:
“Why do you think there will ever be a correction when the central banks are never going to let credit contract. I see no corrections. Ever. When the US enters a recession, the reality is it will be the biggest buy signal yet. There is literally nowhere to go but up in this market.”
The lessons taught by previous bear markets are always forgotten during enduring bull markets which seem without end. The relearning of those lessons are always painful.
The Path Ahead
The path ahead for stocks is much less certain than in late 2018 when we were coming off deeply depressed sentiment levels, and the Fed was rapidly reversing monetary policy from “tightening” to “easing.”
With equities now more than 30% higher than they were then, the Fed mostly on hold in terms of rate cuts, and “repo” operations starting to slow, it certainly seems that expectations for substantially higher market values may be a bit optimistic.
Furthermore, as noted above, earnings expectations declined for the entirety of 2019, as shown in the chart below. However, the impact of the “coronavirus” has not been adopted into these reduced estimates as of yet.These estimates WILL fall, and likely markedly so, which as stated above, is going to make justifying record asset prices more problematic.
Conversely, if by some miracle, the economy does show actual improvement, it could result in yields rising on the long-end of the curve, which would also make stocks less attractive.
This is the problem of overpaying for value. The current environment is so richly priced there is little opportunity for investors to extract additional gains from risk-based investments.
There is one true axiom of the market which is always forgotten.
“Investors buy the most at the top, and the least at the bottom.”
If you feel you must chase the markets currently, then at least do it with a set of guidelines to follow in case things turn against you. We printed these a couple of weeks ago but felt there are worth mentioning again.
Move slowly. There is no rush in adding equity exposure to your portfolio. Use pullbacks to previous support levels to make adjustments.
If you are heavily UNDER-weight equities, DO NOT try and fully adjust your portfolio to your target allocation in one move. This could be disastrous if the market reverses sharply in the short term. Again, move slowly.
Begin by selling laggards and losers. These positions are dragging on performance as the market rises and tends to lead when markets fall. Like “weeds choking a garden,” pull them.
Add to sectors, or positions, that are performing with, or outperforming the broader market.
Move “stop-loss” levels up to current breakout levels for each position. Managing a portfolio without “stop-loss” levels is like driving with your eyes closed.
While the technical trends are intact, risk considerably outweighs the reward. If you are not comfortable with potentially having to sell at a LOSS what you just bought, then wait for a larger correction to add exposure more safely. There is no harm in waiting for the “fat pitch” as the current market setup is not one.
If none of this makes any sense to you – please consider hiring someone to manage your portfolio for you. It will be worth the additional expense over the long term.
While we remain optimistic about the markets currently, we are also taking precautionary steps of tightening up stops, adding non-correlated assets, raising some cash, and looking to hedge risk opportunistically.
Just because it isn’t raining right now, doesn’t mean it won’t. Nobody has ever gotten hurt by keeping an umbrella handy.
The MacroView
If you need help or have questions, we are always glad to help. Just email me.
See You Next Week
By Lance Roberts, CIO
Financial Planning Corner
REGISTER NOW: RIGHT-LANE RETIREMENT WORKSHOP
When:February 29th, 9-11 am (Social Security, Medicare, Income planning, Investing & More)
Be sure and catch our updates on Major Markets (Monday) and Major Sectors (Tuesday) with updated buy/stop/sell levels
Sector-by-Sector
Improving – Discretionary (XLY) and Utilities (XLU)
As noted previously, we reduced exposure to Utilities and Discretionary due to their extreme overbought condition. Unfortunately, that overbought extension has not been alleviated enough at this time to add back to our holdings. We will likely see a correction in the next couple of weeks to re-evaluate our positioning.
We previously recommended taking profits in Technology, which has not only been leading the market but has gotten extremely overbought. The rally in markets last week only further extended those overbought conditions in both Technology and Communications. Hold positions for now, and be patient for a correction to add additional exposure.
We noted previously added a position in Financials to our portfolios, which we will look to build into over the few weeks. We also had previously added to our healthcare slightly. Both positions ran back to overbought and need more of a correction before considering adding to them.
Current Position: 1/2 Weight (XLF), Target weight (XLV)
Lagging – Industrials (XLI), Real Estate (XLRE), Staples (XLP), Materials (XLB), and Energy (XLE)
With the Fed continuing to pump money into the financial markets, bond yields continue to drop which is supportive for interest rate sectors like Real Estate and Utilities. We previously reduced our holdings to these sectors and we need a correction to work off some of the excesses before adding back to our holdings. Both XLRE and XLU are EXTREMELY extended currently.
Industrials rallied back to new highs without working off the overbought condition. With industrials at 3-standard deviations above the long-term mean, be patient adding additional exposures.
Materials tested and failed previous highs and are testing those highs again. With the sector very overbought there is a risk of a reversal, particularly with the sector very close to registering a “sell signal.”
Energy is deeply oversold and due for a rally. We added to our position of AMLP previously, however, we are maintaining tight stops.
Staples remains in a strong uptrend and has not provided an entry point to add exposure safely.
Current Position: Reduced weight XLY, XLP, XLRE, Full weight AMLP, 1/2 weight XLB and XLI
Market By Market
Small-Cap (SLY) and Mid Cap (MDY) – Despite the rally in the broader markets, Small- and Mid-caps continue to underperform currently. Both markets rallied last week but have failed to set new highs. Small caps did recover their 50-dma, while mid-caps are currently testing previous highs. Overbought conditions are rather extreme in both.
Current Position: KGGIX, SLYV
Emerging, International (EEM) & Total International Markets (EFA)
Emerging and International Markets, look a lot like small-caps above. Both had gotten extremely overbought and needed to correct. That correction broke supports and the subsequent rally failed to set new highs. Both markets have climbed back above their respective 50-dma, but are testing that support line. We remain long our holdings currently, but are closely evaluating our positioning.
Current Position:EFV, DEM
Dividends (VYM), Market (IVV), and Equal Weight (RSP) – These positions are our long-term “core” positions for the portfolio given that over the long-term markets do rise with economic growth and inflation. We are currently maintaining our core positions unhedged for now. If we see deterioration in the broader markets, we will begin to add short-positions to hedge our long-term core holdings.
Current Position:RSP, VYM, IVV
Gold (GLD) – Over the last few weeks, gold has been consolidating near recent highs. Gold remains overbought but continues to hold important support. We are at full weight in the positions, however, if this consolidation continues, supports hold, and the overbought condition recedes, we will consider over-weighting our holdings.
Bonds rallied back towards previous highs on Friday as money rotated into bonds for “safety” as the market weakened. After previously recommending adding to bonds, hold current positions for now and take profits next week to rebalance risks accordingly. Bonds are extremely overbought now, so be cautious, we added a small portion of TLT to portfolios last week to extend our current duration.
Current Positions:DBLTX, SHY, IEF, Added TLT
Sector / Market Recommendations
The table below shows thoughts on specific actions related to the current market environment.
(These are not recommendations or solicitations to take any action. This is for informational purposes only related to market extremes and contrarian positioning within portfolios. Use at your own risk and peril.)
Portfolio/Client Update:
The market rallied this past week on continued expectations that the Fed will intervene sooner, or later, with liquidity to offset the risk of the coronavirus. As such, investors don’t want to “miss out” on the liquidity party when it happens, so they are front-running the event.
This past week, we made a couple of very minor changes to the portfolio which change very little in terms of the overall make up.
Importantly, this rebalancing of risk did not dramatically increase equity exposure. This is because, as noted above, the longer-term technical outlook remains “cautious.”
Yes, we realize we are very late-cycle, we also know that with the Fed, and global Central Banks, still intervening, we must give deference to the “bullish bias.”At the moment, that bias clearly remains, and functioned as we discussed last week.
There we no additional portfolio actions this past week.
New clients:Slowing adding exposure as needed.
Dynamic Model: Added LVS, and a Short-S&P 500 hedge to balance risk while trying to build out the overall model.
Equity Model: Sold SLYV to make room to add LVS. Also added TLT to our bond portfolio to lengthen duration a little bit. Given the portfolio is fully allocated to the market positions now have to be shifted to make changes.
ETF Model: Add a starting position of TLT to our bond portfolio to lengthen the duration of our current bond mix.
Note for new clients:
It is important to understand that when we add to our equity allocations, ALL purchases are initially “trades” that can, and will, be closed out quickly if they fail to work as anticipated. This is why we “step” into positions initially. Once a “trade” begins to work as anticipated, it is then brought to the appropriate portfolio weight and becomes a long-term investment. We will unwind these actions either by reducing, selling, or hedging if the market environment changes for the worse.
THE REAL 401k PLAN MANAGER
A Conservative Strategy For Long-Term Investors
The 401k plan allocation plan below follows the K.I.S.S. principle. By keeping the allocation simplified, it allows for better control of the allocation, and closer tracking to the benchmark objective over time. (If you want to make it more complicated, you can, however, statistics show simply adding more funds does not increase performance to any significant degree.)
If you need help after reading the alert; do not hesitate to contact me.
Model performance is based on a two-asset model of stocks and bonds relative to the weighting changes made each week in the newsletter. This is strictly for informational and educational purposes only and should not be relied upon for any reason. Past performance is not a guarantee of future results. Use at your own risk and peril.
401k Plan Manager Live Model
As an RIA PRO subscriber(You get your first 30-days free) you have access to our live 401k p
The code will give you access to the entire site during the 401k-BETA testing process, so not only will you get to help us work out the bugs on the 401k plan manager, you can submit your comments about the rest of the site as well.
We are building models specific to company plans. So, if you would like to see your company plan included specifically, send me the following:
Name of the company
Plan Sponsor
A print out of your plan choices. (Fund Symbol and Fund Name)
If you would like to offer our service to your employees at a deeply discounted corporate rate, please contact me.
#FPC: Dave Ramsey Is Right & Very Wrong About Permanent Life Insurance (Pt. 1)
Let’s start with the basics, Dave Ramsey is great at a couple of things, budgeting, helping people get out of debt, prioritizing material things and/or putting things in perspective.
BUT…
There are some things where good ole Dave isn’t so great. I know this is going to surprise many of you, but you need to hear this.
DAVE RAMSEY IS NOT GOOD AT FINANCIAL PLANNING OR INVESTMENT ADVICE.
Allow me to give you some additional context. Dave is good at helping people get out of debt and make better financial decisions, in fact he’s really good. His Financial Peace University has helped so many people get on track to a better life. I’m a really big fan of Dave for the work he does, but my clients and most of our readers have graduated beyond Dave’s philosophy’s to needing more sophisticated planning and advice.
Dave Ramsey believes you should buy term life insurance and invest the rest. In theory it sounds great. For example, if you were to spend $1,000 a month on a permanent life insurance policy- according to Dave you should buy a term policy and invest the rest.
And from a RISK MANAGEMENT mindset I love the idea.
In fact, this is where you should start. Buy a term policy to protect your family. There are many factors to consider when purchasing a term policy and how much you need here are a few:
Loss of Income
Debt
Expenses
Children
Lifestyle
Age
Do you have insurance through work? Is it portable if you leave?
The rule of thumb is 7 to 10 times your annual salary-BUT we believe each individual should go through a thorough analysis to help determine what’s right for their family.
Now that you have your bases covered to protecting your family what’s next?
I’m making an assumption that you already have an emergency fund, established a “financial vulnerability cushion” and are wondering where to put additional funds.
Here’s what I hear often-
I make too much to put into a Roth IRA
I make too much to put into a Roth 401(k)- (no you don’t there are no income limitations)
I can’t make tax deductible contributions to a Traditional IRA
Where do I put funds?
Savings aren’t earning much interest,
I’m missing out on returns in the markets (High Yield Savings) No FOMO.
Or alternatively, Markets are too high to put funds to work
The list goes on and on.
What has the Financial Industry beat into our brains year after year?
Times are changing. With the new Secure Act we just saw the death of the Stretch IRA and are in one of the lowest tax brackets we’ve seen in years. Not to mention the TCJA (current tax code) sunsets in 2026 and there is also a political party dead set on raising taxes if elected. In regard to debt and taxes neither Democrat or Republican party understands a budget or how to truly curtail deficit spending. U.S. Government let me introduce you to Dave. It’s a match made in Heaven-until it causes a massive recession, but that’s beside the point. I’d expect higher taxes, not austerity.
So how will you prepare for higher taxes?
When helping clients prepare for retirement we look for not only the low hanging fruit or the obvious feel good propositions, but also some of the harder ones. Like paying taxes now.
Right now we’re the bearers of bad news.
You don’t always retire in a lower tax bracket.
AND, most aren’t prepared for the additional stealth taxes Uncle Sam surprises you with.
Stay with me, I know I’m walking you through a dark tunnel. The light is near.
Envision yourself on a 3-legged stool. Each leg represents a different tax ramification.
Leg 1-Fully Taxable
Leg 2-Partially Taxable
Leg 3-Tax Free
If you could put all of your eggs in one leg where would they be?
Exactly, Leg 3-but why are so many stools so wobbly? I’ll go one step further.
Leg 1- 401(k)’s, 403(b)’s, Traditional IRA’s (the feel good’s)
Leg 2- Saving’s, Brokerage Accounts, After tax investment Vehicles
Leg 3- ROTH 401(k)’s, ROTH IRA’s, CASH VALUE FROM PERMANENT LIFE INSURANCE
We focus on so many other things first. The typical sequence of savings is:
401(k)
Savings
Investments
What do these all have in common? Taxes
What do we want to get away from? Taxes
Here’s how I want you to look at Leg 1- it’s not all yours. Treat these funds like a business, but you don’t own all of it Uncle Sam has some ownership in your business. However, this partnership is unlike any other-they can increase their ownership at any time therefore decreasing your probability of success in retirement.
Leg 2- the principal is yours (you’ve already paid the taxes,) but any realized growth, interest and dividends are taxable at either ordinary income levels or capital gains tax rates.
Leg 3- like leg 2 you’ve already paid the taxes, but the earning’s when all the rules are followed are tax free. For obvious reasons this is the more difficult leg to stabilize. It’s not easy, it takes some proper planning and it takes some work.
I believe everyone needs to strengthen leg 3. Most people will do it by utilizing a Roth 401k or a Roth IRA, but a few will use a permanent life insurance policy.
This is where Dave is right- for most people.
Buying term and investing the difference if you are diligent enough to do so is a great strategy for the majority of Americans living paycheck to paycheck or the saver who is doing all they can to make the sacrifices for their family, but they just can’t do much more.
This is where Dave is wrong?
What about our typical client? These are the people who are doing all the right things, maxing out retirement contributions, maxing out their HSA’s, putting funds into their savings accounts regularly with little to no debt. Do they just keep plugging away putting additional funds into accounts that are taxable?
What about our clients who have a true estate tax problem? These are people who’ve built businesses, acquired land, built wealth with hard work, blood, sweat and tears. Do their heirs liquidate assets just to pay the tax bill?
No, no they don’t they use insurance properly.
Is permanent life insurance wrong for them, Dave?
No, they use insurance as one leg of their 3-legged stool. These are people who take a big picture holistic view, have a financial plan and have planned for these events.
Insurance is something that must be planned, not sold.
I know and hear of too many insurance agents who say everyone needs a Variable Universal Life Policy aka (VUL.) Unfortunately, many of these guys primarily sell property and casualty and are looking for a big-ticket item, the VUL. Which typically carry higher fee’s little or no guarantee’s and premiums that can change. The majority of the time a realistic plan wasn’t done, illustrations are done to show only the best case scenarios and many times the agents themselves are captive to one or two carriers and/or don’t quite know what to look for in an insurance policy or how to choose one that really fits your needs. This is the have hammer, everything is a nail syndrome.
Permanent Life Insurance when done right can play a vital role in a retiree’s financial plan, it can help provide tax free income, some provide guarantee’s to principal and offer low fee’s which help with accumulation of cash value when overfunding the contract.
Which is why we believe insurance should be planned, it’s a solution to a sophisticated problem. Insurance is also a sophisticated product, that deserves a better reputation than many give it.
Who doesn’t want some guarantee’s?
Who doesn’t want to pay 0% in taxes on distributions?
Who doesn’t want protection from the governments stealth taxes?
Who doesn’t want creditor protection?
Who doesn’t want to protect their family and their hard-earned funds?
I hope this post has opened your eyes to another potential avenue to explore in your plan.
Next week in Part 2, we’ll get into the nitty-gritty of different types of permanent life insurance, how to use them, what to look for in a policy and also what to stay away from.
Falling Oil Prices An Economic Warning Sign
On Tuesday morning, I got engaged in a debate on the recent decline in oil prices following my report on COT Positioning in the space. To wit:
“The inherent problem with this is that if crude oil breaks below $48/bbl, those long contracts will start to get liquidated which will likely push oil back into the low 40’s very quickly. The decline in oil is both deflationary and increases the risk of an economic recession.”
It didn’t take long before the debate started.
“Aren’t low oil prices good for the economy? They are a tax cut for the consumer?”
There is an old axiom which states that if you repeat a falsehood long enough, it will eventually be accepted as fact.
Low oil prices equating to stronger economic growth is one of those falsehoods.
Oil prices are indeed crucial to the overall economic equation, and there is a correlation between the oil prices, inflation, and interest rates.
Given that oil is consumed in virtually every aspect of our lives, from the food we eat to the products and services we buy, the demand side of the equation is a tell-tale sign of economic strength or weakness. We can see this clearly in the chart below which combines rates, inflation, and GDP into one composite indicator. One important note is that oil tends to trade along pretty defined trends (black trend lines) until it doesn’t. Importantly, since the oil industry is very manufacturing and production intensive, breaks of price trends tend to be liquidation events which has a negative impact on manufacturing and CapEx spending and feeds into the GDP calculation.
“It should not be surprising that sharp declines in oil prices have been coincident with downturns in economic activity, a drop in inflation, and a subsequent decline in interest rates.“
We can also view the impact of oil prices on inflation by looking at breakeven inflation rates as well.
The short version is that oil prices are a reflection of supply and demand. Global demand has already been falling for the last several months, and oil prices are sending warnings that “market hopes” for a “global reflation” are likely not a reality. More importantly, falling oil prices are going to put the Fed in a very tough position in the next couple of months as deflationary pressures rise. The chart below shows breakeven 5-year and 10-year inflation rates versus oil prices.
Zero Sum
The argument that lower oil prices give consumers more money to spend certainly seems entirely logical. Since we know that roughly 80% of households in America effectively live paycheck-to-paycheck, they will spend, rather than save, any extra disposable income.
However, here is the most important part of the fallacy:
“Spending in the economy is a ZERO-SUM game.”
Falling oil prices are an excellent example since gasoline sales are part of the retail sales calculation.
Let’s take a look at the following example:
Oil Prices Decline By $10 Per Barrel
Gasoline Prices Fall By $1.00 Per Gallon
Consumer Fills Up A 16 Gallon Tank Saving $16 (+16)
Gas Station Revenue Falls By $16 For The Transaction (-16)
End Economic Result = $0
Now, the argument is that the $16 saved by the consumer will be spent elsewhere, which is true. However, this is the equivalent of “rearranging deck chairs on the Titanic.”
So, let’s now extend our example from above.
Oil and gasoline prices have dropped, so Elaine, whohas budgeted $100 to spend each week on retail-related purchases, goes to the gas station to fill up.
Elaine fills up her car for $60, which previously cost $80. (Savings +$20)
Elaine then spends her normal $20 on lunch with her friends.
She then spends her additional $20 (saved from her gas bill) on some flowers for the dining room.
————————————————- Total Spending For The Week = $100
Now, economists quickly jump on the idea that because she spent $20 on flowers, there has been an additional boost to the economy.
However, this is not the case. Elaine may have spent her money differently this past week, but she still spent the same amount. Here is the net effect on the economy.
Gasoline Station Revenue = (-$20) Flower Store Revenue = +$20 —————————————————- Net Effect To Economy = $0
Graphically, we can show this by analyzing real (inflation-adjusted) gasoline prices compared to total Personal Consumption Expenditures (PCE). I am using “PCE” as it is the broadest measure of consumer spending and comprises almost 70% of the entire GDP calculation.
As shown, falling gasoline prices have historically equated to lower personal consumption expenditures, and not vice-versa. In fact higher oil and gasoline prices have actually been coincident with higher rates of PCE previously. The chart below show inflation-adjusted oil prices as compared to PCE.
While the argument that declines in energy and gasoline prices should lead to stronger consumption sounds logical, the data suggests this is not the case.
What we find is there is a parity between oil price and the economy. Like “Goldilocks,” prices which are too hot, or too cold, has a negative impact on consumption and economic growth.
Importantly, regardless of the level of oil prices, the only thing which increases consumer spending are increases in INCOME, not SAVINGS. Consumers only have a finite amount of money to spend. They can choose to “save more” which is a drag on economic growth in the short-term (called the “paradox of thrift”),or they can spend what they have. But they can’t spend more, unless they take on more debt.
Which is what has been occurring as individuals struggle to fill the gap between the cost of living and incomes. (Read more on this chart)
A Bigger Drag Than The Savings
Importantly, falling oil prices are a bigger drag on economic growth than the incremental “savings” received by the consumer.
The obvious ramification of the plunge in oil prices is to the energy sector itself. As oil prices decline, the loss of revenue eventually leads to cuts in production, declines in capital expenditure plans (which comprises almost 1/4th of all CapEx expenditures in the S&P 500), freezes and/or reductions in employment, not to mention the declines in revenue and profitability.
Let’s walk through the impact of lower oil prices on the economy.
Declining oil prices lead to declining revenue for oil and gas companies. Given that drilling for oil is a very capital intensive process requiring a lot of manufactured goods, equipment, supplies, transportation, and support, the decrease in prices leads to a reduction in activity as represented by Capital Expenditures (CapEx.) The chart below shows the 6-month average of the 6-month rate of change in oil prices as compared to CapEx spending in the economy.
Of course, once CapEx is reduced the need for employment declines. However, since drilling for oil is a very intensive process, losses in employment may start with the energy companies, but eventually, all of the downstream suppliers are impacted by slower activity. As job losses rise, and incomes decline, it filters into the economy.
Importantly, when it comes to employment, the majority of the jobs “created” since the financial crisis has been lower wage-paying jobs in retail, healthcare and other service sectors of the economy. Conversely, the jobs created within the energy space are some of the highest wage paying opportunities available in engineering, technology, accounting, legal, etc.
In fact, each job created in energy-related areas has had a “ripple effect” ofcreating 2.8 jobs elsewhere in the economy from piping to coatings, trucking and transportation, restaurants and retail.
Given that oil prices are a reflection of global economic demand, falling oil prices have a negative feedback loop in the economy as a whole. The longer oil prices remain suppressed, the negative impacts of loss of employment, reductions in capital expenditures, and declines in corporate profitability will begin to outstrip any small economic benefit gained through consumption.
Simply put, lower oil and gasoline prices may actually have a bigger detraction on the economy than the “savings” provided to consumers.
Newton’s third law of motion states:
“For every action, there is an equal and opposite reaction.”
In any economy, nothing works in isolation. For every dollar increase that occurs in one part of the economy, there is a dollars’ worth of reduction somewhere else.
Market Vaccine For Virus Is More Fed’s “NotQE” 02-08-20
Market Vaccine For Virus Is More Fed
Trust The Process
MacroView: The Next Minsky Moment Is Inevitable
Financial Planning Corner: 5-Things You Need To Know About HSA’s
Last week, I asked the question of whether the “correction was over?” To wit:
“On a very short-term basis, there is a potential for a reflexive bounce. If your ‘investment duration,’ or rather your ‘investment holding period’ is very short, there may be a ‘trading’ opportunity for you.”
Well, that bounce came hard and fast during the first half of the week, as the S&P 500 rebounded off the 50-dma to set new highs on Thursday.
The Good News
As noted, the market bounced firmly off the 50-dma and rallied back to new highs on Thursday. While Friday saw a bit of retracement, which isn’t surprising given the torrid move early in the week, the “viruscorrection” was recovered. Importantly, the “buy signal,” in the lower panel, was close to registering a “sell signal.” The sharp early-week rally kept that signal from triggering, which would have confirmed the “sell signal” in the top panel. Historically, when both “sell signals” are triggered, deeper corrections have tended to follow.
The Not-So-Good News
Previously, we discussed that we had taken profits out of portfolios as we were expecting between a 3-5% correction to allow for a better entry point to add equity exposure. While the “viruscorrection” did encompass a correction of 3%, it was too shallow to reverse the rather extreme extension of the market. The rally this past week has reversed the corrective process, and returned the markets to 3-standard deviations above the 200-dma. Furthermore, all daily, weekly, and monthly conditions have returned to more extreme overbought levels as well.
Of course, the reason for the rally was more liquidity from the Federal Reserve.
While the economic impact from the virus is likely to be substantial, as discussed previously, traders looked past economic realities. They focused instead on more liquidity being pumped into the markets by both the Fed, and the PBOC (Peoples Bank of China).
“The PBOC decided that instead of unwinding the large liquidity provision, they would double-down on it… and that they did in size. The last four weeks have seen China supply over CNY2 trillion (net!) into its financial system – something we have never seen anything like before…” – Zerohedge
But, as I stated, it wasn’t just the PBOC, but also the Federal Reserve dumping tremendous amounts of liquidity into the markets which only had one place to go….equities.
While the Fed continues to deny current liquidity interventions are indeed “QE,” they have been clearly concerned about the potential of global instability impacting the U.S. In their most recent report to Congress, the “coronavirus” made its appearance as the latest threat to the global economic instability.
Do NOT dismiss that last sentence lightly.
Since last October, the Fed has been injecting the financial system with massive quantities of liquidity to fix “short-term funding needs.” Each time they have tried to slow the rates of funding, the market has declined, so they extended the facility. Initially, the facility was for October tax payments. Then it was extended for the “year-end” turn. Then it was extended for April “tax payments.”The “coronavirus” will be the next reason to extend the program into June.
The question you should be asking is: “exactly what is going on?”
Dollar Rally
Currently, the flood of liquidity has been pulling foreign capital back into U.S. Dollars. While the U.S. dollar had previously started to breakdown heading into year-end, which gave a boost to commodities and oil. Unfortunately, that breakdown has been reversed.
We did this analysis for our RIAPRO Subscribers (Risk-Free Trial For 30-Days) this past week, which warned them of the potential for a continued dollar rally. The importance of this rally is that a stronger U.S. Dollar is not friendly to commodities, international, and emerging market exposure.
While there has been a good bit of excitement over the last couple of weeks of improving economic data points, it will likely be short-lived. Given these data points are both “sentiment surveys” and “lagging” in nature, what they captured was the uptick in commodities seen at the end of 2019 as the dollar weakened on “trade deal” hopes.
What has yet to be captured is the subsequent reversion in the major, economically sensitive, components. While the markets have rallied on news of more liquidity, the impact from the “coronavirus” has only yet started to be felt economically. Even if the virus was cured today, the economic impact will continue to be felt over the rest of this year.
Importantly, the impact on China will be substantially greater, which will undermine any potential positive to the U.S. from the “trade deal.” That impact will result not only in the form of weaker economic growth in China, but globally as well due to the interlinked supply chains. This is going to manifest itself in weaker earnings and corporate profits, which will continue to make elevated asset prices harder to justify.
As shown in the long-term chart below, despite the short-term correction, which is barely noticeable, the market remains extremely extended, overbought, and pushing into the top of its long-term trading range.
Furthermore, the put/call ratio, which warned of the previous correction is once again pushing extreme levels rarely seen from a historical perspective.
The rally this past week serves as a stern reminder that market participants are trained to respond to “Pavlov’s Bell.”
For the time being, investors have gotten away with overpaying for value, ignoring risk, and chasing yield. Eventually, the party ends, and it always ends in the most brutal of fashions.
This is why it’s important to have a process and adhere to it.
“Because that is what our process required us to do.”
To understand the process, we have to go back.
A few weeks ago, Shawn Langlois at MarketWatch picked up our article discussing why we were selling positions in our portfolio. To wit:
“Specifically, Roberts raised cash by selling off shares of Apple, Microsoft, United Healthcare, Johnson & Johnson, and Micron, and scaling back overweight holdings in various ETF sector plays, such as the Technology Select Sector SPDR, and the Health Care Select Sector.“
While at the time, it seemed like a wrong move, a couple of weeks later, the market sold off. The benefit was the extra cash, and reduced exposure, help limit the downside draw to about 1/3rd of the market decline.
Then, last week, things changed:
“With bond yields plummeting this past week, our bond exposures have gotten extremely stretched. The sell-off in the market, combined with the ‘risk off’ rotation to bonds, sets the market up for a reflexive bounce. The duration and magnitude of that bounce will be critical as to our next steps in positioning.”
Chart updated through Friday
As noted, the market had gotten oversold on a short-term basis, which brought the risk/reward measures back into better alignment. This is where our process required we add equity exposure back into portfolios.
In the ETF Model, we added Financials (XLF) and increased our stake in HealthCare (XLV) with both of those sectors having gotten oversold and bouncing off their respective 50-dma’s.
In the EQUITY Model, we added JP Morgan (JPM) and Pfizer (PFE) while increasing our stakes in Abbvie (ABBV), United Healthcare (UNH), and Alerian MLP (AMLP).
Importantly, this rebalancing of risk did not dramatically increase our equity exposure. This is because, as noted above, the longer-term technical outlook remains “cautious.”
Yes, we realize we are very late-cycle, we also know that with the Fed, and global Central Banks, still intervening, we must give deference to the “bullish bias.” At the moment, the bullish bias remains, and functioned as we predicted last week.
“The ‘bullish bias’ is not dead as of yet, and investors will be quick to try and ‘write off’ the impact of the ‘virus.’ After a decade of ‘macro-events’ not stopping the bullish charge, the belief the market is ‘bulletproof’ has become so deeply ingrained into investor mentality it won’t be dislodged until it is far too late to matter.”
We have no certainty about when, or what will trigger the next bear market.
What we do know is that such an event will likely be far more brutal than most realize due to years of excess risk-taking, leverage, and demographics.
However, this is what our process is designed to handle:
The portfolio is managed for risk by adjusting the level of equity exposure relative to market dynamics, return outlooks, and technical deviations from long-term means.
The allocation is managed for riskby balancing positions for relative performance to our benchmark.
The positions are managed for risk by:
Employing trailing stop-losses
Regularly rebalancing positions back to target weights (taking profits)
Cutting laggards which aren’t performing as expected
Monitoring relative performance and participation
Importantly, notice that everything the process covers is the management against the “risk” of loss.
If we manage against the risk of capital loss, we can safely participate with markets as they rise. When something eventually does goes wrong, the process will systematically close out positions, protecting our investment capital, until that process is complete. Then the process reverses to rebuild exposure when risk/reward dynamics are greatly improved.
As long as the process is followed, risk can be controlled. Where the majority of investors go wrong, is by not having a process.
“Hoping” markets will continue higher indefinitely, is not a process.
As we concluded last week:
“We won’t know for sure until after the fact. This is why we manage risk in the short-term. Managing risk allows us to navigate the ‘twists and turns’ of the market without careening off the cliff.”
The MacroView
If you need help or have questions, we are always glad to help. Just email me.
This is what ourRIAPRO.NETsubscribers are reading right now!
Sector & Market Analysis
Technical Gauges
Sector Rotation Analysis
Portfolio Positioning
Sector & Market Recommendations
Client Portfolio Updates
Live 401k Plan Manager
THE REAL 401k PLAN MANAGER
A Conservative Strategy For Long-Term Investors
The 401k plan allocation plan below follows the K.I.S.S. principle. By keeping the allocation simplified, it allows for better control of the allocation, and closer tracking to the benchmark objective over time. (If you want to make it more complicated, you can, however, statistics show simply adding more funds does not increase performance to any significant degree.)
If you need help after reading the alert; do not hesitate to contact me.
Model performance is based on a two-asset model of stocks and bonds relative to the weighting changes made each week in the newsletter. This is strictly for informational and educational purposes only and should not be relied upon for any reason. Past performance is not a guarantee of future results. Use at your own risk and peril.
401k Plan Manager Live Model
As an RIA PRO subscriber(You get your first 30-days free) you have access to our live 401k p
The code will give you access to the entire site during the 401k-BETA testing process, so not only will you get to help us work out the bugs on the 401k plan manager, you can submit your comments about the rest of the site as well.
We are building models specific to company plans. So, if you would like to see your company plan included specifically, send me the following:
Name of the company
Plan Sponsor
A print out of your plan choices. (Fund Symbol and Fund Name)
If you would like to offer our service to your employees at a deeply discounted corporate rate, please contact me.
RIA PRO: Market Vaccine For Virus Is More Fed’s “NotQE”
Market Vaccine For Virus Is More Fed
Trust The Process
MacroView: The Next Minsky Moment Is Inevitable
Financial Planning Corner: 5-Things You Need To Know About HSA’s
“On a very short-term basis, there is a potential for a reflexive bounce. If your ‘investment duration,’ or rather your ‘investment holding period’ is very short, there may be a ‘trading’ opportunity for you.”
Well, that bounce came hard and fast during the first half of the week, as the S&P 500 rebounded off the 50-dma to set new highs on Thursday.
The Good News
As noted, the market bounced firmly off the 50-dma and rallied back to new highs on Thursday. While Friday saw a bit of retracement, which isn’t surprising given the torrid move early in the week, the “viruscorrection” was recovered. Importantly, the “buy signal,” in the lower panel, was close to registering a “sell signal.” The sharp early-week rally kept that signal from triggering, which would have confirmed the “sell signal” in the top panel. Historically, when both “sell signals” are triggered, deeper corrections have tended to follow.
The Not-So-Good News
Previously, we discussed that we had taken profits out of portfolios as we were expecting between a 3-5% correction to allow for a better entry point to add equity exposure. While the “viruscorrection” did encompass a correction of 3%, it was too shallow to reverse the rather extreme extension of the market. The rally this past week has reversed the corrective process, and returned the markets to 3-standard deviations above the 200-dma. Furthermore, all daily, weekly, and monthly conditions have returned to more extreme overbought levels as well.
Of course, the reason for the rally was more liquidity from the Federal Reserve.
While the economic impact from the virus is likely to be substantial, as discussed previously, traders looked past economic realities. They focused instead on more liquidity being pumped into the markets by both the Fed, and the PBOC (Peoples Bank of China).
“The PBOC decided that instead of unwinding the large liquidity provision, they would double-down on it… and that they did in size. The last four weeks have seen China supply over CNY2 trillion (net!) into its financial system – something we have never seen anything like before…” – Zerohedge
But, as I stated, it wasn’t just the PBOC, but also the Federal Reserve dumping tremendous amounts of liquidity into the markets which only had one place to go….equities.
While the Fed continues to deny current liquidity interventions are indeed “QE,” they have been clearly concerned about the potential of global instability impacting the U.S. In their most recent report to Congress, the “coronavirus” made its appearance as the latest threat to the global economic instability.
Do NOT dismiss that last sentence lightly.
Since last October, the Fed has been injecting the financial system with massive quantities of liquidity to fix “short-term funding needs.” Each time they have tried to slow the rates of funding, the market has declined, so they extended the facility. Initially, the facility was for October tax payments. Then it was extended for the “year-end” turn. Then it was extended for April “tax payments.”The “coronavirus” will be the next reason to extend the program into June.
The question you should be asking is: “exactly what is going on?”
Dollar Rally
Currently, the flood of liquidity has been pulling foreign capital back into U.S. Dollars. While the U.S. dollar had previously started to breakdown heading into year-end, which gave a boost to commodities and oil. Unfortunately, that breakdown has been reversed.
We did this analysis for our RIAPRO Subscribers (Risk-Free Trial For 30-Days) this past week, which warned them of the potential for a continued dollar rally. The importance of this rally is that a stronger U.S. Dollar is not friendly to commodities, international, and emerging market exposure.
While there has been a good bit of excitement over the last couple of weeks of improving economic data points, it will likely be short-lived. Given these data points are both “sentiment surveys” and “lagging” in nature, what they captured was the uptick in commodities seen at the end of 2019 as the dollar weakened on “trade deal” hopes.
What has yet to be captured is the subsequent reversion in the major, economically sensitive, components. While the markets have rallied on news of more liquidity, the impact from the “coronavirus” has only yet started to be felt economically. Even if the virus was cured today, the economic impact will continue to be felt over the rest of this year.
Importantly, the impact on China will be substantially greater, which will undermine any potential positive to the U.S. from the “trade deal.” That impact will result not only in the form of weaker economic growth in China, but globally as well due to the interlinked supply chains. This is going to manifest itself in weaker earnings and corporate profits, which will continue to make elevated asset prices harder to justify.
As shown in the long-term chart below, despite the short-term correction, which is barely noticeable, the market remains extremely extended, overbought, and pushing into the top of its long-term trading range.
Furthermore, the put/call ratio, which warned of the previous correction is once again pushing extreme levels rarely seen from a historical perspective.
The rally this past week serves as a stern reminder that market participants are trained to respond to “Pavlov’s Bell.”
For the time being, investors have gotten away with overpaying for value, ignoring risk, and chasing yield. Eventually, the party ends, and it always ends in the most brutal of fashions.
This is why it’s important to have a process and adhere to it.
“Because that is what our process required us to do.”
To understand the process, we have to go back.
A few weeks ago, Shawn Langlois at MarketWatch picked up our article discussing why we were selling positions in our portfolio. To wit:
“Specifically, Roberts raised cash by selling off shares of Apple, Microsoft, United Healthcare, Johnson & Johnson, and Micron, and scaling back overweight holdings in various ETF sector plays, such as the Technology Select Sector SPDR, and the Health Care Select Sector.“
While at the time, it seemed like a wrong move, a couple of weeks later, the market sold off. The benefit was the extra cash, and reduced exposure, help limit the downside draw to about 1/3rd of the market decline.
Then, last week, things changed:
“With bond yields plummeting this past week, our bond exposures have gotten extremely stretched. The sell-off in the market, combined with the ‘risk off’ rotation to bonds, sets the market up for a reflexive bounce. The duration and magnitude of that bounce will be critical as to our next steps in positioning.”
Chart updated through Friday
As noted, the market had gotten oversold on a short-term basis, which brought the risk/reward measures back into better alignment. This is where our process required we add equity exposure back into portfolios.
In the ETF Model, we added Financials (XLF) and increased our stake in HealthCare (XLV) with both of those sectors having gotten oversold and bouncing off their respective 50-dma’s.
In the EQUITY Model, we added JP Morgan (JPM) and Pfizer (PFE) while increasing our stakes in Abbvie (ABBV), United Healthcare (UNH), and Alerian MLP (AMLP).
Importantly, this rebalancing of risk did not dramatically increase our equity exposure. This is because, as noted above, the longer-term technical outlook remains “cautious.”
Yes, we realize we are very late-cycle, we also know that with the Fed, and global Central Banks, still intervening, we must give deference to the “bullish bias.” At the moment, the bullish bias remains, and functioned as we predicted last week.
“The ‘bullish bias’ is not dead as of yet, and investors will be quick to try and ‘write off’ the impact of the ‘virus.’ After a decade of ‘macro-events’ not stopping the bullish charge, the belief the market is ‘bulletproof’ has become so deeply ingrained into investor mentality it won’t be dislodged until it is far too late to matter.”
We have no certainty about when, or what will trigger the next bear market.
What we do know is that such an event will likely be far more brutal than most realize due to years of excess risk-taking, leverage, and demographics.
However, this is what our process is designed to handle:
The portfolio is managed for risk by adjusting the level of equity exposure relative to market dynamics, return outlooks, and technical deviations from long-term means.
The allocation is managed for riskby balancing positions for relative performance to our benchmark.
The positions are managed for risk by:
Employing trailing stop-losses
Regularly rebalancing positions back to target weights (taking profits)
Cutting laggards which aren’t performing as expected
Monitoring relative performance and participation
Importantly, notice that everything the process covers is the management against the “risk” of loss.
If we manage against the risk of capital loss, we can safely participate with markets as they rise. When something eventually does goes wrong, the process will systematically close out positions, protecting our investment capital, until that process is complete. Then the process reverses to rebuild exposure when risk/reward dynamics are greatly improved.
As long as the process is followed, risk can be controlled. Where the majority of investors go wrong, is by not having a process.
“Hoping” markets will continue higher indefinitely, is not a process.
As we concluded last week:
“We won’t know for sure until after the fact. This is why we manage risk in the short-term. Managing risk allows us to navigate the ‘twists and turns’ of the market without careening off the cliff.”
The MacroView
If you need help or have questions, we are always glad to help. Just email me.
Be sure and catch our updates on Major Markets (Monday) and Major Sectors (Tuesday) with updated buy/stop/sell levels
Sector-by-Sector
Improving – Discretionary (XLY) and Utilities (XLU)
As noted previously, we reduced exposure to Utilities and Discretionary due to their extreme overbought condition. The brief correction was cut short, and the rally was so quick, it failed to reduce any of the previous overbought, extended, or deviated conditions. We will likely see a correction in the next couple of weeks to re-evaluate our positioning.
We previously recommended taking profits in Technology and Healthcare, which have not only been leading the market but have gotten extremely overbought. Last week, Healthcare pulled back enough to allow us to reweight the position in portfolios. The rally in markets last week, reversed those conditions so we will remain pat on adding new positions for now.
Current Positions: Target weight XLK, XLV, Underweight XLC
Weakening – Financials (XLF)
We noted previously that Financials have been running hard on Fed rate cuts and more QE and that the sector was extremely overbought and due for a correction. That correction allowed us to add a position to our portfolios, which we will look to build into over the next couple of weeks.
Current Position: 1/2 Weight (XLF)
Lagging – Industrials (XLI), Real Estate (XLRE), Staples (XLP), Materials (XLB), and Energy (XLE)
With the Fed and the PBOC liquifying markets last week, everything rallied sharply. However, the technical damage in the lagging sectors still exists, so we are monitoring closely.
Industrials tested and failed at previous highs and remains on a sell-signal suggesting a retest of the 50-dma is likely.
Materials tested and failed previous highs and IS testing the 50-dma. It must hold next week, but the sector remains on a sell-signal.
Energy is deeply oversold and due for a rally. We added to our position of AMLP last week.
Staples remains in a strong uptrend and has not provided an entry point to add exposure safely.
Real Estate is testing previous highs and is back to overbought. There isn’t a clear opportunity to add to our holdings just yet. Be patient.
Current Position: Reduced weight XLY, XLP, XLRE, Full weight AMLP, 1/2 weight XLB and XLI
Market By Market
Small-Cap (SLY) and Mid Cap (MDY) – Despite the rally in the broader markets, Small- and Mid-caps continue to underperform currently. Both markets rallied last week and then failed without setting new highs. Unfortunately, small caps broke below the 50-dma, while mid-caps are currently testing that important support. We are close to being stopped out on our positions currently.
Current Position: KGGIX, SLYV
Emerging, International (EEM) & Total International Markets (EFA)
Emerging and International Markets, look just like small and mid-caps above. Both had gotten extremely overbought and needed to correct. That correction broke supports and the subsequent rally failed to set new highs. Emerging markets have now broken the 50-dma again, and International is testing that critical support. If we don’t see improvement next week, we are likely to be stopped out of our holdings.
Current Position:EFV, DEM
Dividends (VYM), Market (IVV), and Equal Weight (RSP) – These positions are our long-term “core” positions for the portfolio given that over the long-term markets do rise with economic growth and inflation. We are currently maintaining our core positions unhedged for now. If we see deterioration in the broader markets, we will begin to add short-positions to hedge our long-term core holdings.
Current Position:RSP, VYM, IVV
Gold (GLD) – Over the last few weeks, gold has been consolidating near recent highs. Gold remains overbought, but continues to hold important support. We are at full weight in the positions, however, if this consolidation continues, supports hold, and the overbought condition recedes, we will consider over-weighting our holdings.
Current Position:GDX (Gold Miners), IAU (Gold)
Bonds (TLT) –
Bonds rallied back towards previous highs on Friday as money rotated into bonds for “safety” as the market weakened. After previously recommending adding to bonds, hold current positions for now and take profits next week to rebalance risks accordingly. Bonds are extremely overbought now.
Current Positions:DBLTX, SHY, IEF
Sector / Market Recommendations
The table below shows thoughts on specific actions related to the current market environment.
(These are not recommendations or solicitations to take any action. This is for informational purposes only related to market extremes and contrarian positioning within portfolios. Use at your own risk and peril.)
Portfolio/Client Update:
Last week, the markets got oversold on a short-term basis to allow us to add some positions to portfolios.
Please Read TRUST THE PROCESS in the main body of this week’s missive.
As noted, the market had gotten oversold on a short-term basis, which brought the risk/reward measures back into better alignment. This is where our process required we add equity exposure back into portfolios.
In the ETF Model we added Financials (XLF) and increased our stake in HealthCare (XLV) with both of those sectors having gotten oversold and bouncing off their respective 50-dma’s.
In the EQUITY Model we added JP Morgan (JPM) and Pfizer (PFE) while increasing our stakes in Abbvie (ABBV), United Healthcare (UNH), and Alerian MLP (AMLP).
Importantly, this rebalancing of risk did not dramatically increase our equity exposure. This is because, as noted above, the longer-term technical outlook remains “cautious.”
Yes, we realize we are very late-cycle, we also know that with the Fed, and global Central Banks, still intervening, we must give deference to the “bullish bias.”At the moment, that bias clearly remains, and functioned as we predicted last week.
There we no additional portfolio actions this past week.
New clients:Slowing adding exposure as needed.
Dynamic Model: Bought positions in JPM, PRE, AMLP, UNH, ABBV. Reduced market hedge by 1/2.
Equity Model: Bought positions in JPM & PFE, added to existing holdings of AMLP, UNH, ABBV.
ETF Model: Added 1/2 position XLF, add to existing position XLV.
Note for new clients:
It is important to understand that when we add to our equity allocations, ALL purchases are initially “trades” that can, and will, be closed out quickly if they fail to work as anticipated. This is why we “step” into positions initially. Once a “trade” begins to work as anticipated, it is then brought to the appropriate portfolio weight and becomes a long-term investment. We will unwind these actions either by reducing, selling, or hedging if the market environment changes for the worse.
THE REAL 401k PLAN MANAGER
A Conservative Strategy For Long-Term Investors
The 401k plan allocation plan below follows the K.I.S.S. principle. By keeping the allocation simplified, it allows for better control of the allocation, and closer tracking to the benchmark objective over time. (If you want to make it more complicated, you can, however, statistics show simply adding more funds does not increase performance to any significant degree.)
If you need help after reading the alert; do not hesitate to contact me.
Model performance is based on a two-asset model of stocks and bonds relative to the weighting changes made each week in the newsletter. This is strictly for informational and educational purposes only and should not be relied upon for any reason. Past performance is not a guarantee of future results. Use at your own risk and peril.
401k Plan Manager Live Model
As an RIA PRO subscriber(You get your first 30-days free) you have access to our live 401k p
The code will give you access to the entire site during the 401k-BETA testing process, so not only will you get to help us work out the bugs on the 401k plan manager, you can submit your comments about the rest of the site as well.
We are building models specific to company plans. So, if you would like to see your company plan included specifically, send me the following:
Name of the company
Plan Sponsor
A print out of your plan choices. (Fund Symbol and Fund Name)
If you would like to offer our service to your employees at a deeply discounted corporate rate, please contact me.
#FPC: 5-Things You Aren’t Being Told About HSA’s.
With the passage of the SECURE ACT and the death of the STRETCH IRA there has been a lot of noise about Health Savings Accounts or HSA’s for short. The role, or lack of, that people use a Health Savings Account as investment vehicles in their financial plans has been highly debatable, but not anymore. In 2020, we are finally seeing a shift in financial advice to find ways to put funds aside and avoid taxes altogether down the road.
Health Savings Accounts are becoming common place now that employers are shifting more of the burden of Health Insurance to the employees with the use of high deductible health plans. If you don’t have access to one now, those days may be numbered.
With all of the attention HSA’s have been given; there has been an enormous amount of “advice” on how you should use these accounts. Let’s take a look at what your advisor probably isn’t telling you:
Your broker confuses an HSA and FSA.
Not everyone is eligible for a Health Savings Account, to have access to an HSA you must be in a High-Deductible Health Plan. This means your out of pocket deductibles must be at minimum $1,400 and your max out of pocket can be no greater than $6,900 for a single insured and for a family the minimum deductible can be no less than $2,800 and maximum out of pocket expenses can be no greater than $13,800 for a family in 2020.
If your health insurance plan meets those parameters you can contribute to a Health Savings Account.
The annual 2020 contribution limit, (employer+employee) is $3,550 for a single insured and $7,100 for a family. If you’re over 55 you’re allowed an additional $1,000 catch up contribution annually.
Most employers who have high deductible health plans are beginning to start HSA’s for their employees. However, if you’re not satisfied with your company’s plan or they don’t offer one you can certainly shop around for your own HSA. Keep in mind if your company offers a plan and makes contributions to your account it would be wise to use your employer’s plan. A study from the Employee Benefit Research Group found that in 2015 employers who contributed averaged an annual contribution of $948. Other more recent studies show the employer contributions typically varies by the size of the company, but varying between $750 and $1250.
When doing your own shopping, remember to check costs, ease of use and investment options available.
Flexible Spending Accounts are much different from HAS’s. They are offered through an employer-established benefit plan. Unlike the HSA if you are self-employed, you aren’t eligible for an FSA. A Flexible Spending Account will allow participants to put up to $2,750 annually in their account. FSA’s also provide you the ability to access funds throughout the year for qualified medical expenses even if you haven’t contributed them to the account yet.
Some Key differences:
HSA’s will allow you to retain all of your funds in the account each year-even if you don’t use them.
An FSA may allow for a rollover of unused funds of up to $500, but only if your company agrees to it and anything remaining over the $500 will go back to the company’s coffers.
The HSA’s ability to make tax free contributions, allow the funds to grow tax free year after year and then make tax free withdrawals when used for medical expenses make this a great tool to utilize as part of diversifying the type of accounts in your financial plan.
The HSA also allows employees to retain their funds long after their employment.
Contributions to an HSA should stop permanently 6 months prior to starting Medicare. Medicare enrollment can be delayed past 65 if you’re still covered under an employer plan, but one should be familiar with the system and potential penalties if not enrolled properly and on time.
Once on Medicare you can use your HSA to pay premiums, meet deductibles and cover other qualified medical expenses.
Your broker doesn’t care about the trend in health care costs
As discussed in our RIA Financial Guardrails, the cost of health care is growing twice as fast as the typical Cost of Living Adjustment in Social Security benefits.
Healthview Services put’s out an annual report on the trends and costs of health care. In their 2018 Retirement Healthcare Costs Data Report they found that health care expenses are projected to rise at an annual rate of 4.22%. The report also found that the average healthy 65 year old couple who is retiring this year should expect to spend $363,946 in today’s dollars in health care premiums, deductibles and out-of-pocket expenses.
These are scary numbers if you ask me. Is your advisor using standard income replacement ratios of the past or are they updating their numbers annually or is this even a consideration in your overall financial plan?
In your financial plan what is your health care expense and at what % is it inflated each year?
Time and time again financial plans use unrealistic return numbers, little or no inflation and health care considerations have been either missed or an altogether after-thought.
If you don’t know-ask your advisor what type of assumption’s they are using. This should be an easy conversation to have and if it’s a conversation you don’t feel comfortable having with your advisor it may be time to start kicking tires.
Your advisor’s job is to be your advocate and more importantly in financial planning to play devil’s advocate.
Fund your HSA over your 401(k)
Now this one tends to scare the bejesus out of people, but hear me out. According to a 2018 Economic News Release by the Bureau of Labor Statistics the median number of years an employee stays at one job is 4.2 years. Now that number is even smaller (2.8 years) if you’re between the ages of 25-34. The trend that people are spending less time at one employer is probably why we have seen an increase in vesting schedules for employer matching contributions or an all-out stop in employer matches.
The U.S. Bureau of Labor Statistics 2019 National Compensation study shows that of the only 64% of employers who offer a 401k plan and on average 74% take advantage of those plans. Out of the 64% who do offer a plan around half of them don’t even offer a match. As labor markets continue to tighten hopefully we’ll see employers begin to sweeten the pot on 401(k) plans as they try to retain and entice talented workers.
Now if you’re lucky enough to get that illusive bonus of a match you must think about your company’s vesting schedule.
Companies matching contributions are vested a couple of different ways: Immediately, a cliff vesting schedule or graded vesting schedule.
An immediate schedule works just like it sounds once your funds are matched in your 401k the employer contribution is 100% vested. I think of that as a unicorn in this day and age, those good companies are few and far between.
A cliff schedule means that once you have worked at an employer for a specified period of time (think years) you will be 100% vested in their contributions. When using a cliff schedule by Federal law the company must transfer their match to you by the end of year 3.
A graded schedule will vest employer contributions gradually. In many cases we see the magic number of 20% per year, but employers can’t take that any longer the six years before you are fully vested.
Why is this important? With so many people on the move looking for employment opportunities you must be mindful of your expected time with a company to make the most of any match. As people spend less time at one employer one must consider the length of how long you may continue your employment in regard to your vesting schedule. This will certainly play a factor in determining if funding an HSA prior to your 401k makes sense for you.
When funding an HSA you get to utilize a TRIPLE TAX ADVANTAGE:
Employee contributions are tax deductible,
Interest is allowed to grow tax free; and,
You can pull the funds out for qualified medical expenses at no tax!
This is extremely powerful and is one reason why there is so much buzz around these accounts.
NO TAX GOING IN, NO TAX ON YOUR EARNINGS AND IF YOU USE IT PROPERLY YOU WON’T BE TAXED ON THE WAY OUT!
In a traditional 401k plan your contributions are put in pretax, funds grow tax deferred and THEN your distributions are taxed when you begin to use them.
As health care expenses become a larger part of our spending in retirement it only makes sense to use an HSA to your family’s advantage.
Medicare and Cobra Payments
Unlike most other accounts utilized for retirement or health care you can use your HSA funds for not only your day to day qualified medical expenses, but also your Medicare and Cobra premiums without incurring taxes or a penalty. The ability to use the funds to pay premiums is a great benefit that is often overlooked.
As referenced earlier in our RIA Financial Guardrails. Per Medicare Trustees as reported by Savvy Medicare, a training program for financial planners, Part B and Part D insurance costs have averaged an annual increase of 5.6% and 7.7% respectively, over the last 5 years and are expected to grow by 6.9% and 10.6% over the next five years.
As inflationary pressure has been weighing on Medicare premiums and expectations for increasing costs to continue now may be a great time to start saving in your HSA.
How to invest your HSA properly
This is one of those things that when I open my computer and see article after article on how to invest aggressively in your Health Savings Accounts it makes me want to bang my head against a wall.
Let’s get this straight, an HSA has the ability to be a powerful investment vehicle with the triple tax-free benefits when used the right way. However, just like with any good financial plan you need to start by having a cushion of emergency funds. This cushion will look different for everyone, but we would recommend having at minimum 2 years of deductibles and premiums saved in a very low risk allocation before you started dipping your toes in the markets with these funds. Life has a way of slapping you upside the head from time to time, just as markets do. When life takes you for a ride we want you to be ready to access your hard earned funds should you need to use them in a medical emergency without regard for asset prices.
Do you pay top dollar for your houses, real estate or a business venture? Or are you looking for a deal? No one wants to buy anything only to have to turn around and sell it later for a loss.
Valuations are high- Not just a little bit high, but near all time. If we look at Shiller’s CAPE-10 Valuation Measures & Forward Returns we can see that current valuation levels are above what we have seen at every previous bull market.
I’m not saying we’re headed into our next recession; the momentum of this market could continue to carry on for some time. Like any other investment thoughtful allocations need to be made in late stage market cycles-especially in an account such as an HSA where you may need the funds sooner rather than later.
There is no one size fits all in the use of a Health Savings Account, but if you use these tips as a template and factor your HSA into your financial plan you’ll be well on your way to success in retirement.
SOTM 2020: State Of The Markets
“I am thrilled to report to you tonight that our economy is the best it has ever been.” – President Trump, SOTU
In the President’s “State of the Union Address” on Tuesday, he used the podium to talk up the achievements in the economy and the markets.
Low unemployment rates
Tax cuts
Job creation
Economic growth, and, of course,
Record high stock markets.
While it certainly is a laundry list of items he can claim credit for, it is the claim of record-high stock prices that undermines the rest of the story.
Let me explain.
The stock market should be a reflection of actual economic growth. Since corporate earnings are derived primarily from consumptive spending, corporate investments, and imports and exports, actual economic activity should be reflected in the price investors are willing to pay for the earnings being generated.
For the majority of the 20th century, this was indeed the case as corporate earnings were reflective of economic activity. The chart below shows the annual change in reported earnings, nominal GDP, and the price of the S&P 500.
Not surprisingly, as the economy grew at 6.47% annually, earnings also grew at 6.68% annually as would be expected. Since investors are willing to a premium for earnings growth, the S&P 500 grew at 9% annually over that same period.
Importantly, note that long-term economic growth has averaged 6% annually. However, as shown in the lower panel, economic growth has been running below the long-term average since 2000, but has been substantially weaker since 2007, growing at just 2% annually.
The next chart shows this weaker growth more clearly. Since the financial crisis, economic growth has failed to recover back to its long-term exponential growth trend. However, reported earnings are exceedingly deviated from what actual underlying economic growth can generate. This is due to a decade of accounting gimmickry, share buybacks, wage suppression, low interest rates, and high corporate debt levels.
The next chart looks at the deviation by looking at the market itself versus long-term economic growth. The S&P 500 and GDP have been scaled to 100, and displayed on a log-scale for comparative purposes.
The current growth trend of the economy is running well below its long-term exponential trend, but the S&P 500 is currently at the most significant deviation from that growth on record. (It should be noted that while these deviations from economic growth can last for a long-time, the eventual mean reversion always occurs.)
The Spending Mirage
Take a look at the following chart.
While the President’s claims of an exceptionally strong economy rely heavily on historically low unemployment and jobless claims numbers, historically high levels of asset prices, and strong consumer spending trends, there is an underlying deterioration which goes unaddressed.
So, here’s your pop quiz?
If consumer spending is strong, AND unemployment is near the lowest levels on record, AND interest rates are low, AND job creation is high – then why is the economy only growing at 2%?
Furthermore, if the economy was doing as well as government statistics suggest, then why does the Federal Reserve need to continue providing the economy with “emergency measures,” cutting rates, and giving “verbal guidance,” to keep the markets from crashing?
The reality is that if it wasn’t for the Government running a massive trillion-dollar fiscal deficit, economic growth would actually be recessionary.
In GDP accounting, consumption is the largest component. Of course, since it is impossible to “consume oneself to prosperity,” the ability to consume more is the result of growing debt. Furthermore, economic growth is also impacted by Government spending, as government transfer payments, including Medicaid, Medicare, disability payments, and SNAP (previously called food stamps), all contribute to the calculation.
As shown below, between the Federal Reserve’s monetary infusions and the ballooning government deficit, the S&P 500 has continued to find support.
However, nothing is “produced” by those transfer payments. They are not even funded. As a result, national debt rises every year, and that debt adds to GDP.
Another way to look at this is through tax receipts as a percentage of GDP. If the economy was indeed “the strongest ever,” then we should see an increase in wage growth commensurate with increased economic activity. As a result of higher wages, there should be an increase in the taxes collected by the Government from wages, consumption, imports, and exports.
See the problem here?
Clearly, this is not the case as tax receipts as a percentage of GDP peaked in 2012, and have now declined to levels which historically are more coincident with economic recessions, rather than expansions. Yet, currently, because of the artificial interventions, the stock market remains well detached from what economic data is actually saying.
Corporate Profits Tell The Real Story
When it comes to the state of the market, corporate profits are the best indicator of economic strength.
The detachment of the stock market from underlying profitability guarantees poor future outcomes for investors. But, as has always been the case, the markets can certainly seem to “remain irrational longer than logic would predict,” but it never lasts indefinitely.
“Profit margins are probably the most mean-reverting series in finance, and if profit margins do not mean-revert, then something has gone badly wrong with capitalism. If high profits do not attract competition, there is something wrong with the system, and it is not functioning properly.” – Jeremy Grantham
As shown, when we look at inflation-adjusted profit margins as a percentage of inflation-adjusted GDP, we see a clear process of mean-reverting activity over time. Of course, those mean reverting events are always coupled with recessions, crises, or bear markets.
More importantly, corporate profit margins have physical constraints. Out of each dollar of revenue created, there are costs such as infrastructure, R&D, wages, etc. Currently, the biggest contributors to expanding profit margins has been the suppression of employment, wage growth, and artificially suppressed interest rates, which have significantly lowered borrowing costs. Should either of the issues change in the future, the impact to profit margins will likely be significant.
The chart below shows the ratio overlaid against the S&P 500 index.
I have highlighted peaks in the profits-to-GDP ratio with the green vertical bars. As you can see, peaks, and subsequent reversions, in the ratio have been a leading indicator of more severe corrections in the stock market over time. This should not be surprising as asset prices should eventually reflect the underlying reality of corporate profitability.
It is often suggested that, as mentioned above, low interest rates, accounting rule changes, and debt-funded buybackshave changed the game. While that statement is true, it is worth noting that each of those supports are artificial and finite.
Another way to look at the issue of profits as it relates to the market is shown below. When we measure the cumulative change in the S&P 500 index as compared to the level of profits, we find again that when investors pay more than $1 for a $1 worth of profits, there is an eventual mean reversion.
The correlation is clearer when looking at the market versus the ratio of corporate profits to GDP. (Again, since corporate profits are ultimately a function of economic growth, the correlation is not unexpected.)
It seems to be a simple formula for investors that as long as the Fed remains active in supporting asset prices, the deviation between fundamentals and fantasy doesn’t matter.
However, investors are paying more today than at any point in history for each $1 of profit, which history suggests will not end well.
While the media is quick to attribute the current economic strength, or weakness, to the person who occupies the White House, the reality is quite different.
The political risk for President Trump is taking too much credit for an economic cycle which was already well into recovery before he took office. Rather than touting the economic numbers and taking credit for liquidity-driven financial markets, he should be using that strength to begin the process of returning the country to a path of fiscal discipline rather than a “drunken binge” of government spending.
With the economy, and the financial markets, sporting the longest-duration in history, simple logic should suggest time is running out.
This isn’t doom and gloom, it is just a fact.
Politicians, over the last decade, failed to use $33 trillion in liquidity injections, near-zero interest rates, and surging asset prices to refinance the welfare system, balance the budget, and build surpluses for the next downturn.
Instead, they only made the deficits worse, and the U.S. economy will enter the next recession pushing a $2 Trillion deficit, $24 Trillion in debt, and a $6 Trillion pension gap, which will devastate many in their retirement years.
While Donald Trump talked about “Yellen’s big fat ugly bubble” before he took office, he has now pegged the success of his entire Presidency on the stock market.
It will likely be something he eventually regrets.
“Then said Jesus unto him, Put up again thy sword into his place: for all they that take the sword shall perish with the sword.” – Matthew 26, 26:52
Market Correction Goes Viral, Is It Time To Buy? 02-01-20
Market Correction Goes Viral
Portfolio Position Review
MacroView: Fed’s View Of Valuations May Be Misguided
Financial Planning Corner: What You May Have In Common With Kobe Bryant
Over the last few weeks, the message from the newsletter has been repetitive:
“The markets are overbought, overextended, overly complacent. A correction is coming so reduce and rebalance portfolio risks.”
Despite those issues, the markets continued to push higher leaving readers with the assumption the “warnings” were wrong.
As noted last week, there have only been a few points over the previous 25-years where investors were so extremely lopsided in their positioning. We have shown many charts of investors being “all in” to equities over the last three weeks, but here is the latest Fund Manager’s Survey, which shows cash balances at 6-year lows.
The importance of these measures is not meant to be a “timing” signal to buy or sell positions. These measures are more valuable when thought about as an “accelerator” in a car. When markets are rising, investors press down on the accelerator, taking on more equity risk. As long as the road is straight, and visibility is good, it seems there are no consequences for driving at high speeds. However, if the road suddenly turns, or a hazard presents itself, bad outcomes happen very quickly.
The same is true for the markets. As markets are rising, investors ignore the warning signs, and the flashing yellow lights, under the assumption, there is no risk ahead. This is why we discussed taking profits a couple of weeks ago, which was simply how we “eased our foot off the gas” as signs were warning of a “sharp curve ahead.”
I apologize for the analogy, but the message is important. The reason that investors do so poorly over time is the inability to manage risk. Risk is never a function of how much money you make when markets are rising; it is a measure of “your ability to survive the crash.”
This past week, the road took a sharp right as the “Coronavirus” begin to impact overly optimistic views of a global reflation. While media headlines have run rampant with commentary suggesting investors shouldn’t worry about the virus, we wrote on Thursday, this time is different than 2003.To wit:
“Following a nearly 50% decline in asset prices, a mean-reversion in valuations, and an economic recession ending, the impact of the SARS virus was negligible given the bulk of the ‘risk’ was already removed from asset prices and economic growth. Today’s economic environment could not be more opposed.”
With global growth already slow, and the U.S. dragging its feet along at roughly 2% annual growth, there isn’t much room to absorb the impact of an event that potentially curtails consumption. Here was the important point in our recent article:
“China itself is a much more crucial player in the global economy than it was at the time of SARS, or severe acute respiratory syndrome, in 2003. It occupies a central place in many supply chains used by other manufacturing countries—including pharmaceuticals, with China home to 13 percent of facilities that make ingredients for U.S. drugs—and is a voracious buyer of raw materials and other commodities, including oil, natural gas, and soybeans. That means that any economic hiccups for China this year—coming on the heels of its worst economic performance in 30 years—will have a bigger impact on the rest of the world than during past crises.
That is particularly true given the epicenter of the outbreak: Wuhan, which is now under effective quarantine, is a riverine and rail transportation hub that is a key node in shipping bulky commodities between China’s coast and its interior.”
Importantly, as percentage of global GDP, China is 4x the size it was in 2003.
Don’t dismiss the risk of a viral contagion on an already weak global economy, at a time when asset prices are grossly deviated from actual profits, and GAAP earnings.
Is The Correction Over?
Since taking profits out of our portfolios, this leads us to the obvious question of whether or not the “Coronavirus Correction” is over?
From an investment standpoint, this is a fairly tricky question which brings up what we term in our practice as an “equity risk duration match.”
On a very short-term basis, there is a potential for a reflexive bounce. If your “investment duration,” or rather your “investment holding period” is very short, there may be a “trading” opportunity for you. However, if your “duration” is a longer time-frame, like ours, then the short-term oversold bounce is likely an opportunity to “reduce risk” further into.
As they say, “a picture is worth a thousand words.”
The market finally reversed some of the extreme 3-standard deviation extension (shaded areas) above the 200-dma, which we have discussed over the last couple of weeks. Such extensions, like stretching a rubber band too far, ALWAYS snap back eventually. We just never know what the catalyst will be that sparks the reversion.
With a “sell signal” clearly triggered (lower panel), it suggests, on a short-term basis, we are likely to see a “tradeable bounce.” However, until the signal reverses, any short-term bounce should probably be “sold into.”
Make no mistake, there is currently downside risk below the 50-dma to both the 38.2% and 50% Fibonacci retracement levels. From recent peaks, such a correction would entail a 5-8% decline, which is well within the normal range of a market correction within an ongoing bullish trend.
Weekly – Intermediate-Term
On a weekly basis the picture changes a bit. The bullish “buy” signal is still intact but is threatening a reversal which one more “down week” will likely accomplish. Furthermore, the market is NOT oversold as of yet, suggesting there is indeed downside risk currently, notwithstanding a short-term bounce. The best buying opportunities are when the weekly signal is oversold.
With the weekly “buy” signals still intact, such suggests the “correction” remains contained at the moment. However, these signals are valid only at the end of the week, so if there is further deterioration next week, there is a risk of a deeper correction developing. Previous corrections from such extended levels have ranged from 10%, to nearly 20%.
Monthly – Intermediate To Long-Term
On a long-term view, the market remains contained at the top of its bullish trend from the 2009 lows. Previous corrections have consistently tested both the mid- and lower bounds of the range. Don’t dismiss the statement above lightly. A test of the lower band of the range would wipe out 100% of the gains from 2019.
The market remains at risk of triggering a monthly sell signal (lower panel,) which has previously resulted in more severe bear markets and corrections going back 25-years.
Monthly data is very slow to move and is only valid at months end. This data is not useful for trading markets but is useful for risk mitigation and understanding when a “bear market” has genuinely begun.
Quarterly – Long-Term
As with the monthly data above, quarterly data is also not useful for trading portfolios. However, it provides a much deeper understanding of portfolio risk in the years ahead.
Currently, the market is extremely overbought (top panel,) and extremely extended (lower panel,) which has not previously been beneficial to investor returns over the following few years.
Importantly, what this data suggests is that betting on a “buy and hold” strategy over the coming decade is likely to leave you fairly disappointed. Risk is elevated and given the extreme long-term deviations on a variety of levels, an eventual “reversion to the mean” will be a more brutal event than what we have seen previously.
Portfolio Positioning
As noted above, after previously reducing exposure “slightly” to equities, we are now starting to actively scan for opportunities for a “risk rotation” in the market.
For quite some time, we have been portfolio weight to overweight in defensive areas of the market like Utilities, Real Estate and Staples as well as Treasury bonds. Those areas are now extremely extended. We will look to take profits out of these sectors and rebalance weights in Technology, Financials, Healthcare, and Communications, which we reduced previously.
This rebalancing of risk will not dramatically increase our equity exposure; as noted above, the longer-term technical outlook remains cautious. We are very late-cycle in the current market, but with the Fed still intervening, we must give deference to the “bullish bias,” which remains at the moment. In other words, it is not time to be “bearish” yet, but “cautious” is likely a better attitude to have.
With bond yields plummeting this past week, our bond exposures have gotten extremely stretched. The sell-off in the market, combined with the “risk off” rotation to bonds, sets the market up for a reflexive bounce. The duration and magnitude of that bounce will be critical as to our next steps in positioning.
A reflexive bounce that fails at the bottom of the trendline from the October lows (red dashed line) will be fairly negative, and suggest lower lows are coming. With February typically a “weak month” anyway, there is a high likelihood of this event occurring, especially if the virus is not contained soon.
If the bounce holds the 50-dma, and reclaims the bullish trendline, then a run back towards the previous highs is likely. This is will likely coincide with a containment of the virus, or help from the Fed in terms of “guidance” combined with an extension of “Repo” funding past April.
Our reduced positioning has helped shelter our portfolios this month, as portfolio drag was about 1/3rd of the overall market. We can now use our stored cash to take advantage of some trading opportunities that have presented themselves.
The “bullish bias” is not dead as of yet, and investors will be quick to try and “write off” the impact of the “virus.” After a decade of “macro-events” not stopping the bullish charge, the belief the market is “bulletproof” has become so deeply ingrained into investor mentality it won’t be dislodged until it is far too late to matter.
Is this “the” event that triggers the next “bear market” and “recession?”
Maybe. Maybe not.
We won’t know for sure until after the fact. But this is why we manage risk in the short-term, so that we can navigate the “twists and turns” of the market without careening off the cliff.
The Macro View
If you need help or have questions, we are always glad to help. Just email me.
See You Next Week
By Lance Roberts, CIO
Financial Planning Corner
REGISTER NOW for our most popular workshop:THE RIGHT LANE RETIREMENT CLASS
The Westin, Austin at the Domain- 11301 Domain Drive, Austin, TX 78758
This is what ourRIAPRO.NETsubscribers are reading right now!
Sector & Market Analysis
Technical Gauges
Sector Rotation Analysis
Portfolio Positioning
Sector & Market Recommendations
Client Portfolio Updates
Live 401k Plan Manager
THE REAL 401k PLAN MANAGER
A Conservative Strategy For Long-Term Investors
The 401k plan allocation plan below follows the K.I.S.S. principle. By keeping the allocation simplified, it allows for better control of the allocation, and closer tracking to the benchmark objective over time. (If you want to make it more complicated, you can, however, statistics show simply adding more funds does not increase performance to any significant degree.)
If you need help after reading the alert; do not hesitate to contact me.
Model performance is based on a two-asset model of stocks and bonds relative to the weighting changes made each week in the newsletter. This is strictly for informational and educational purposes only and should not be relied upon for any reason. Past performance is not a guarantee of future results. Use at your own risk and peril.
401k Plan Manager Live Model
As an RIA PRO subscriber(You get your first 30-days free) you have access to our live 401k p
The code will give you access to the entire site during the 401k-BETA testing process, so not only will you get to help us work out the bugs on the 401k plan manager, you can submit your comments about the rest of the site as well.
We are building models specific to company plans. So, if you would like to see your company plan included specifically, send me the following:
Name of the company
Plan Sponsor
A print out of your plan choices. (Fund Symbol and Fund Name)
If you would like to offer our service to your employees at a deeply discounted corporate rate, please contact me.
We respect your privacy and will only send you email that is related to what you subscribed to and why you subscribed. You can unsubscribe whenever you want with just a click of your mouse. For more information please see... Disclosure & Privacy Policy.


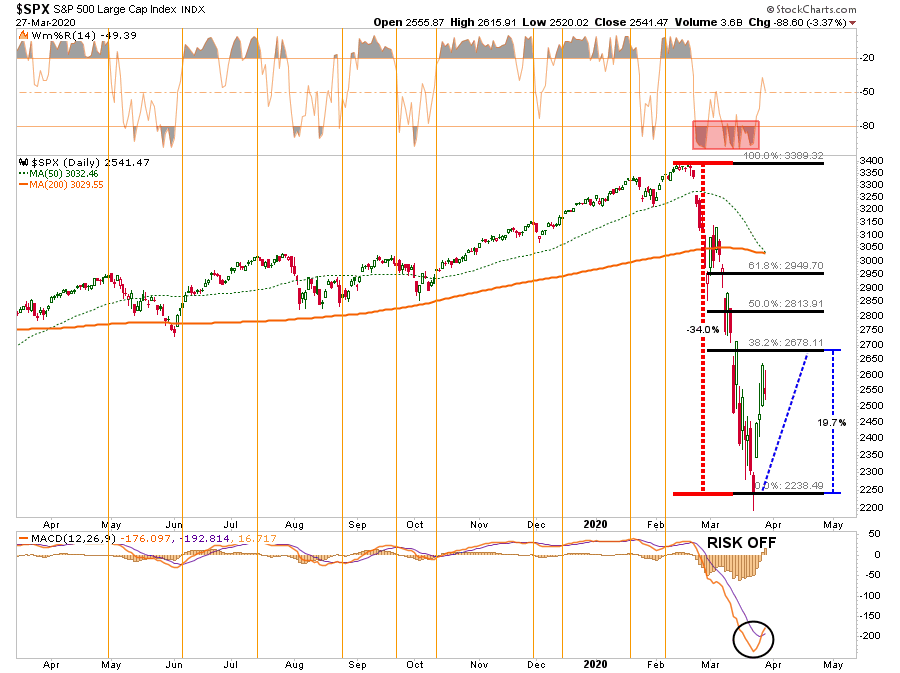
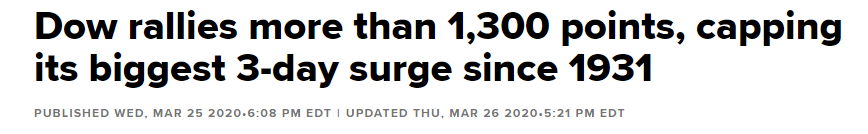
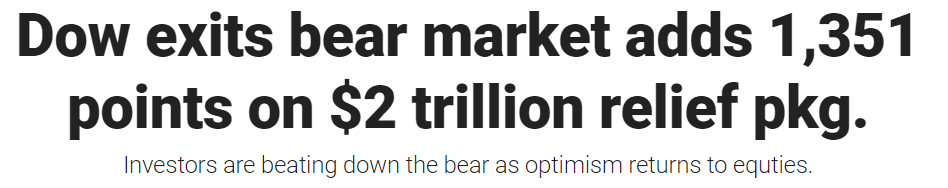

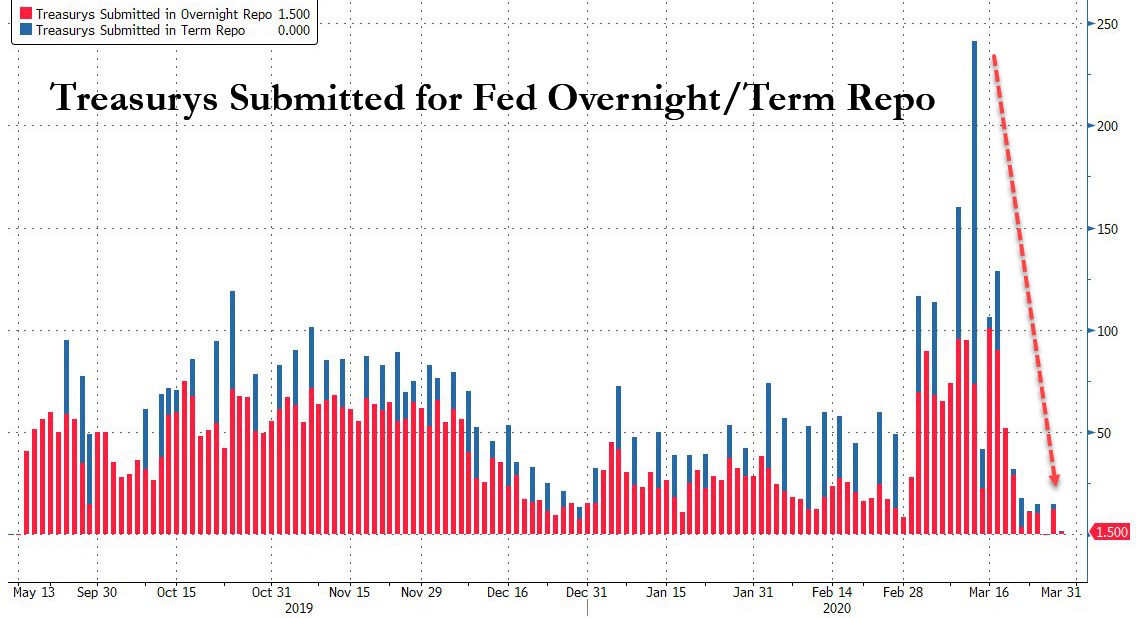
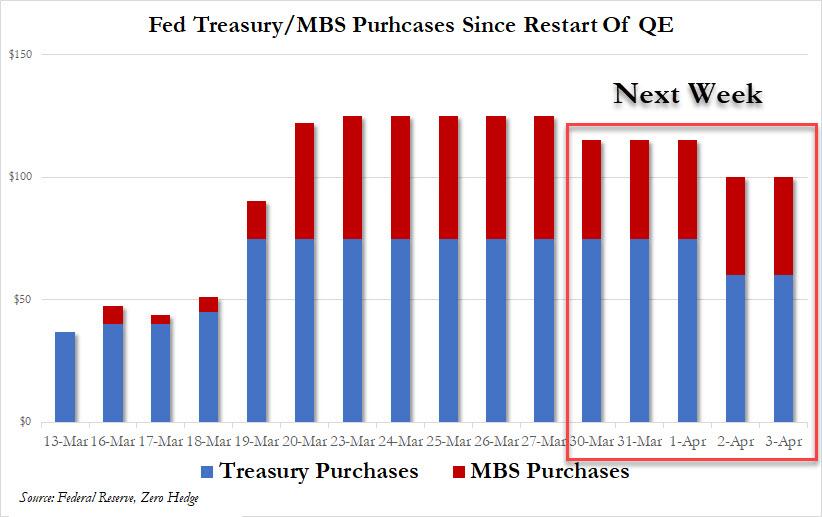

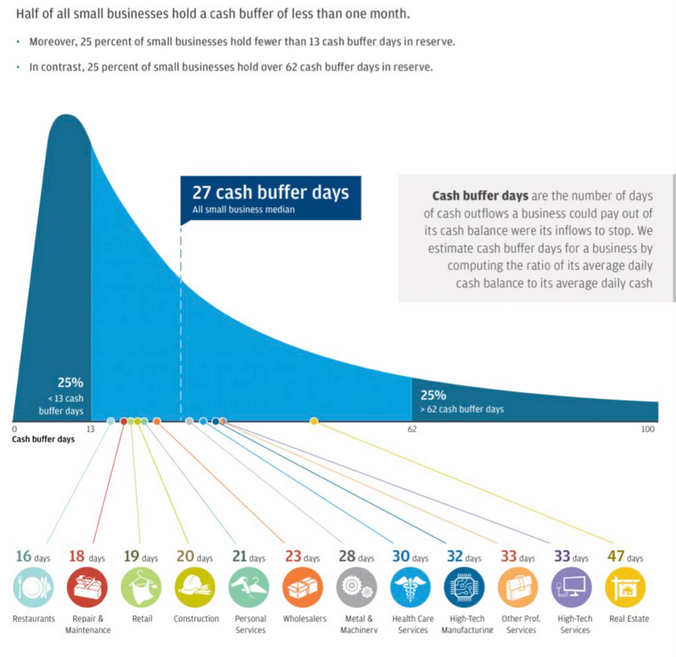
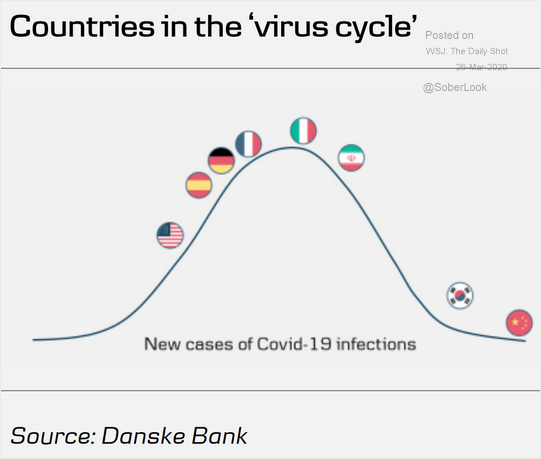


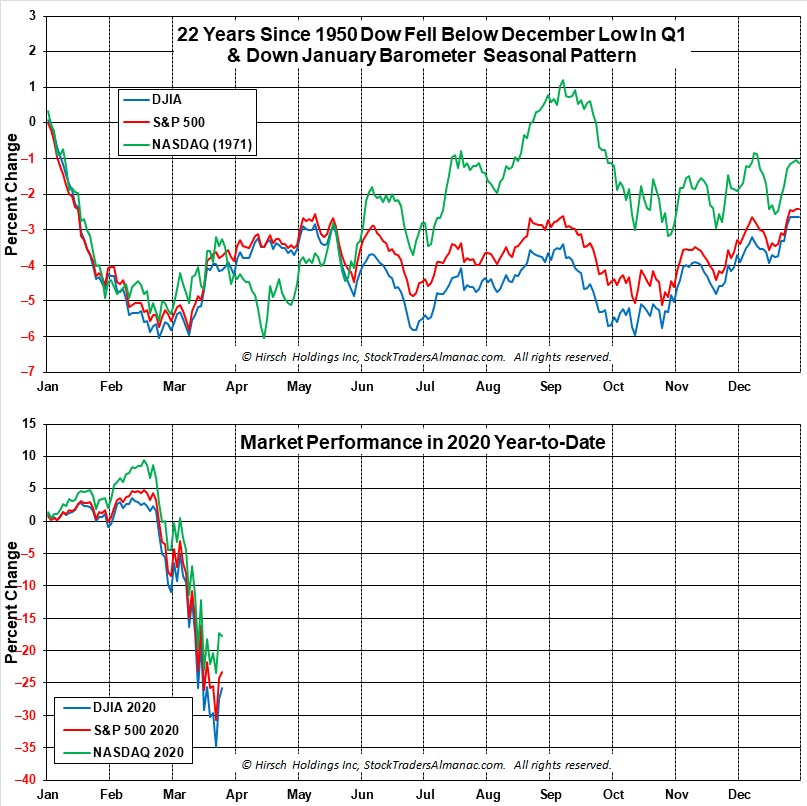
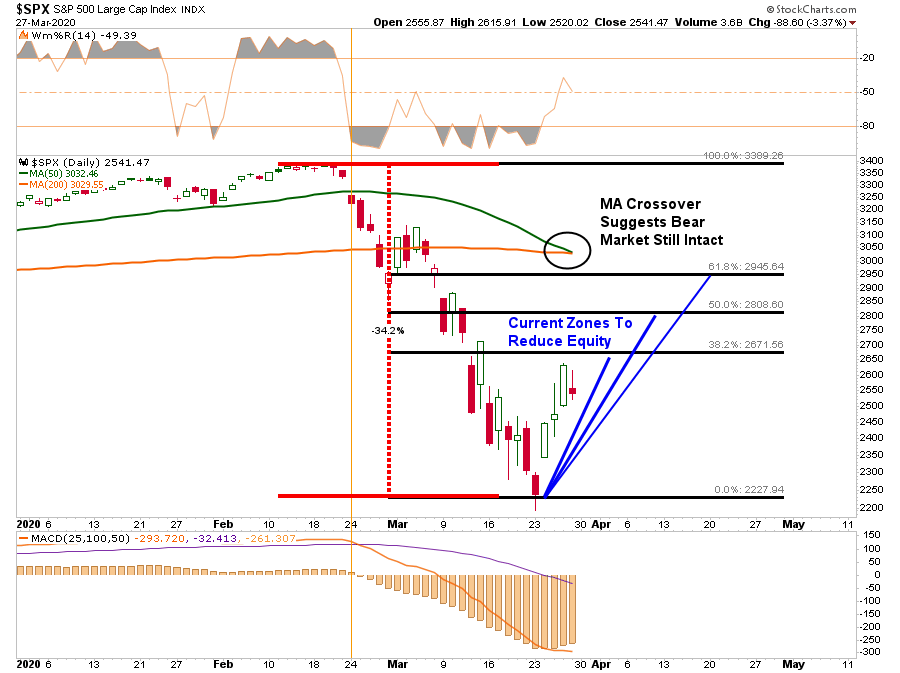
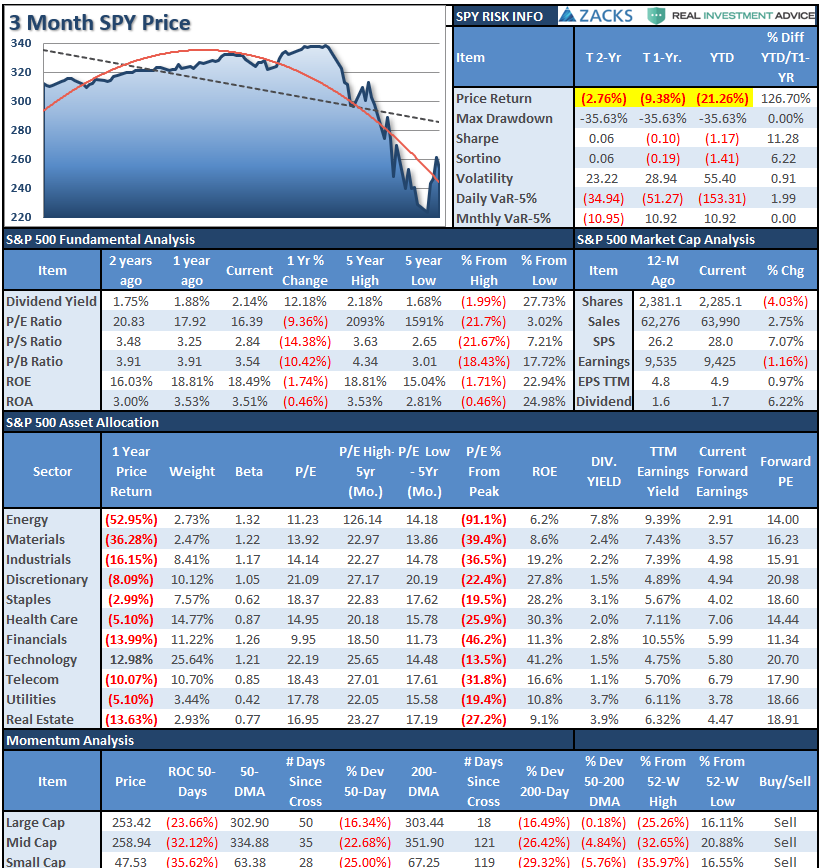
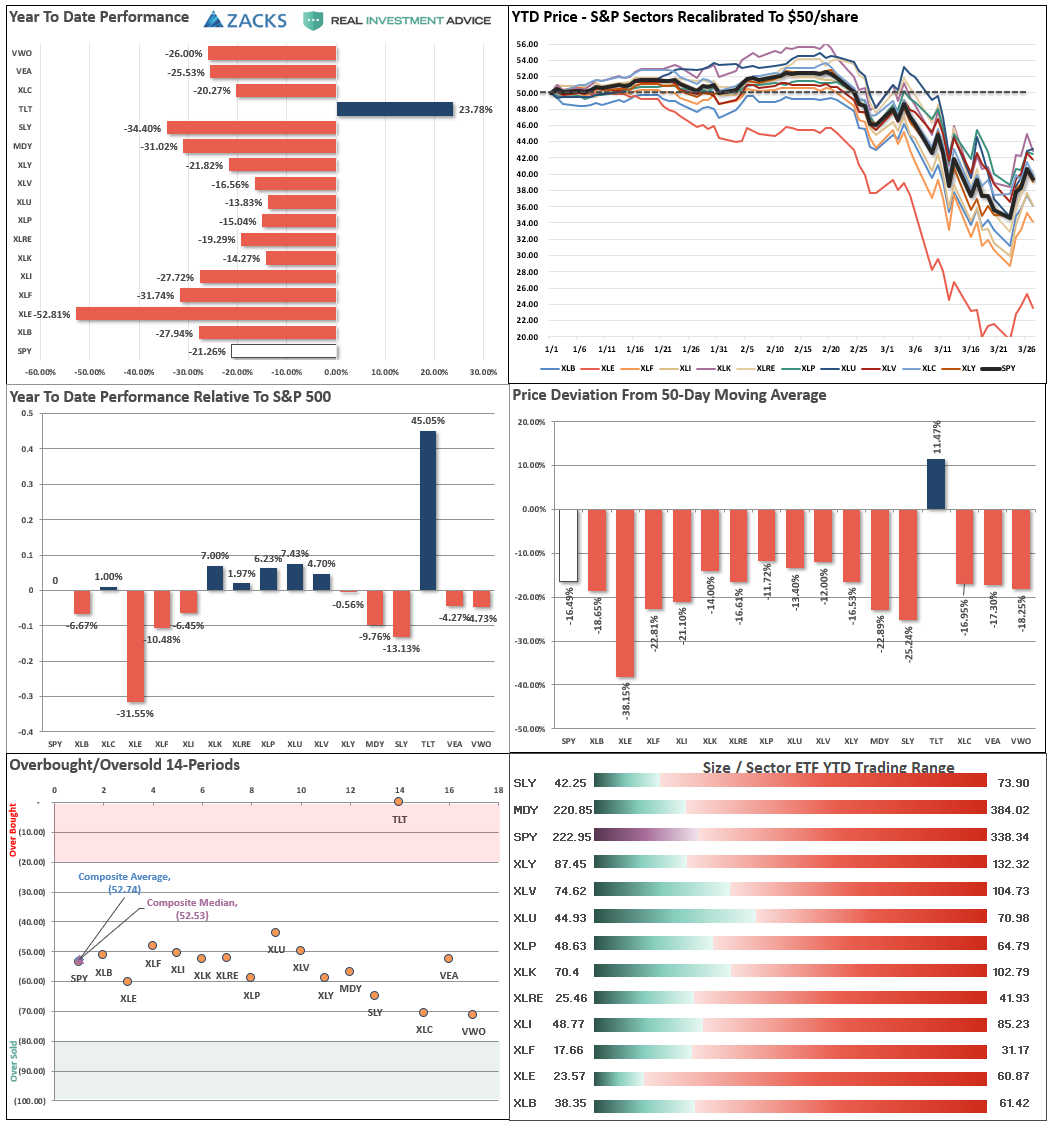

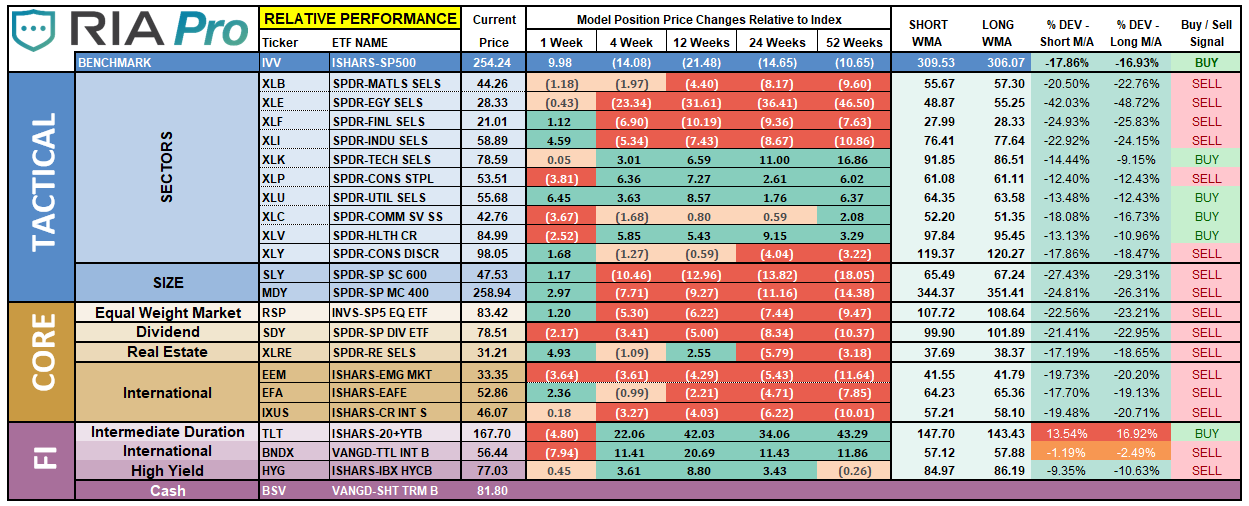
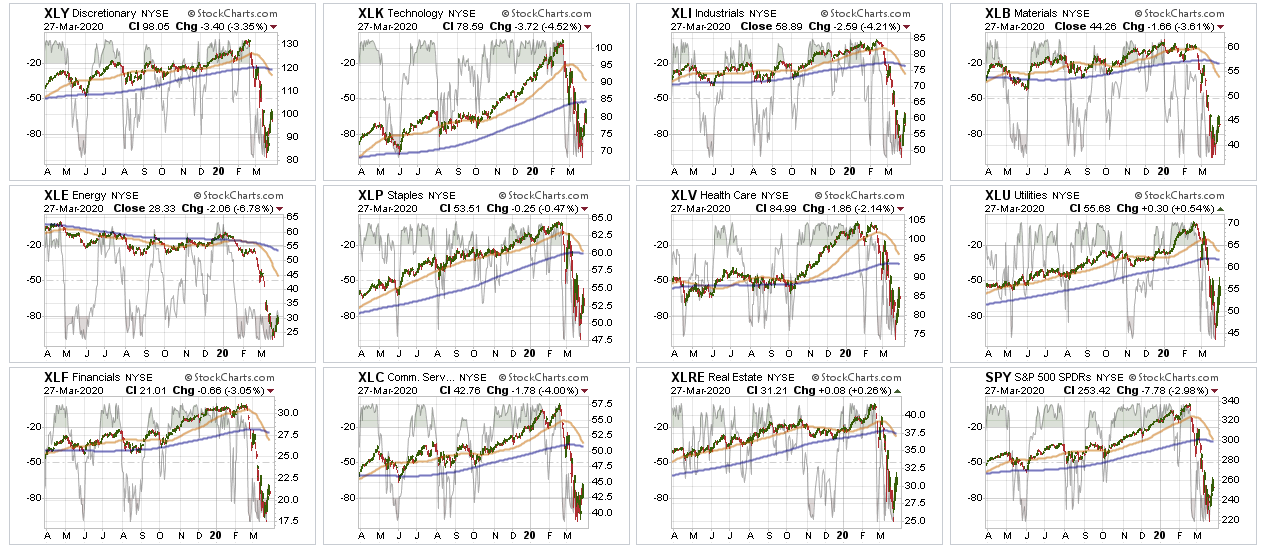
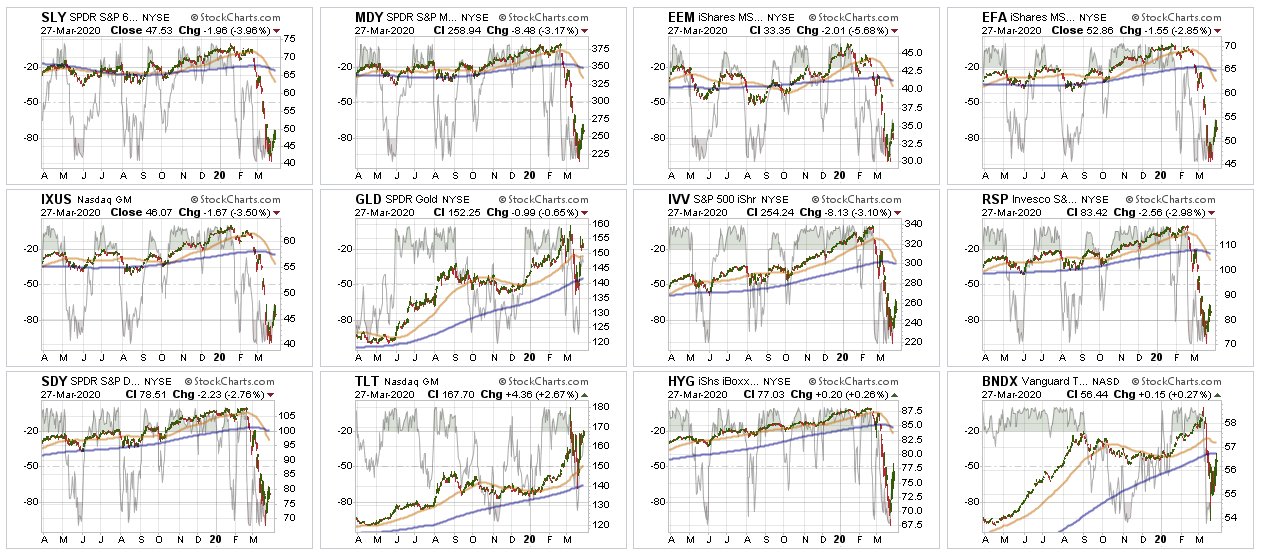
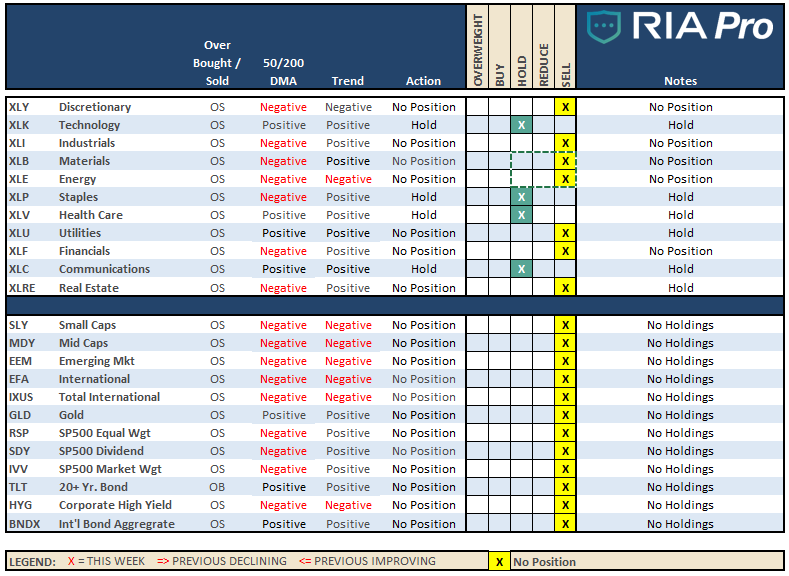

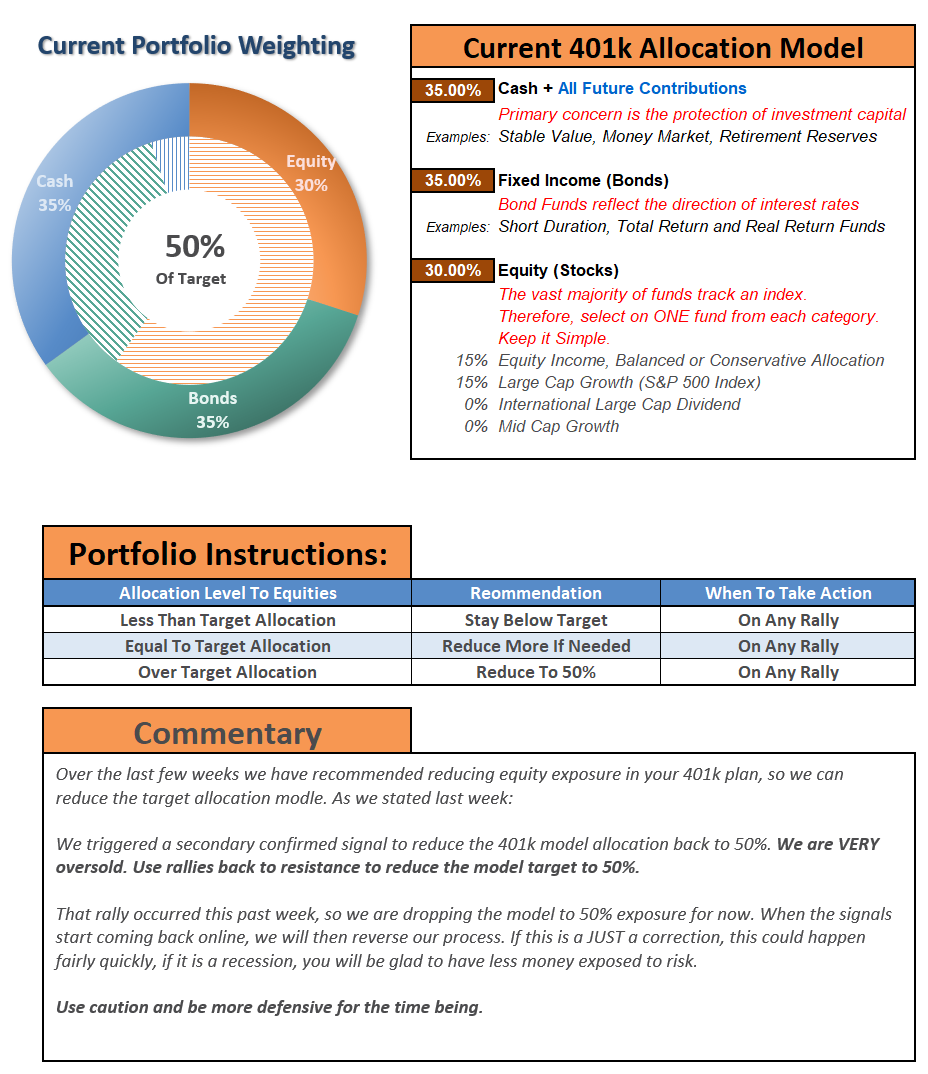


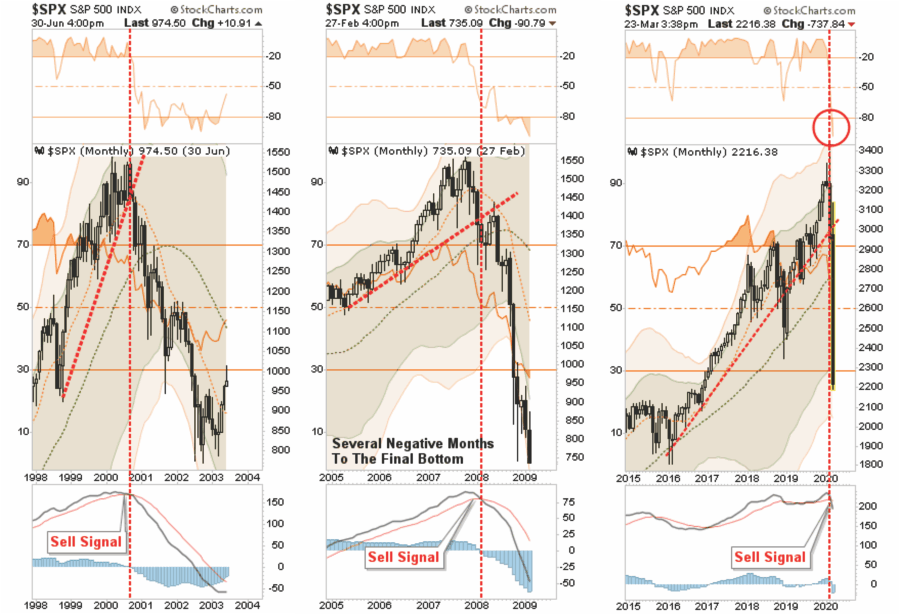
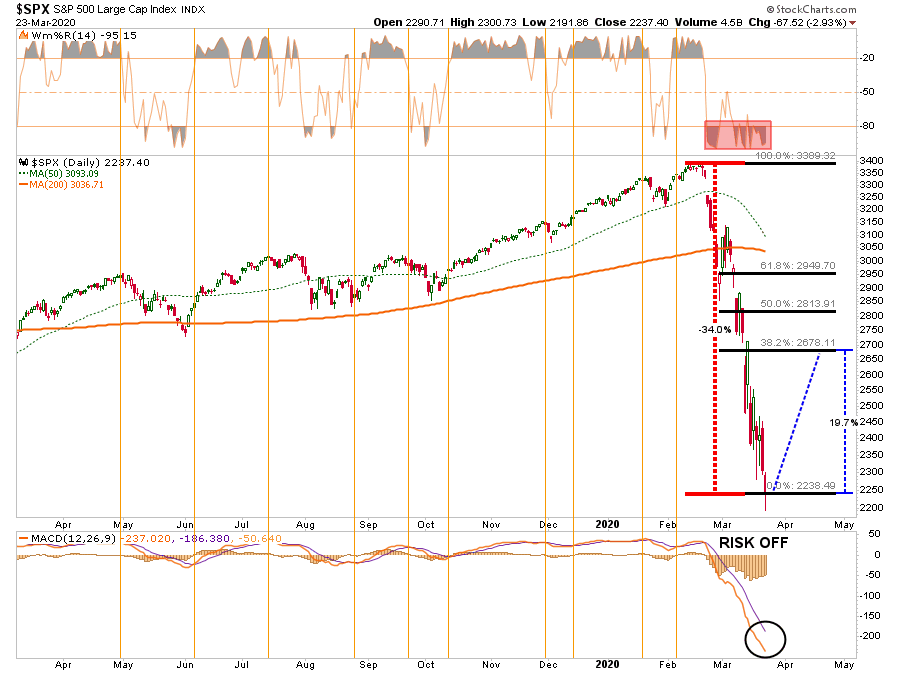
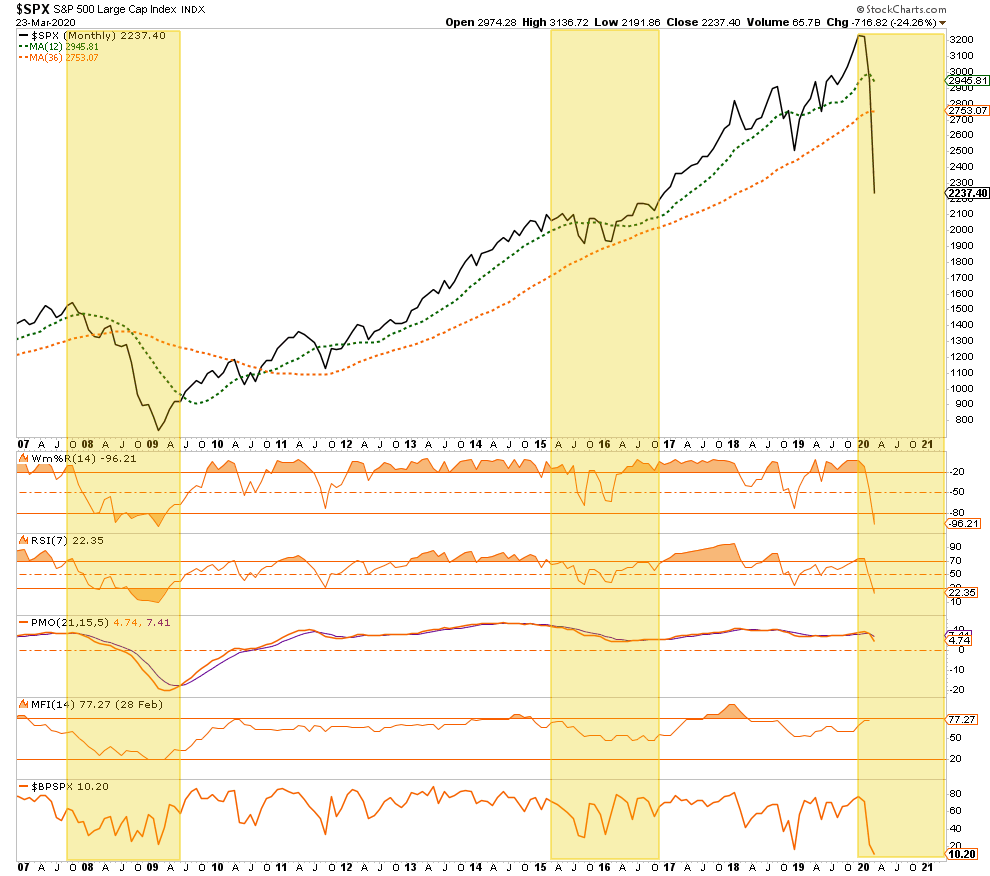
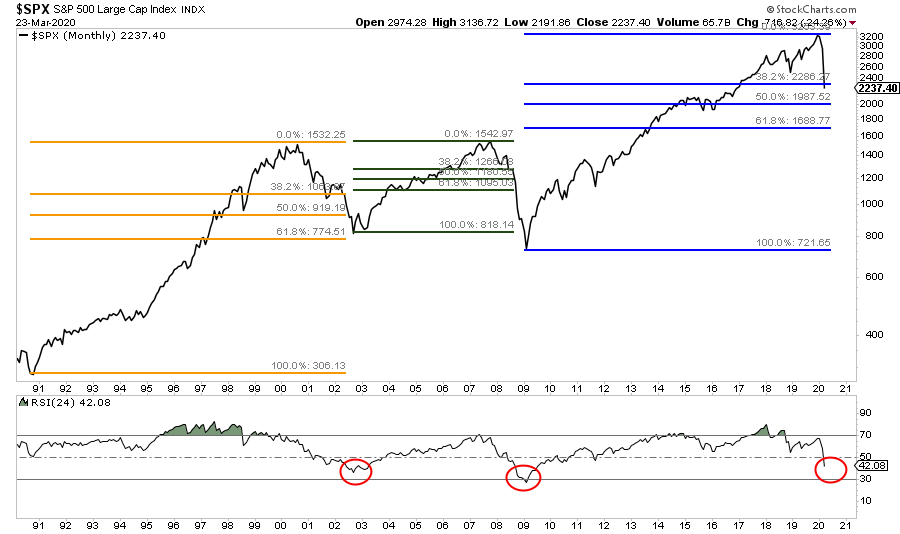
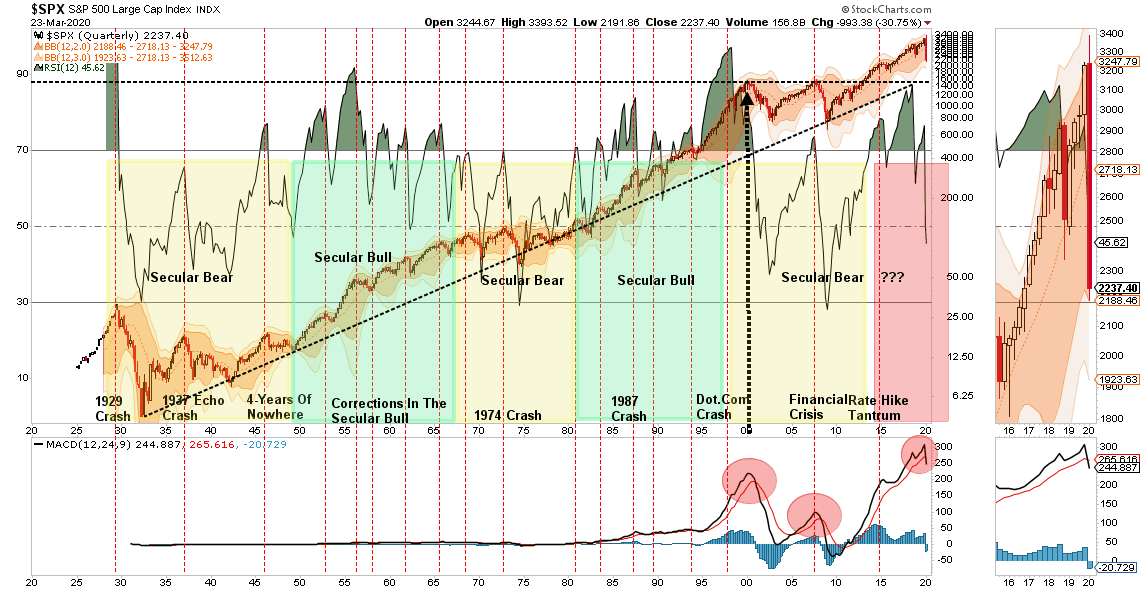
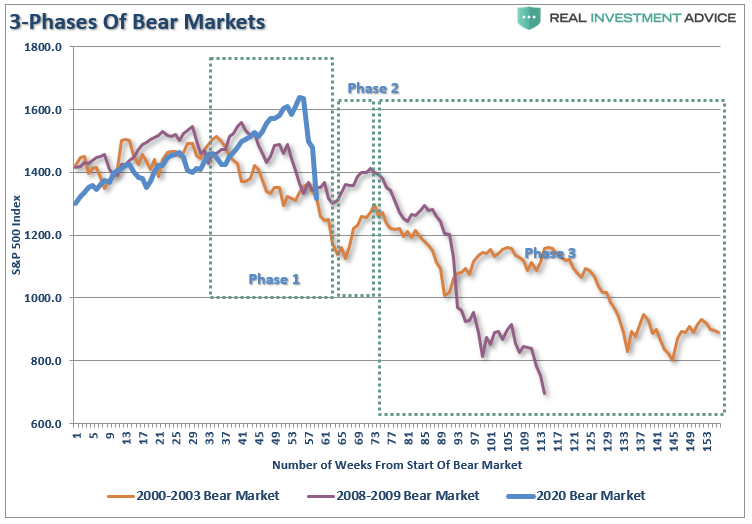


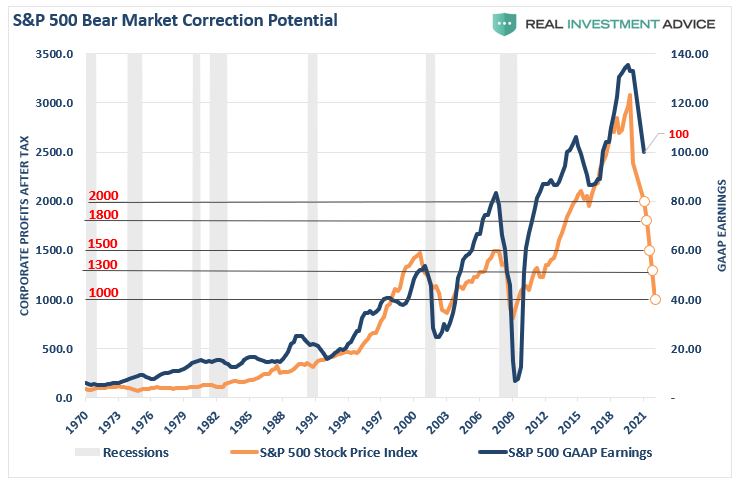

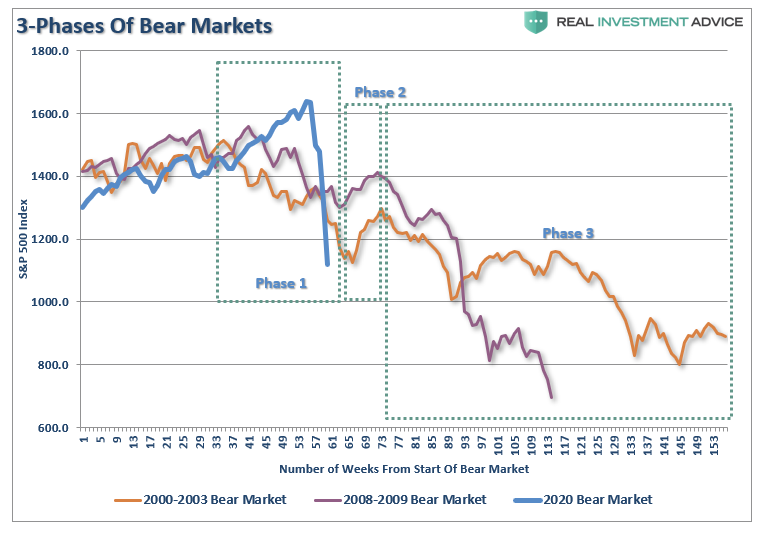
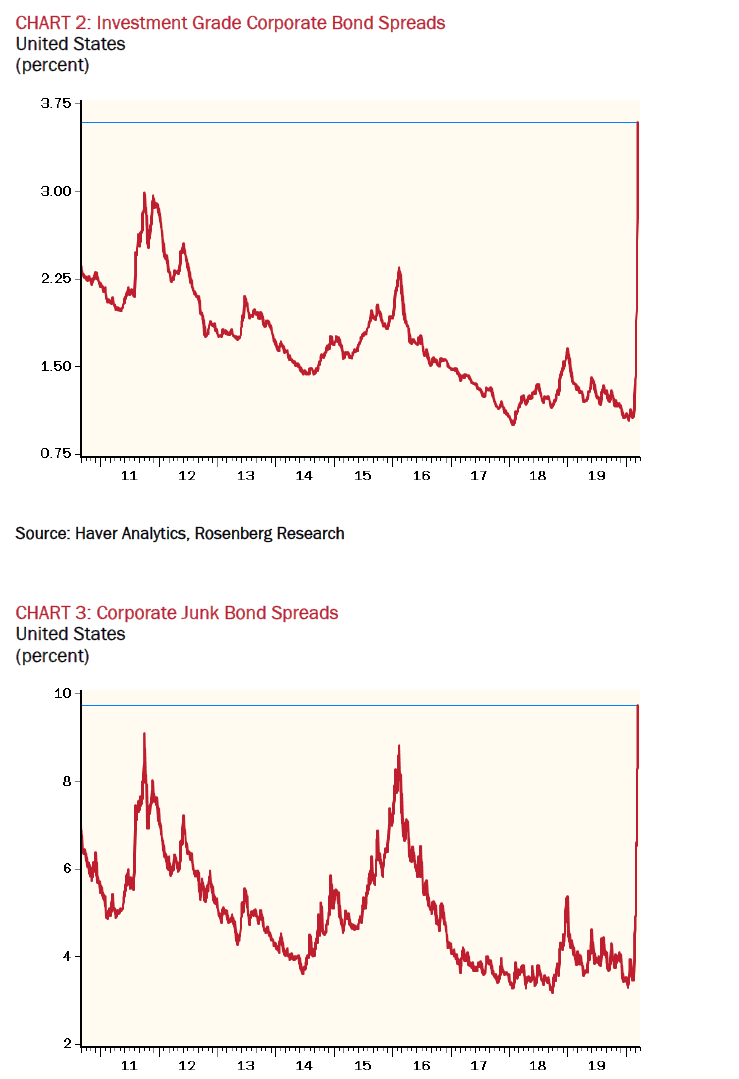
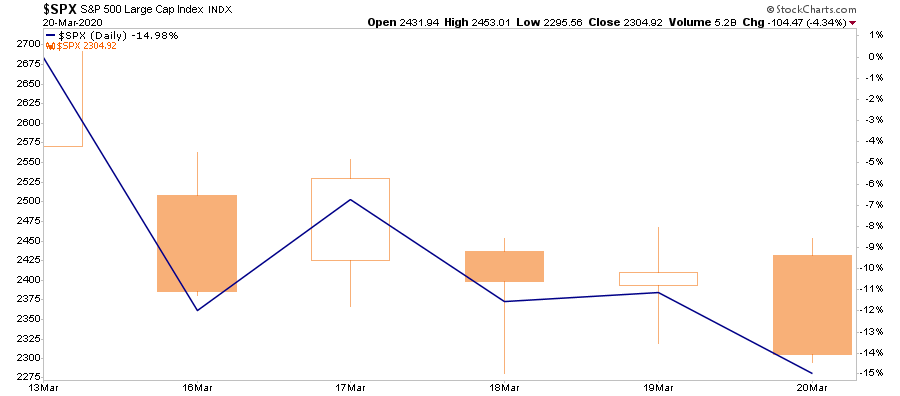

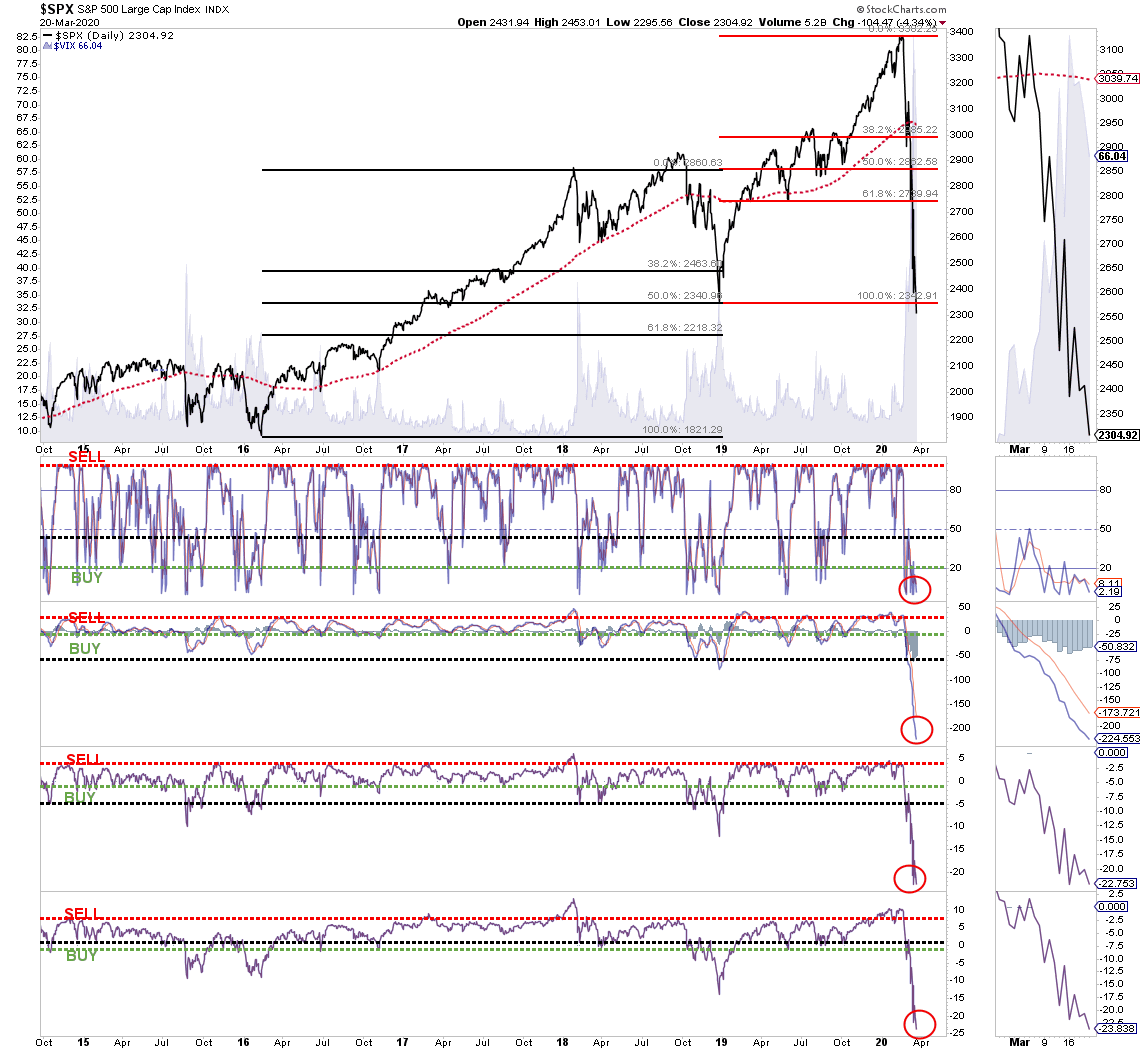

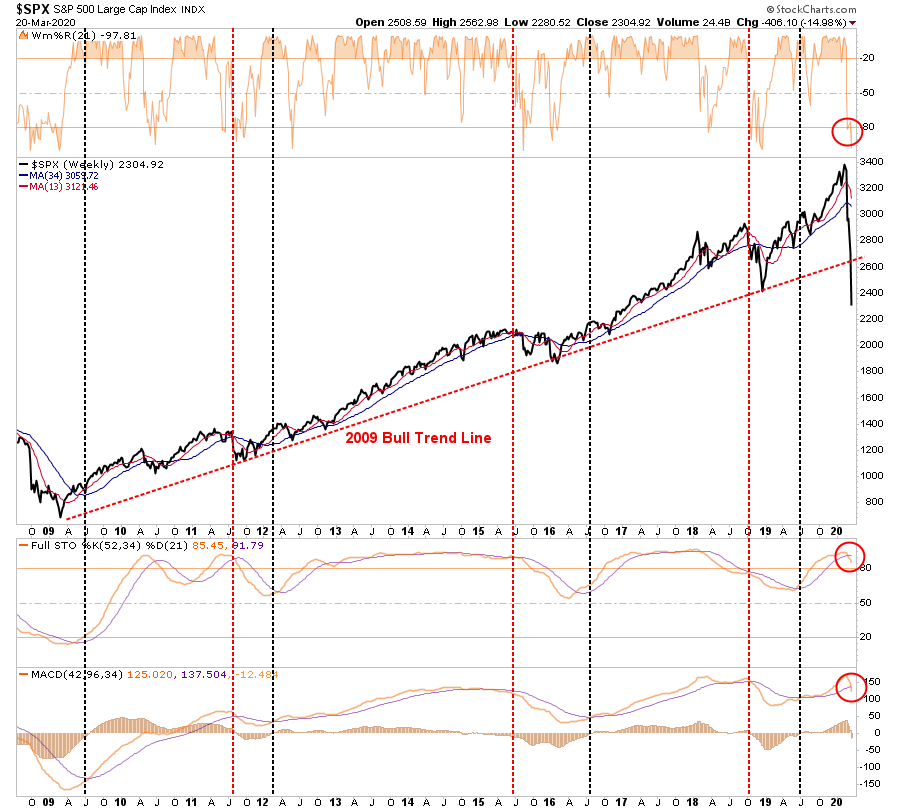
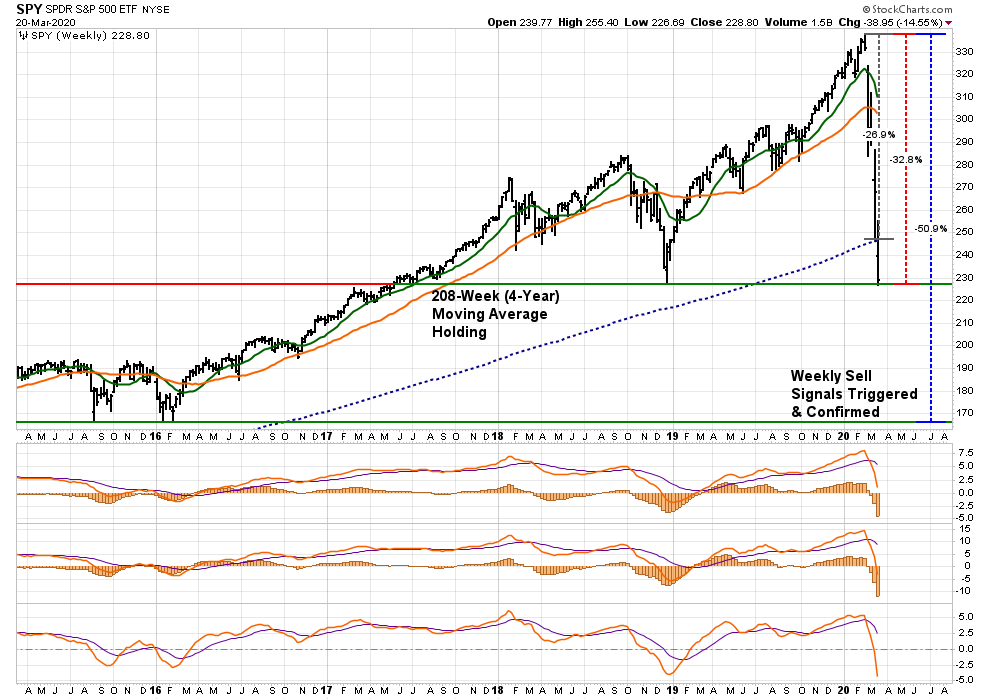
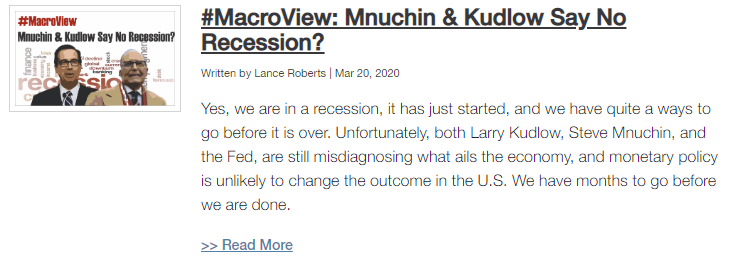

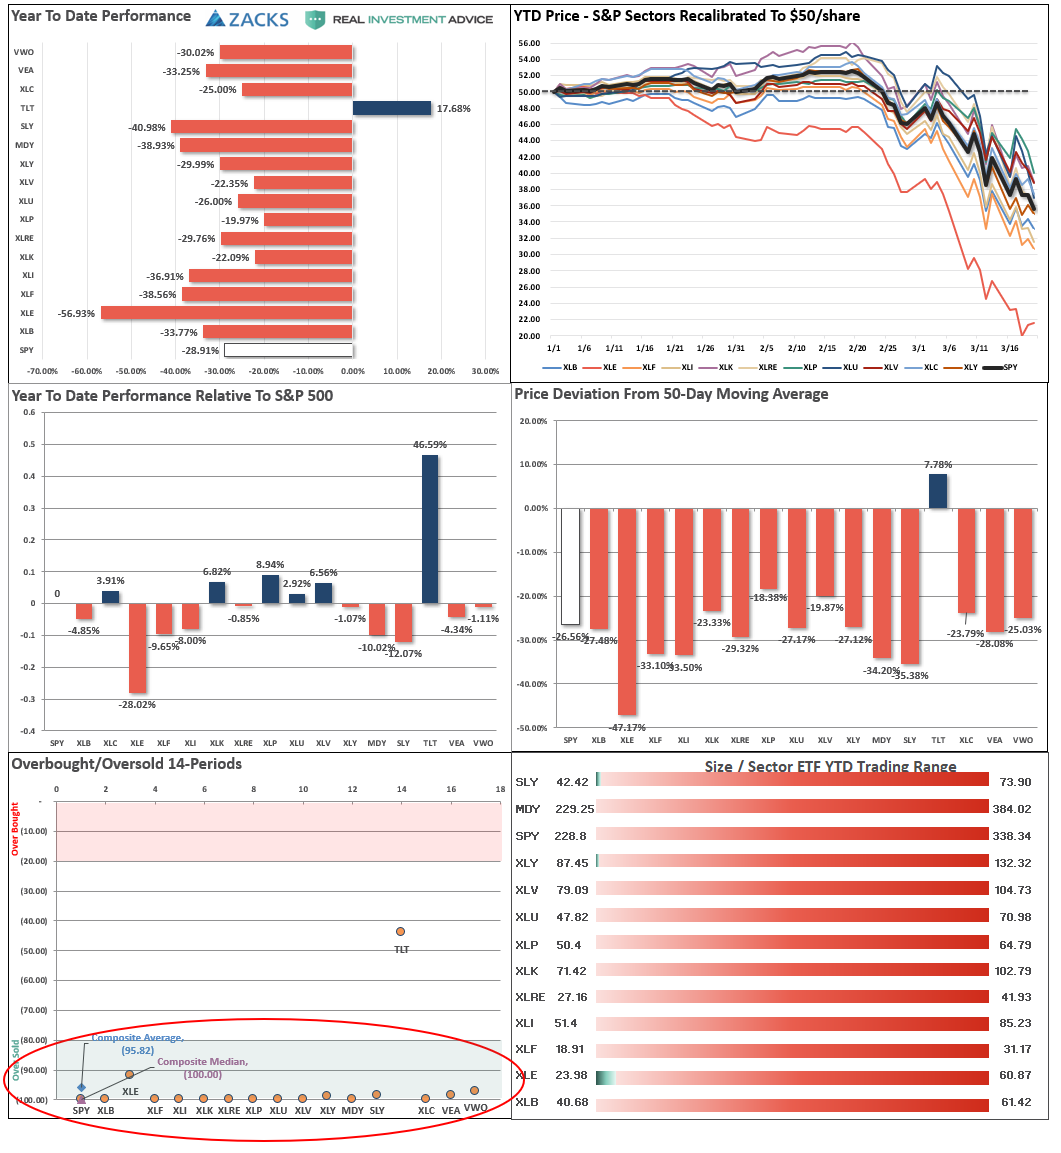
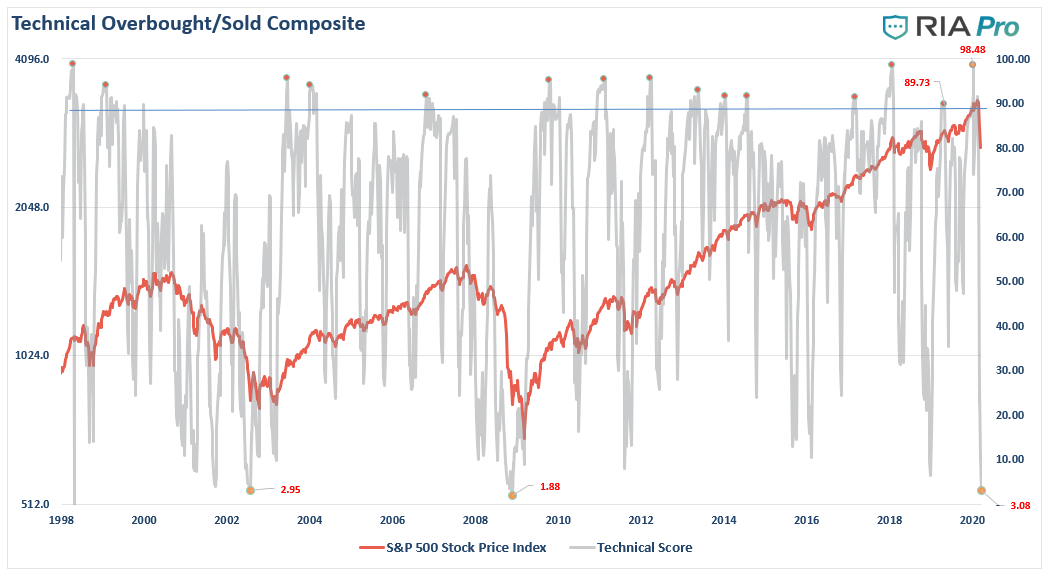
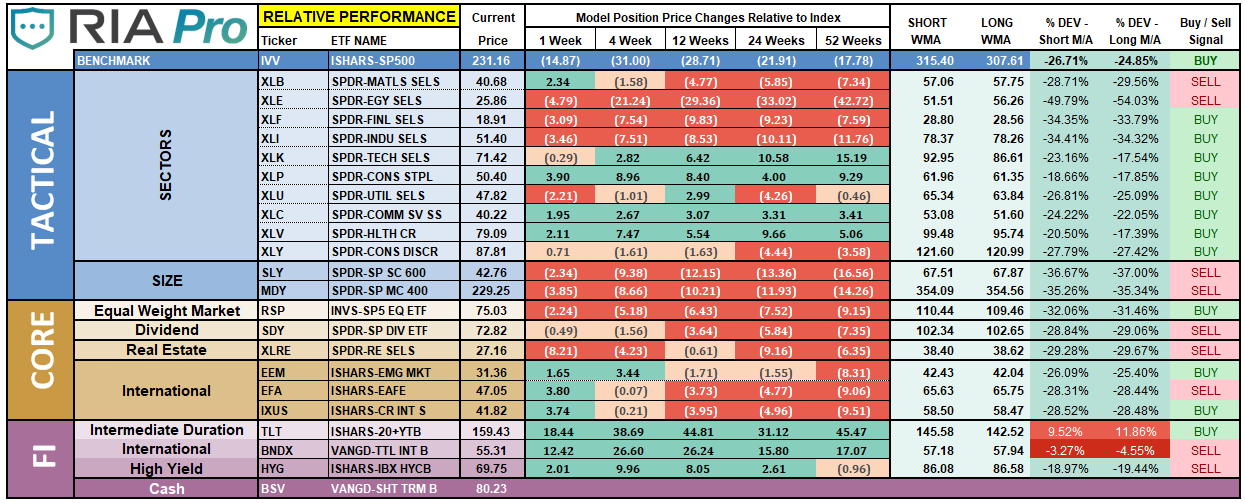

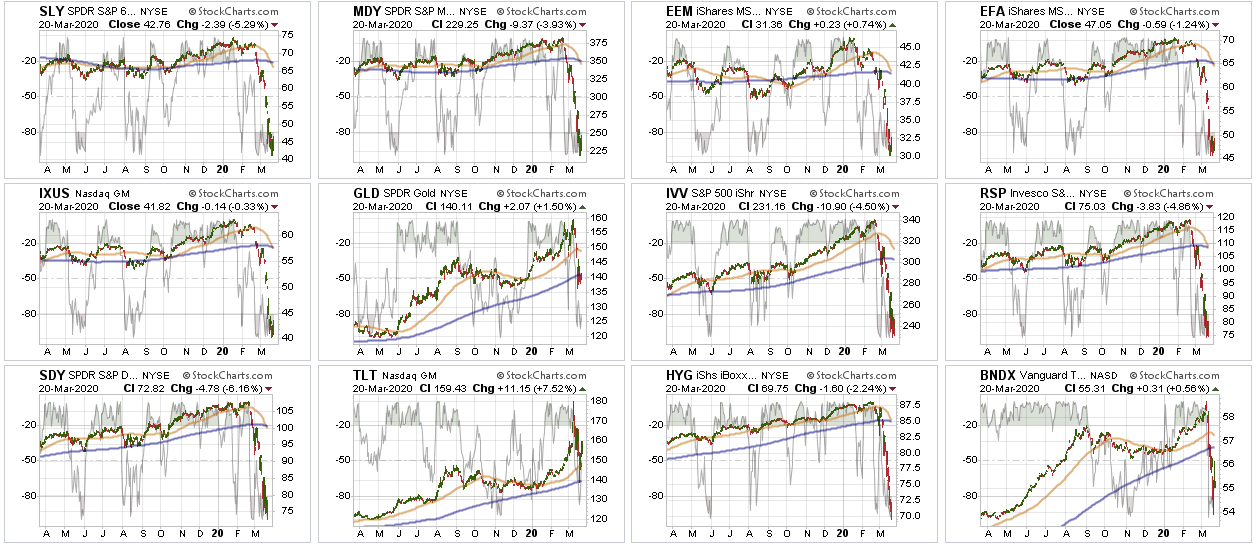
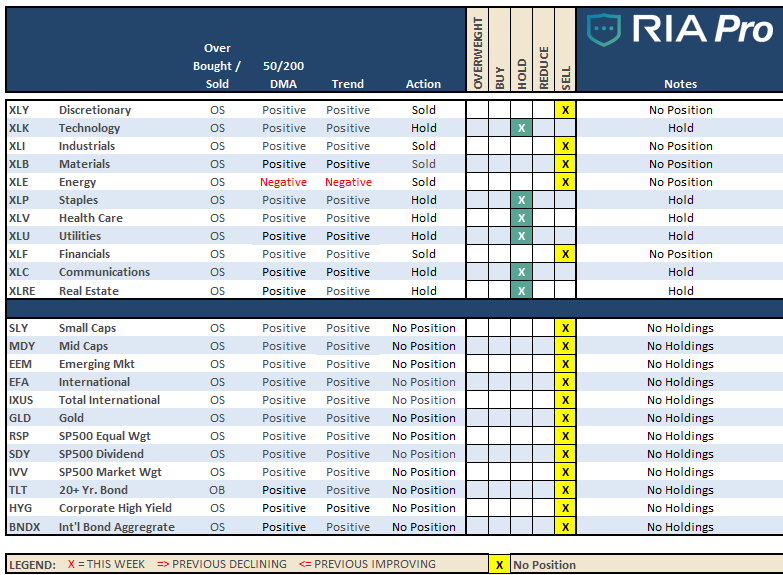
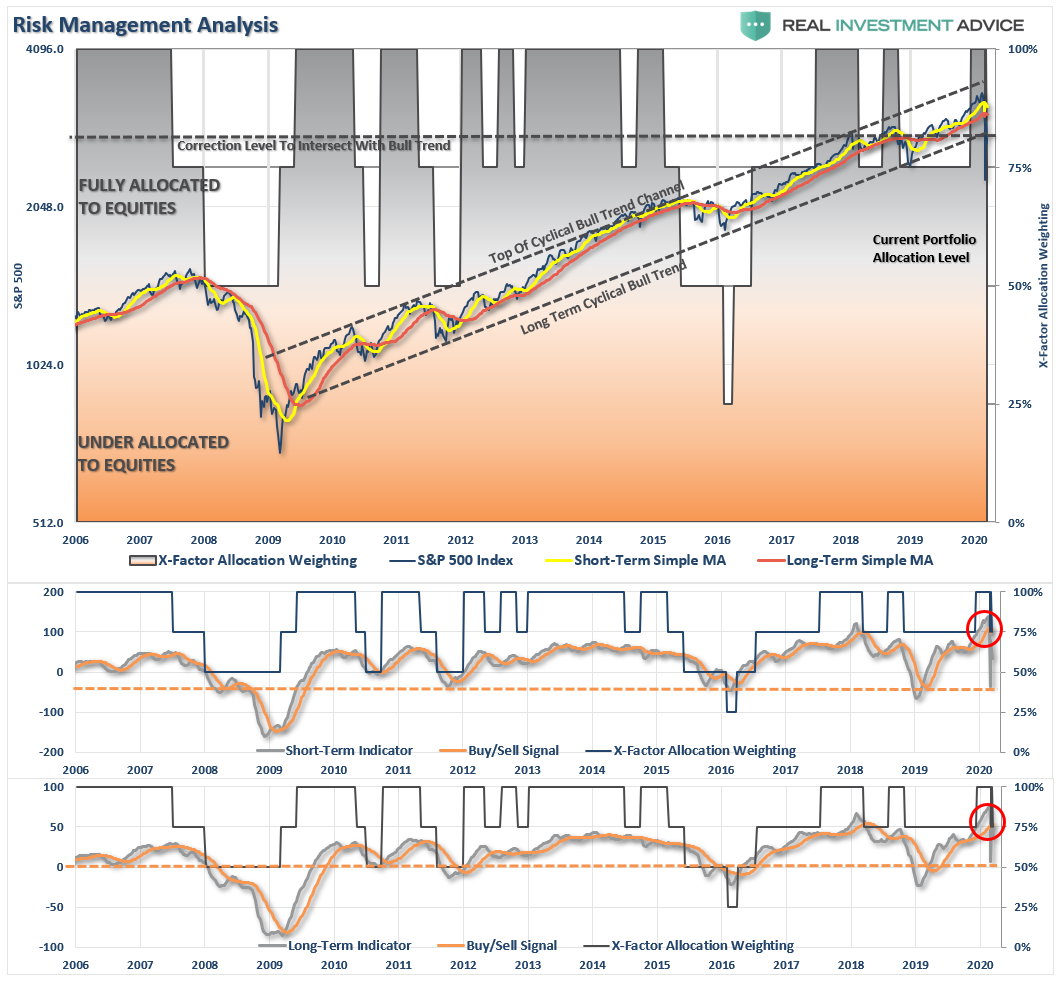
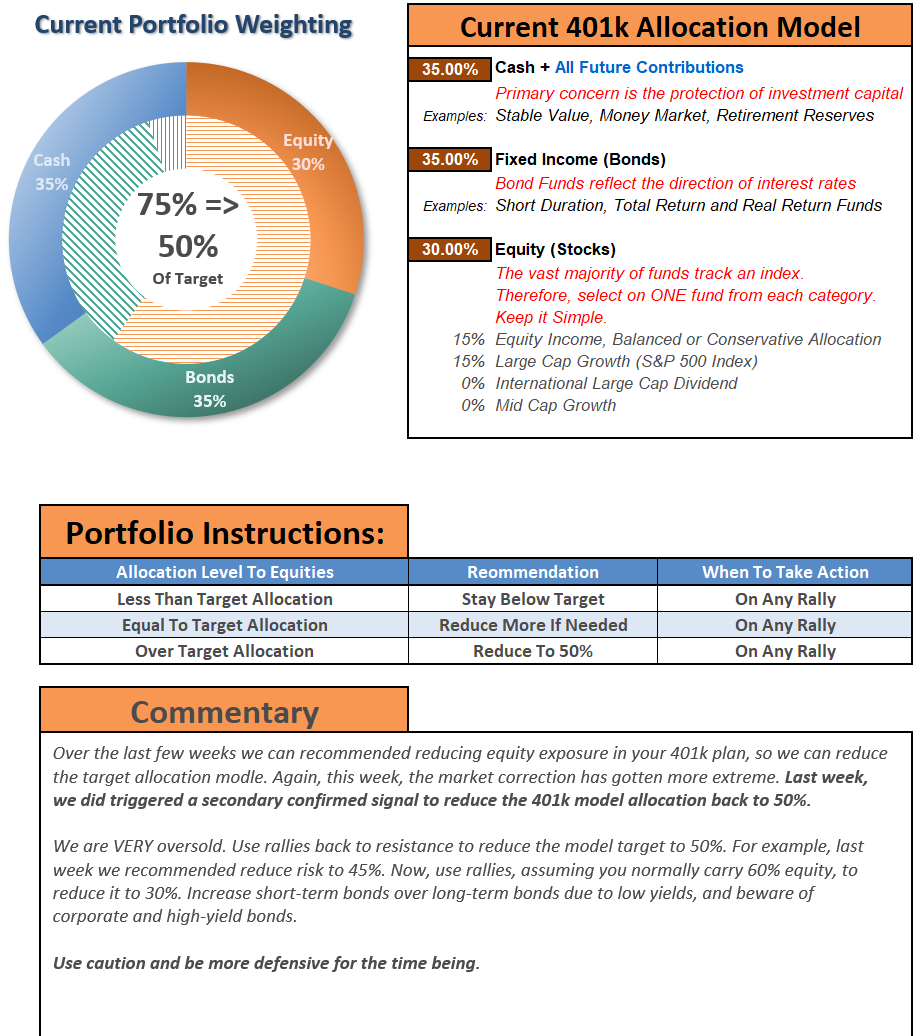
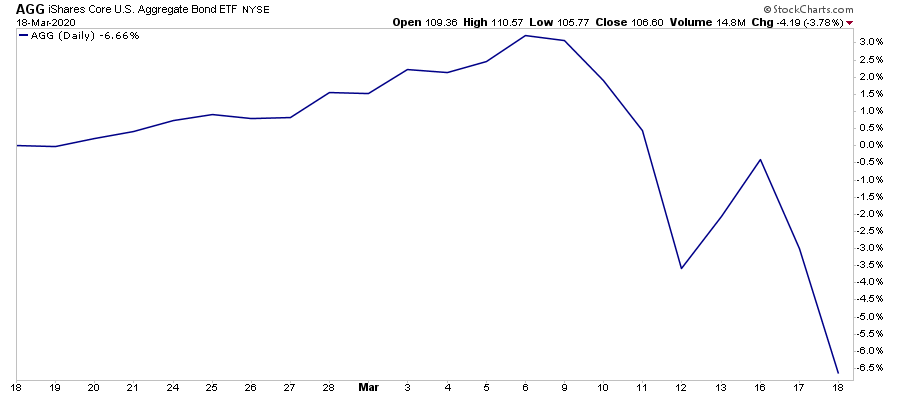
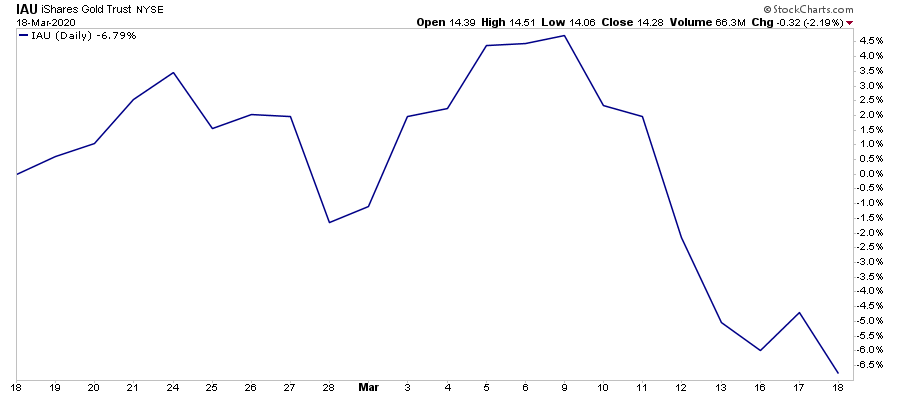
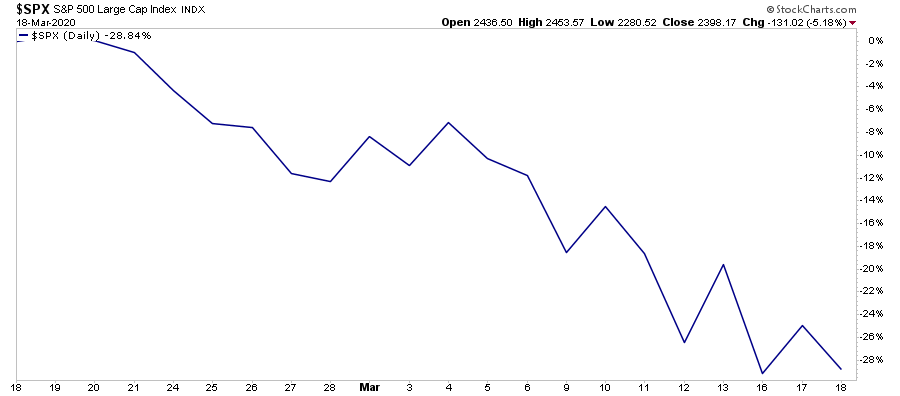
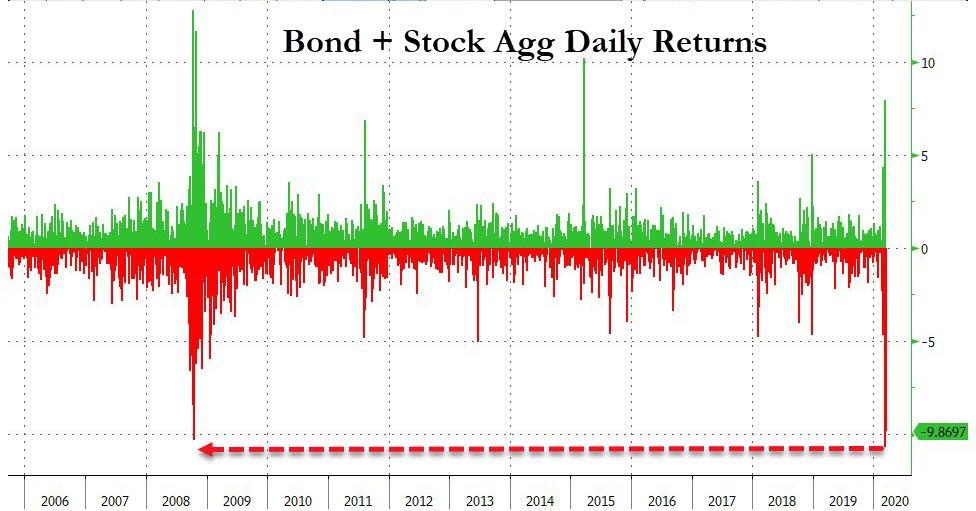

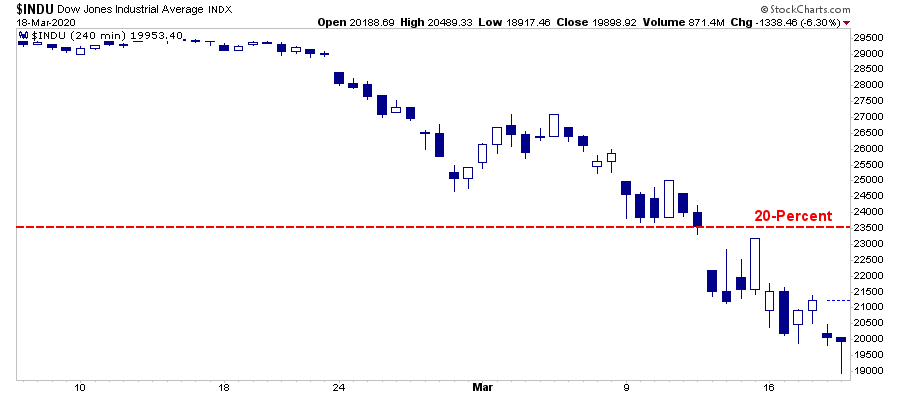
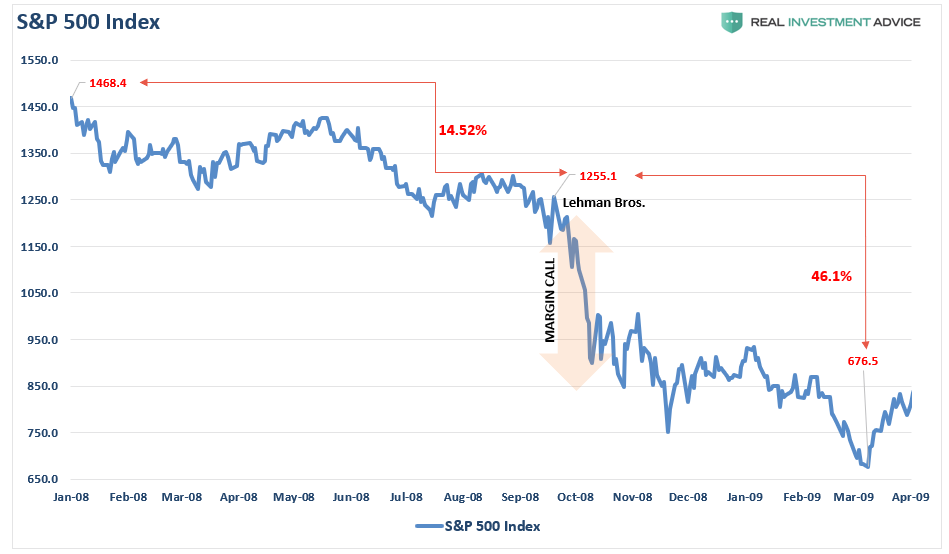
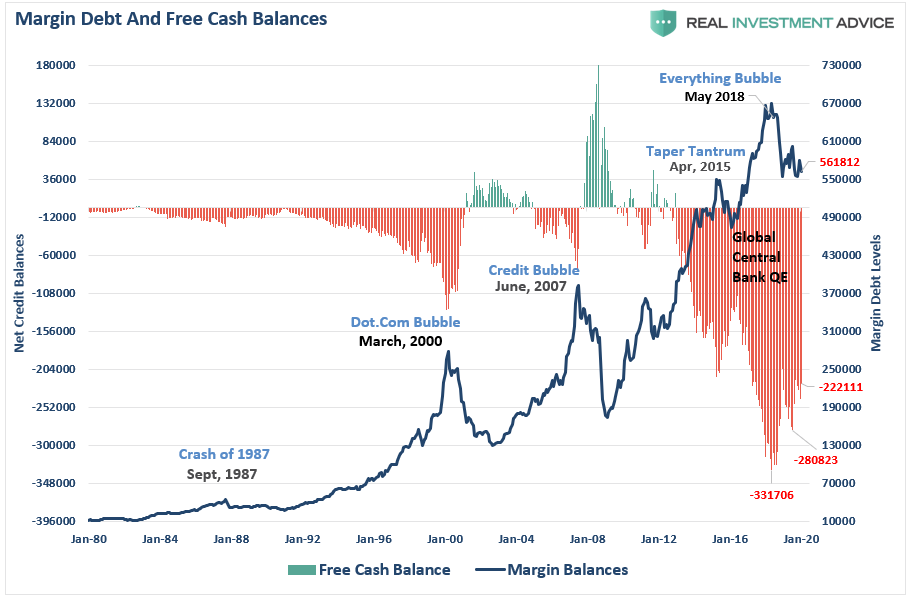
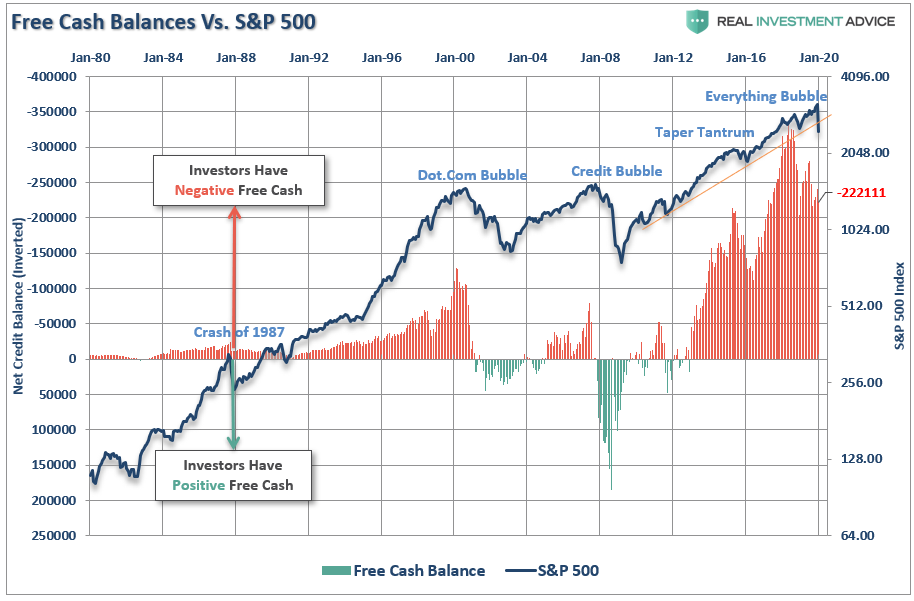
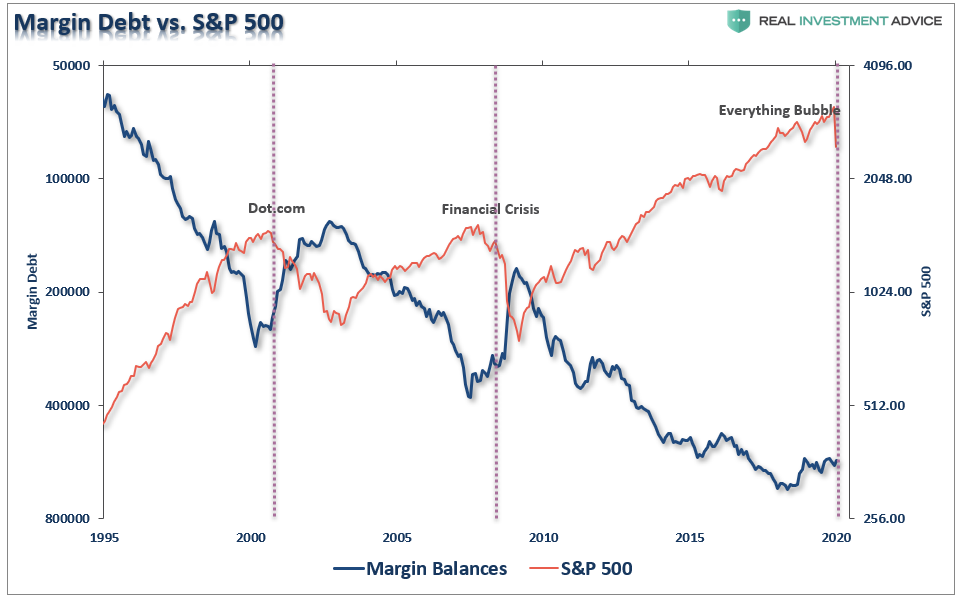

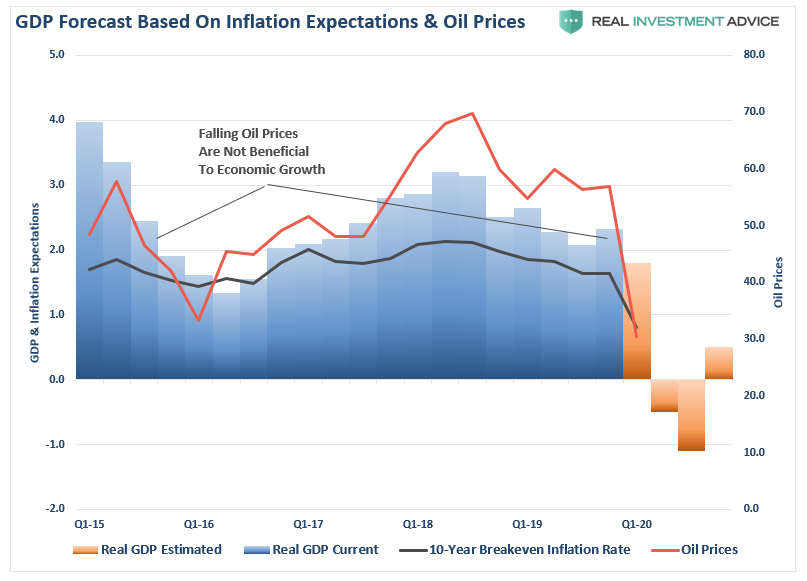
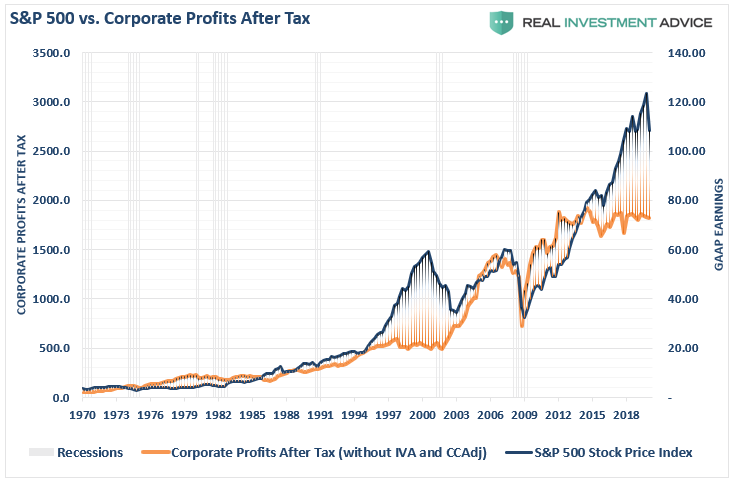
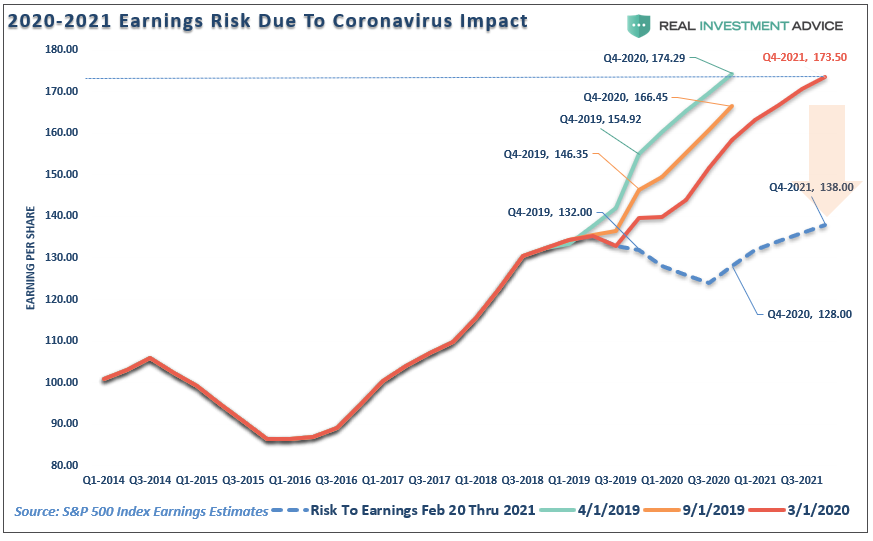
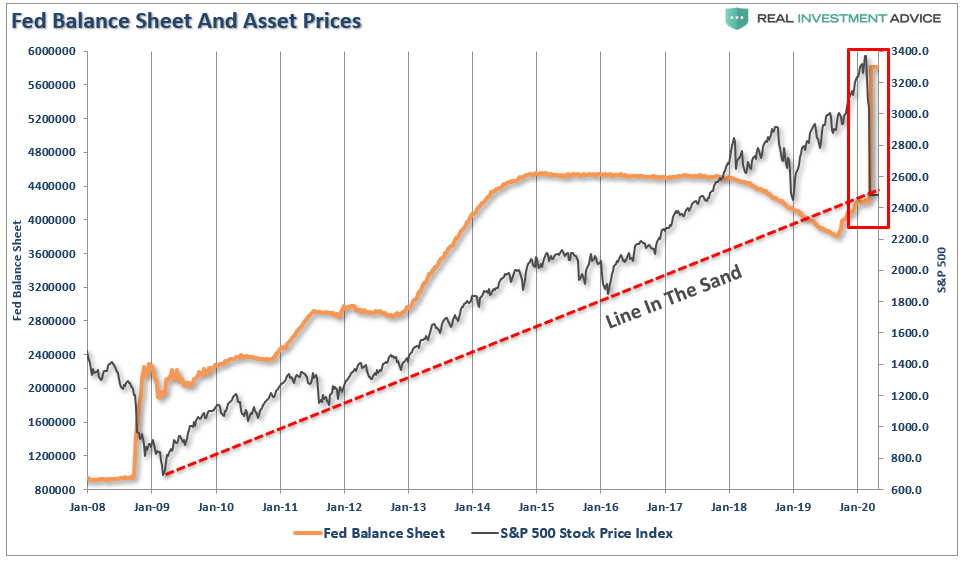
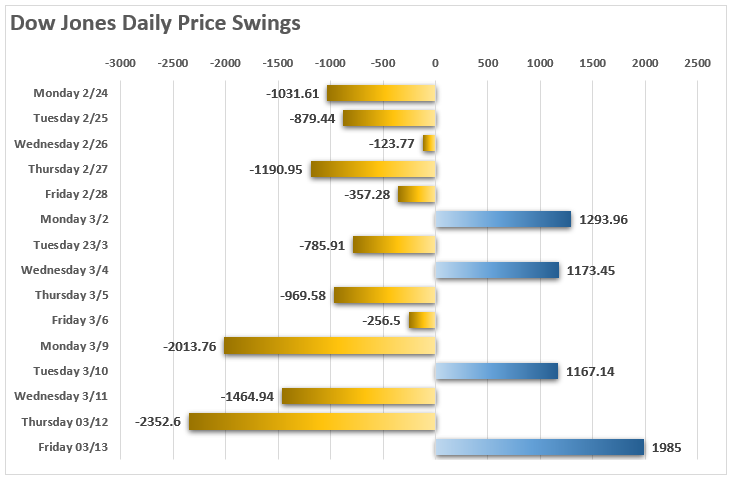

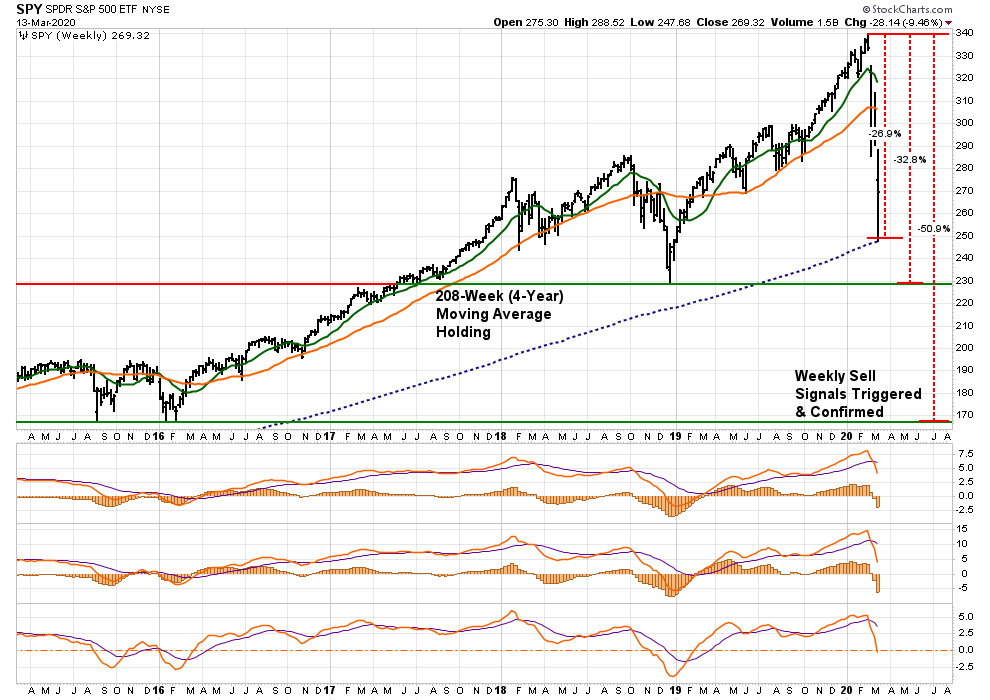
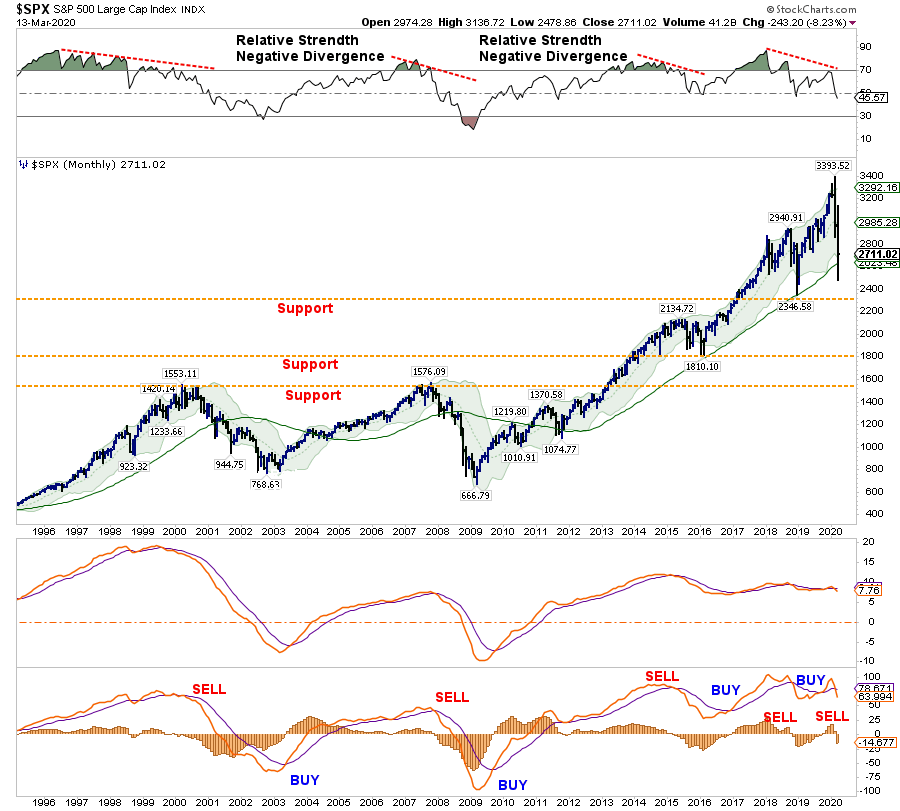

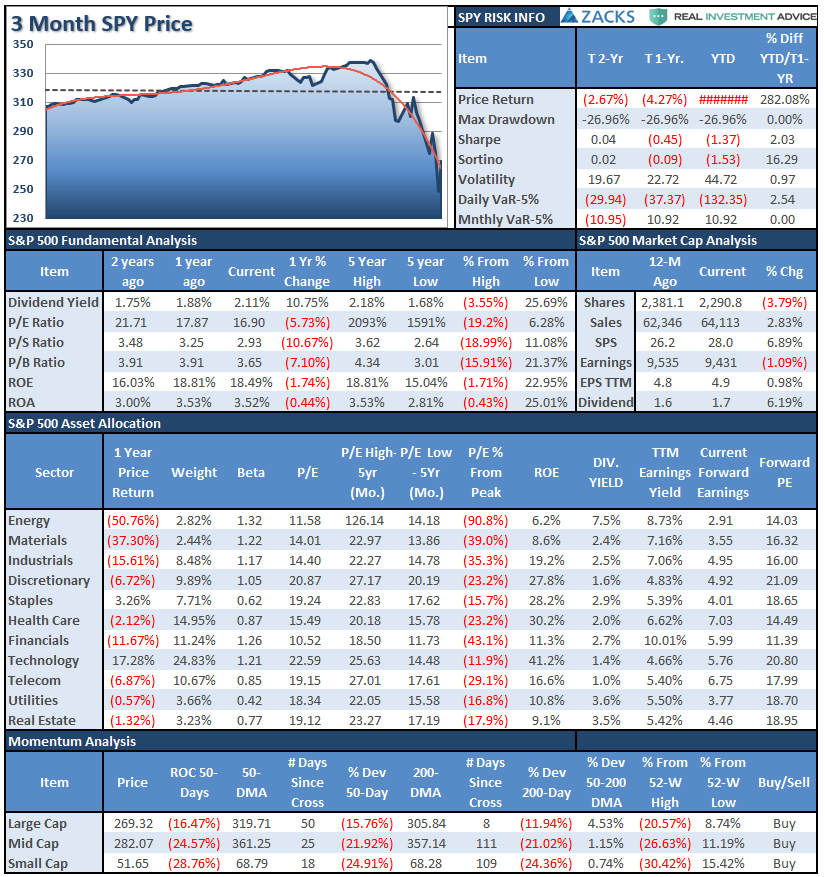
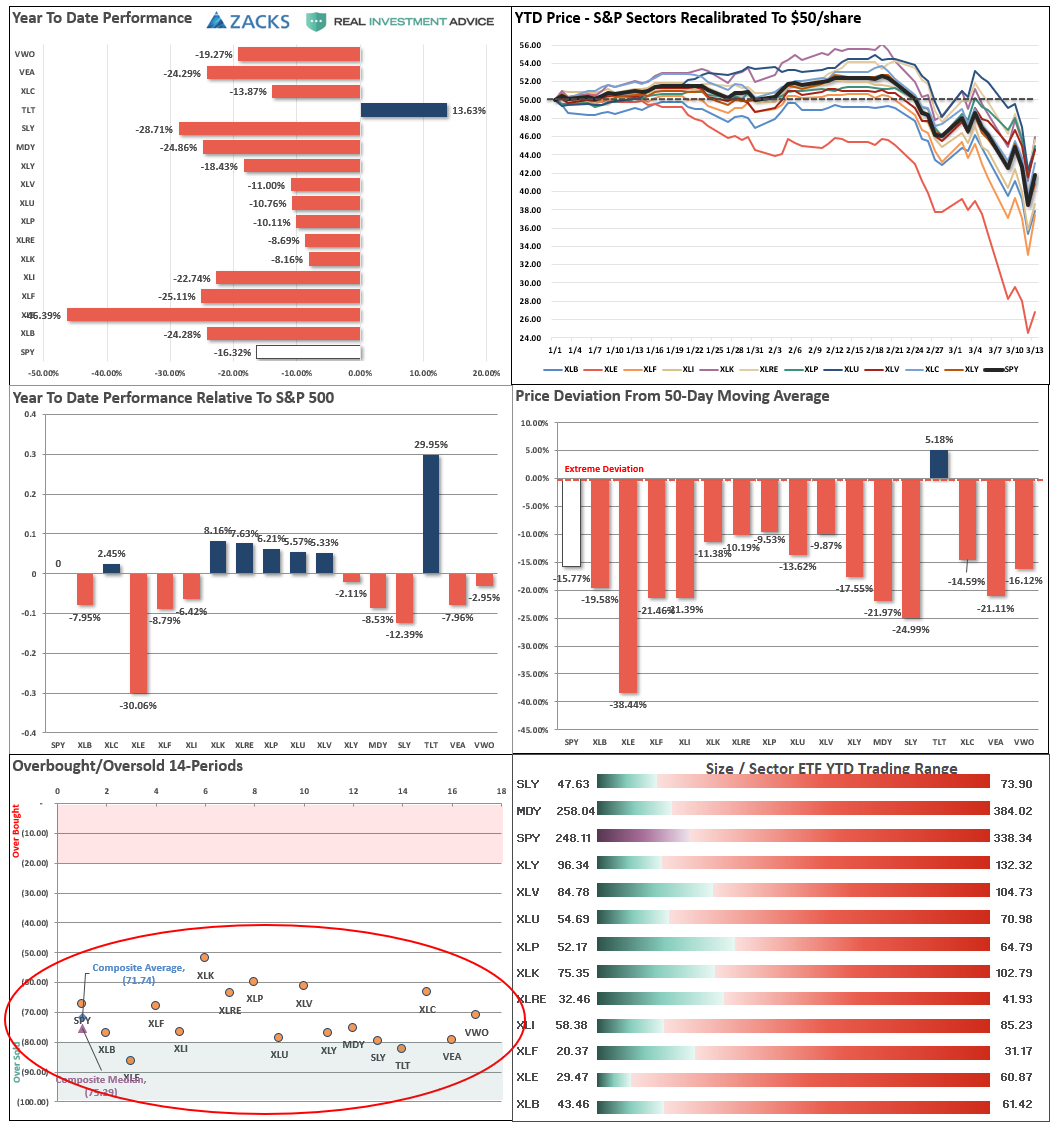
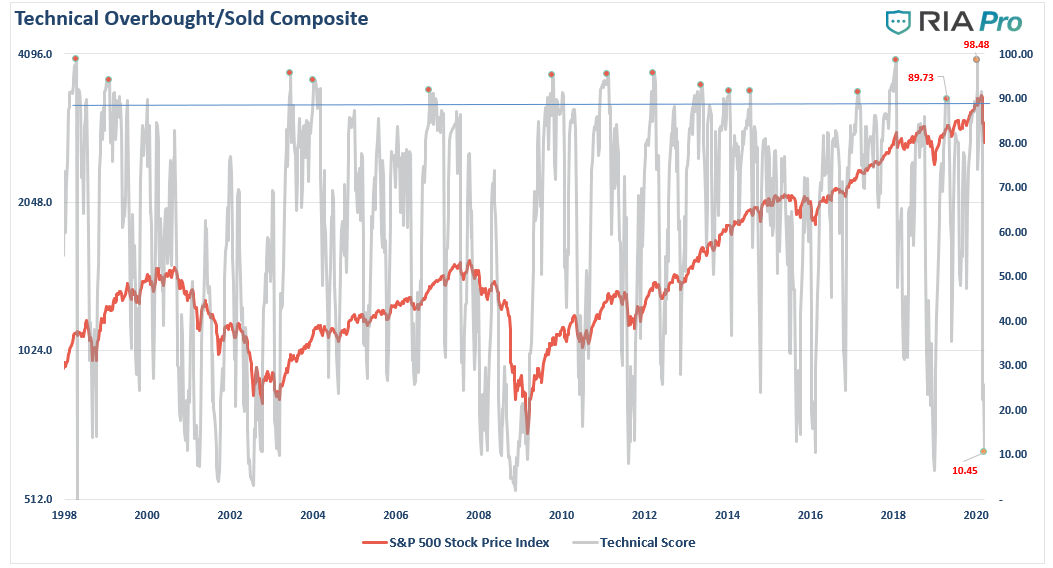
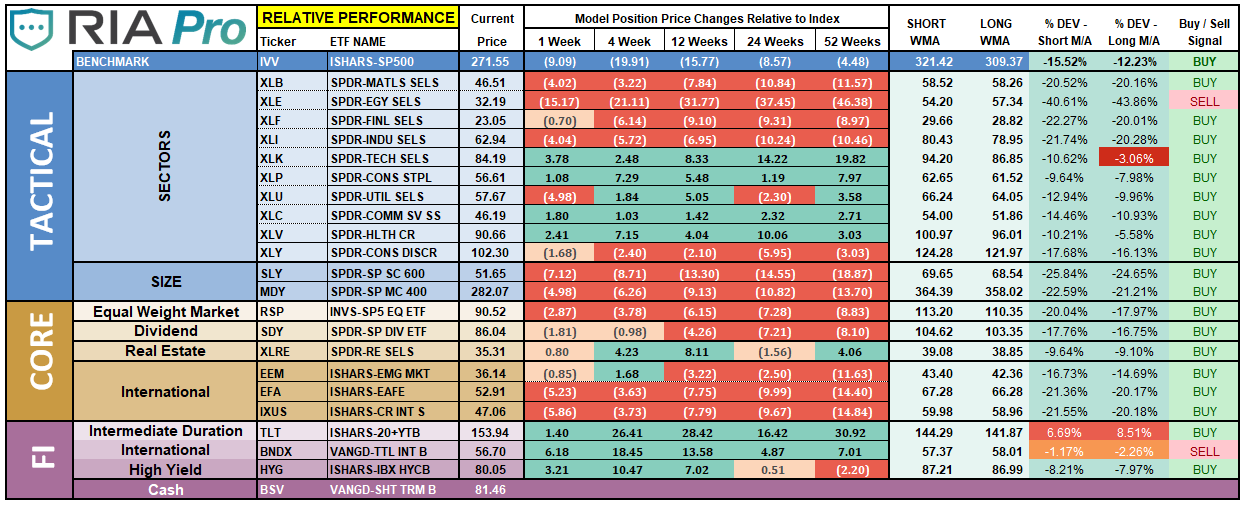
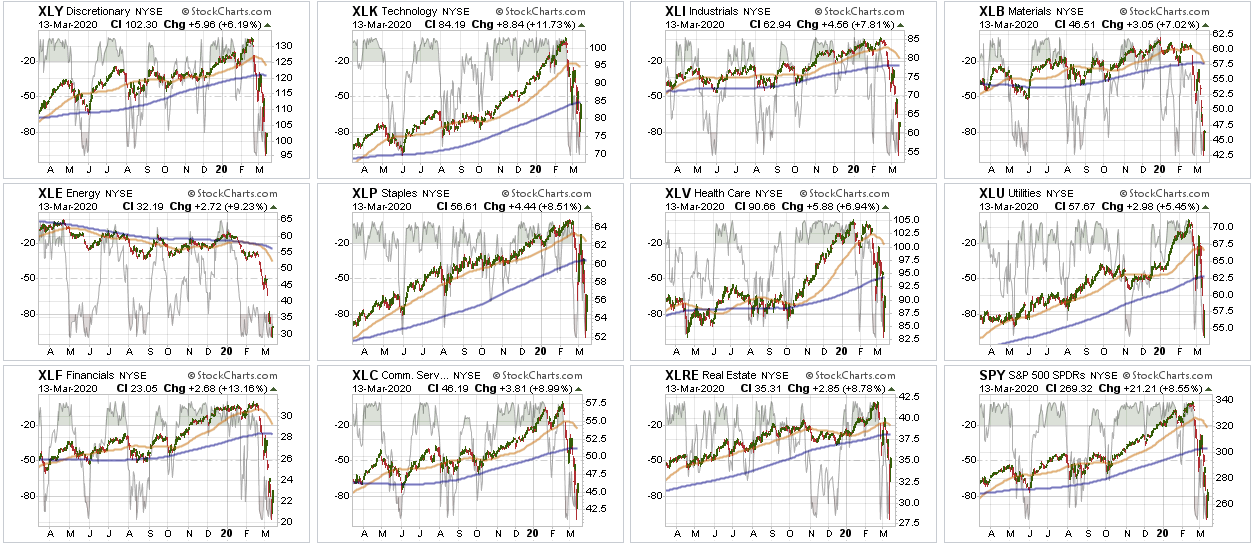
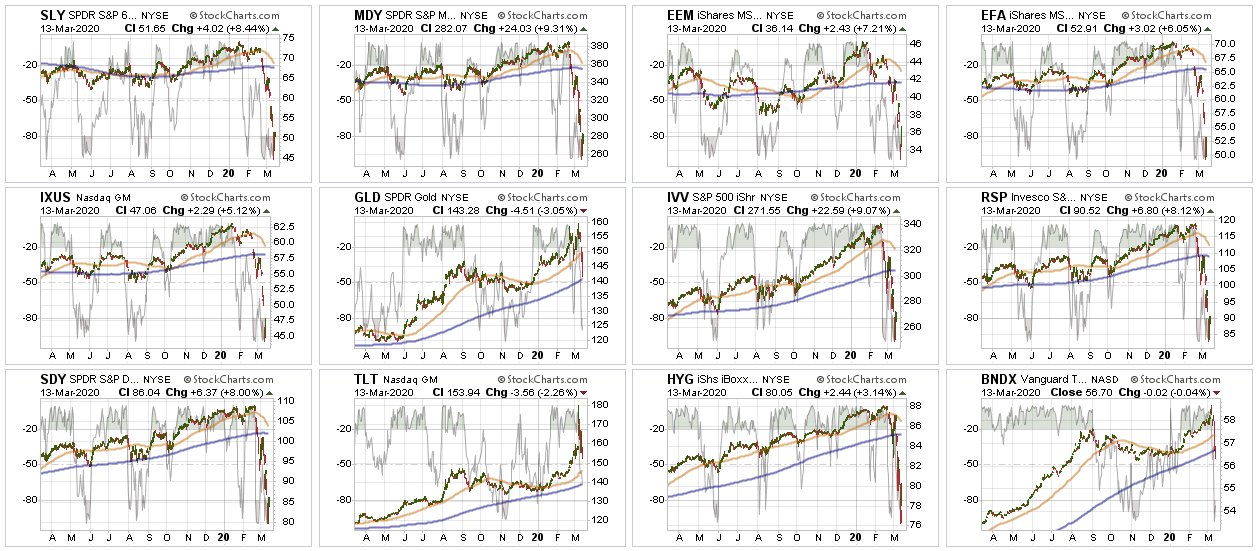


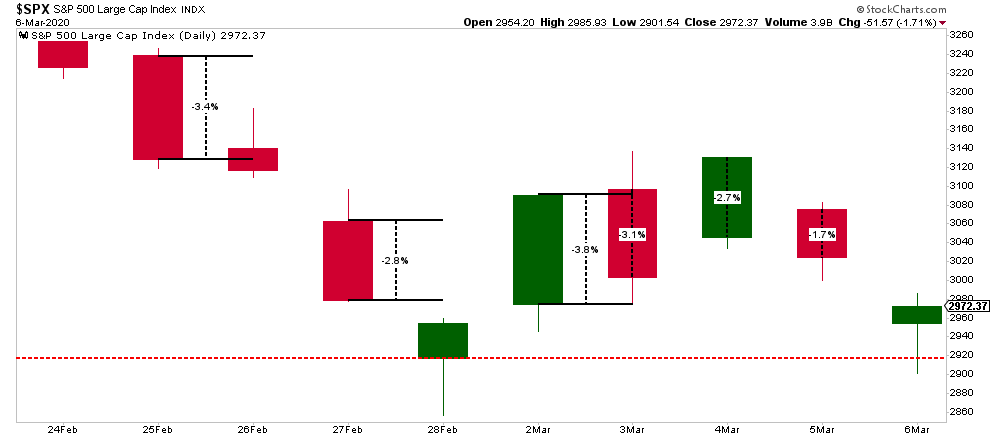
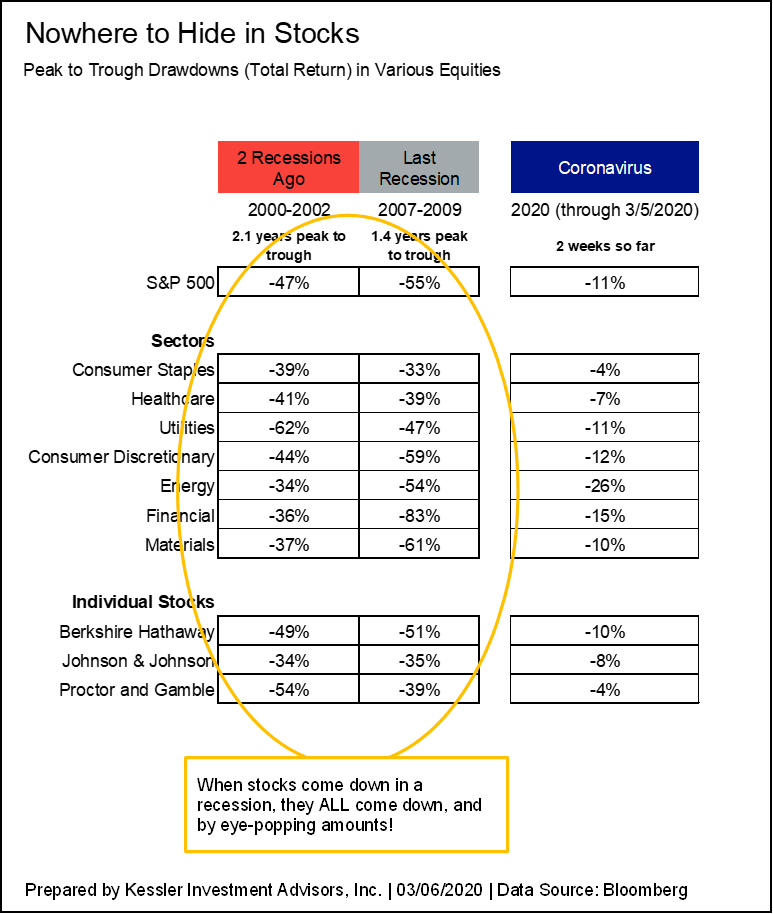
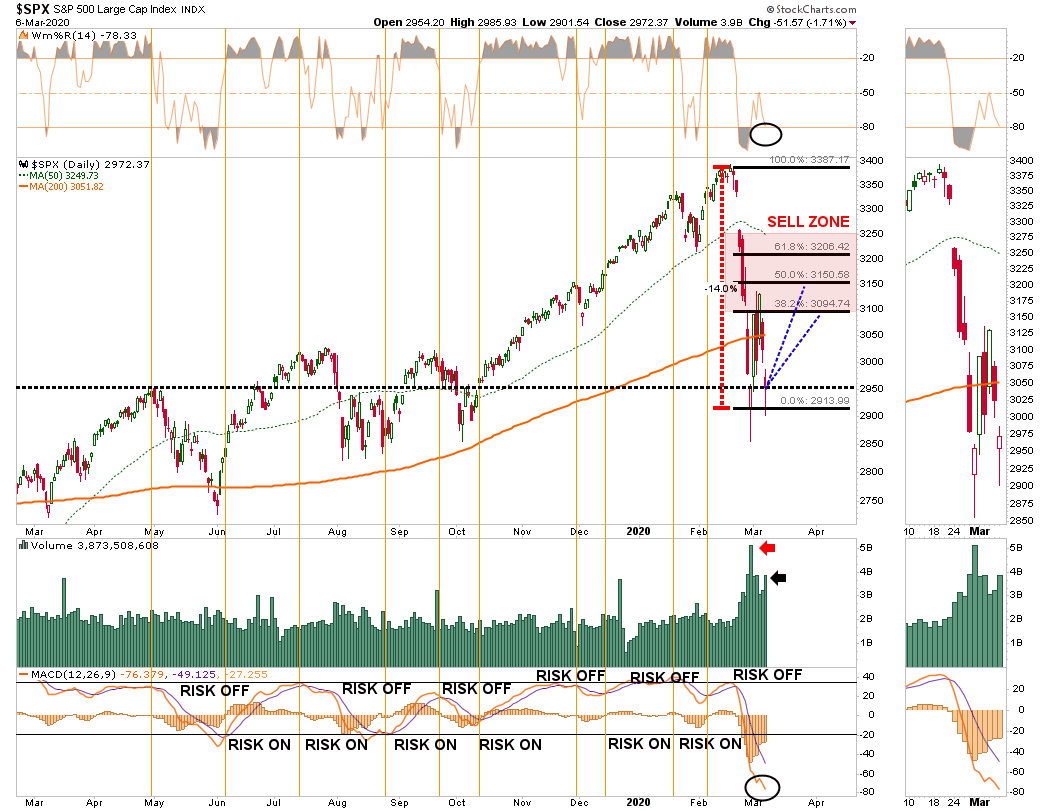
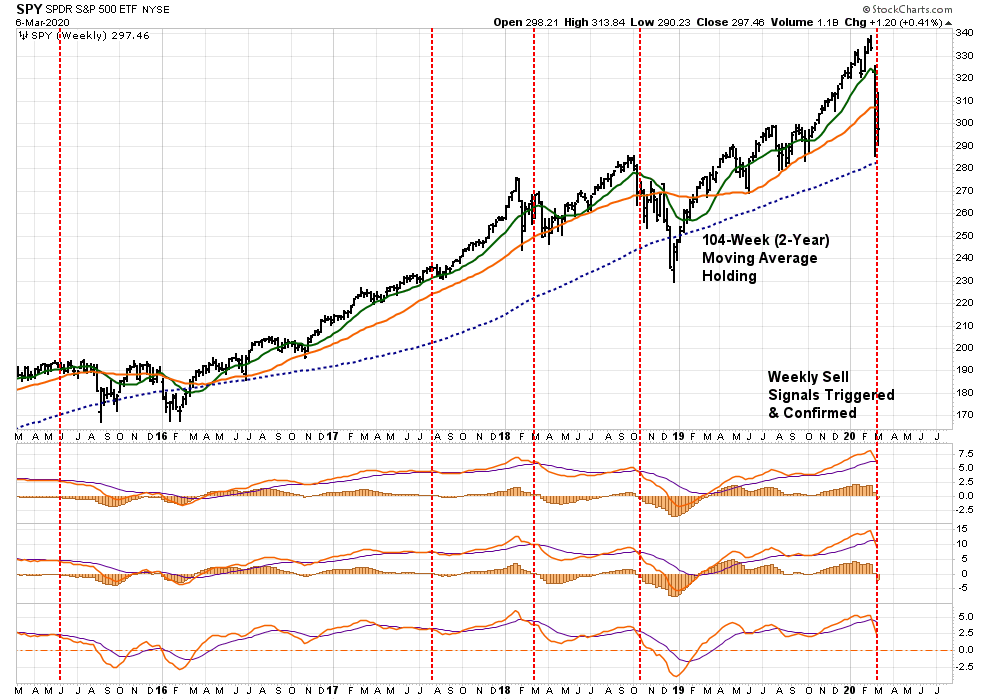
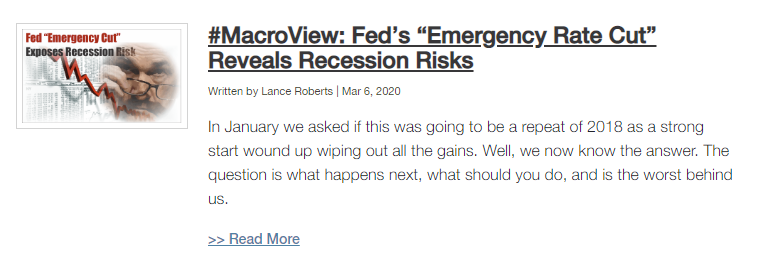
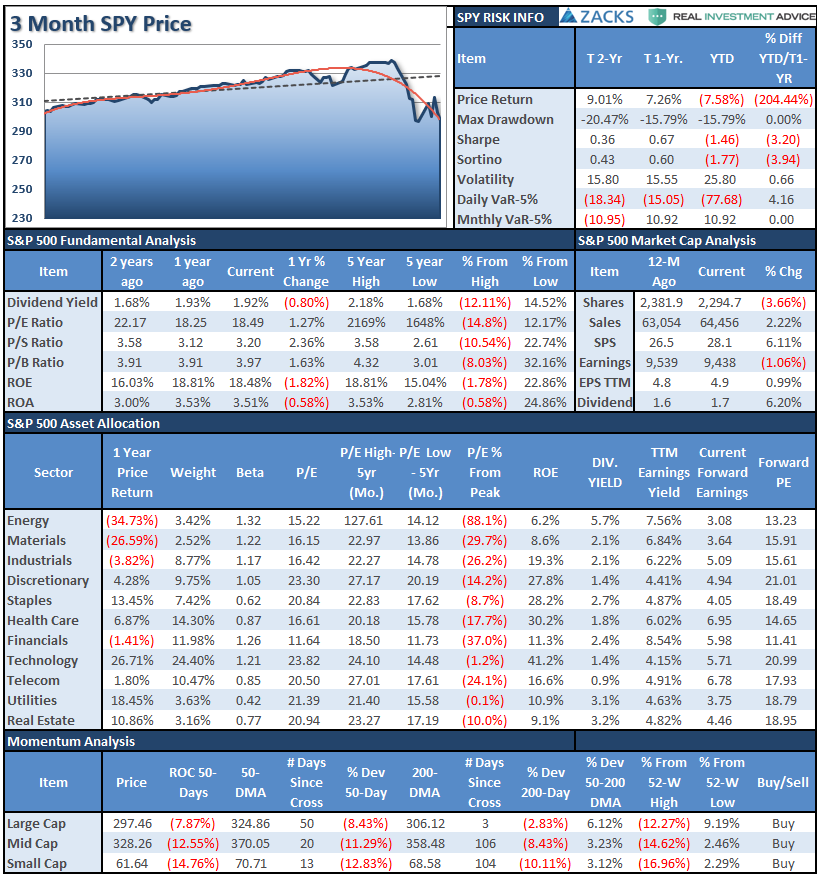
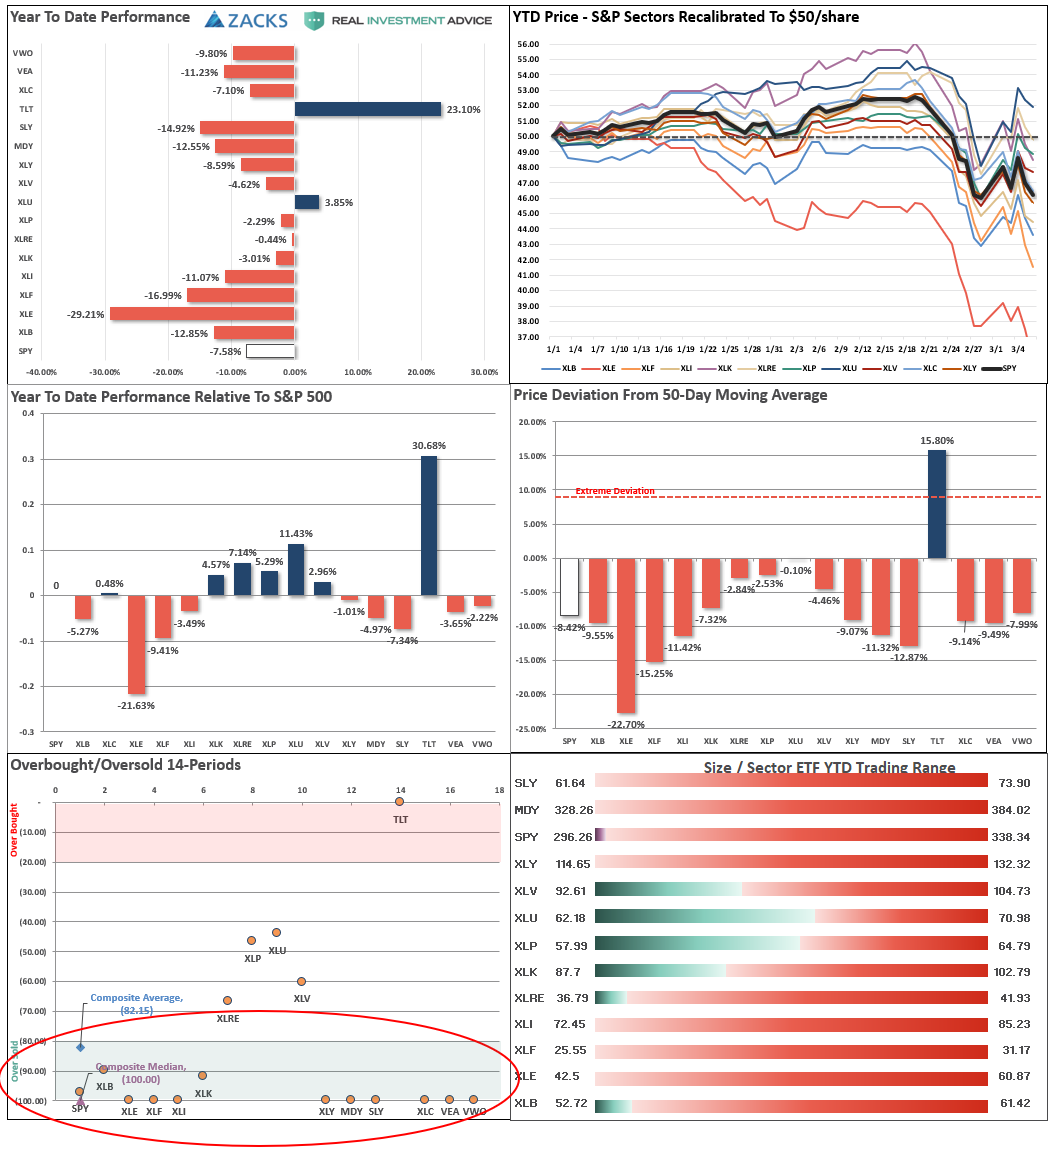

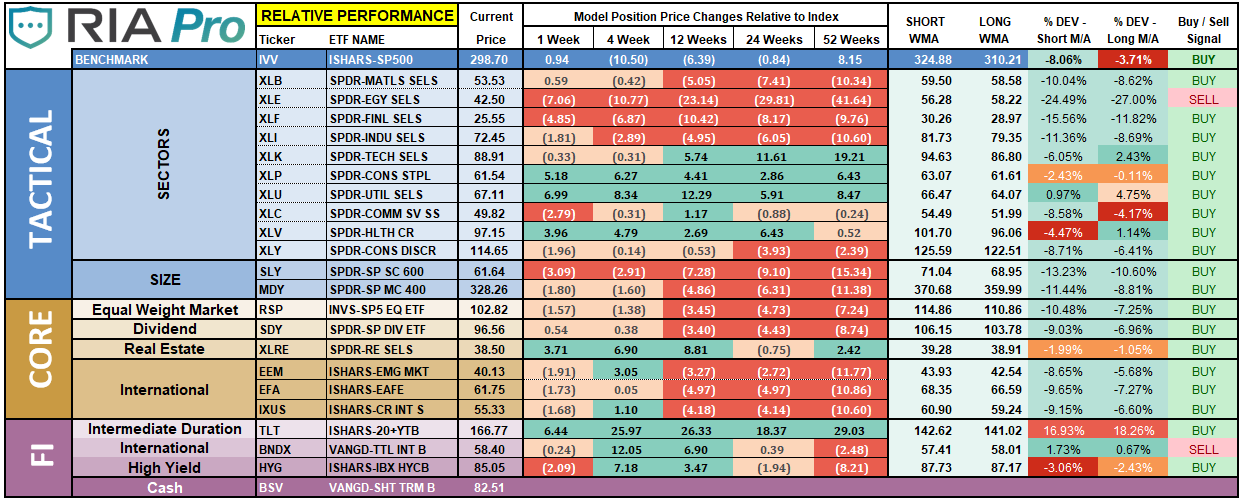
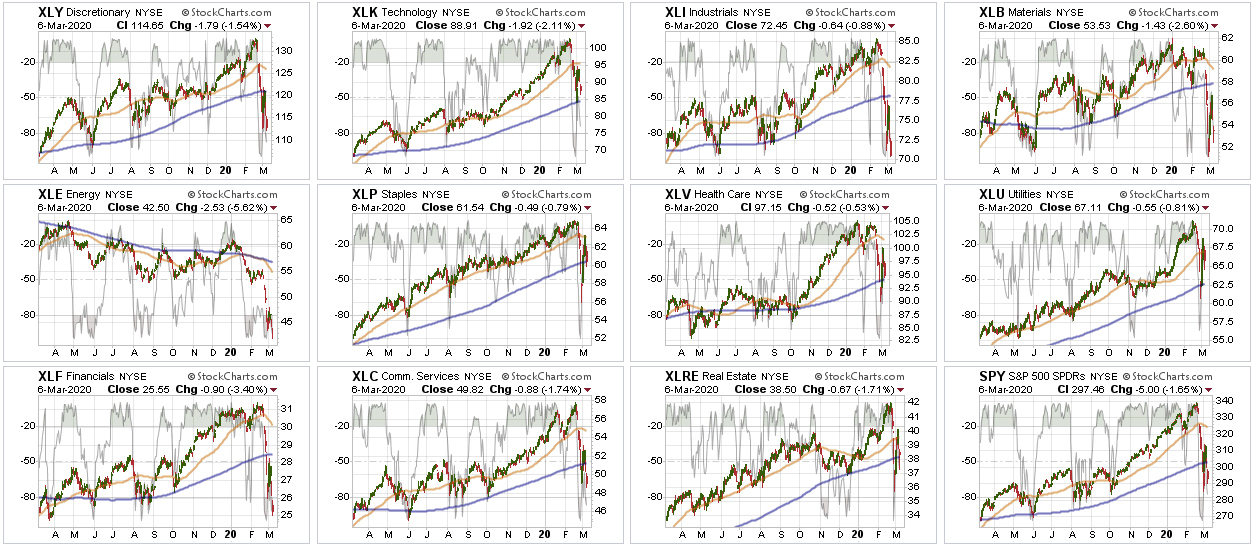
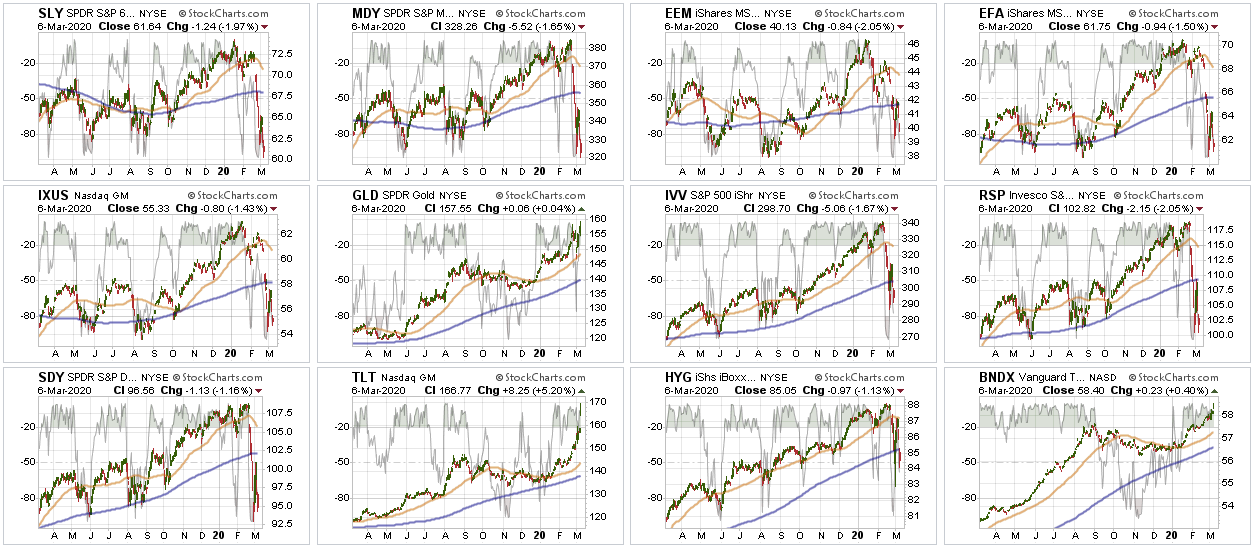
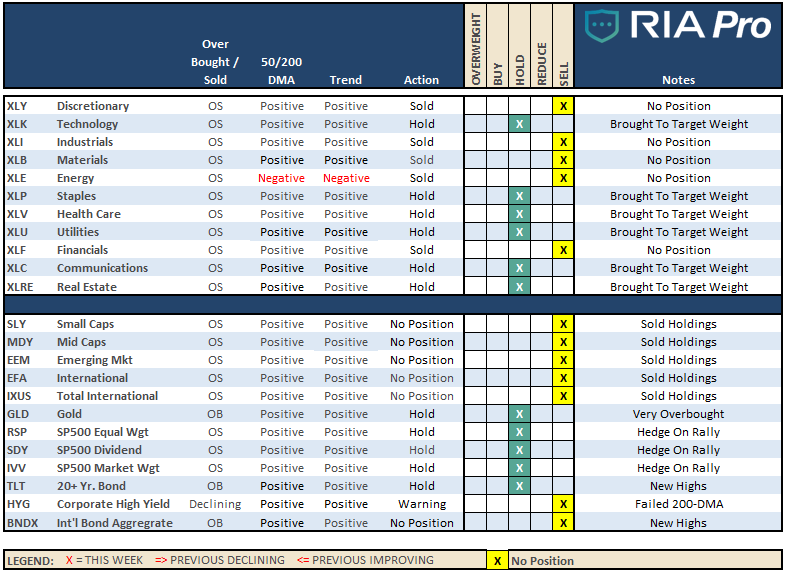
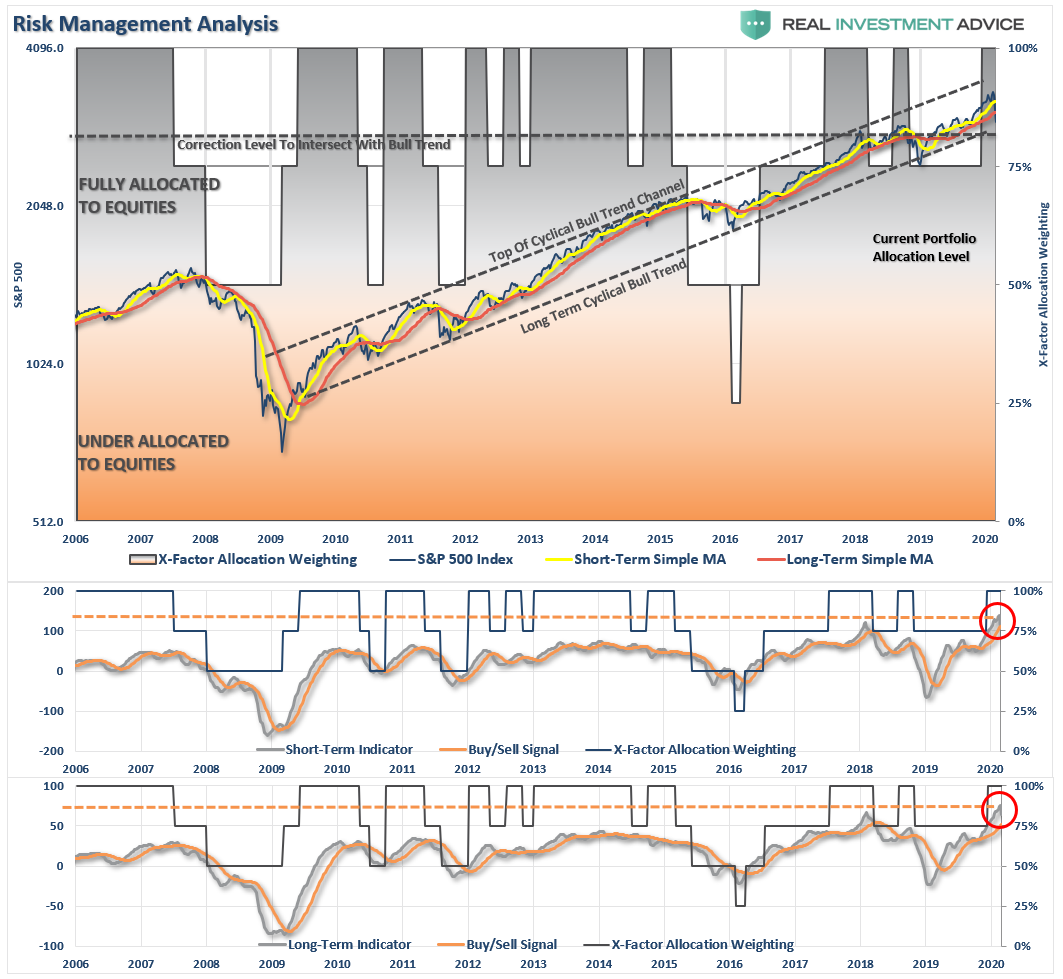
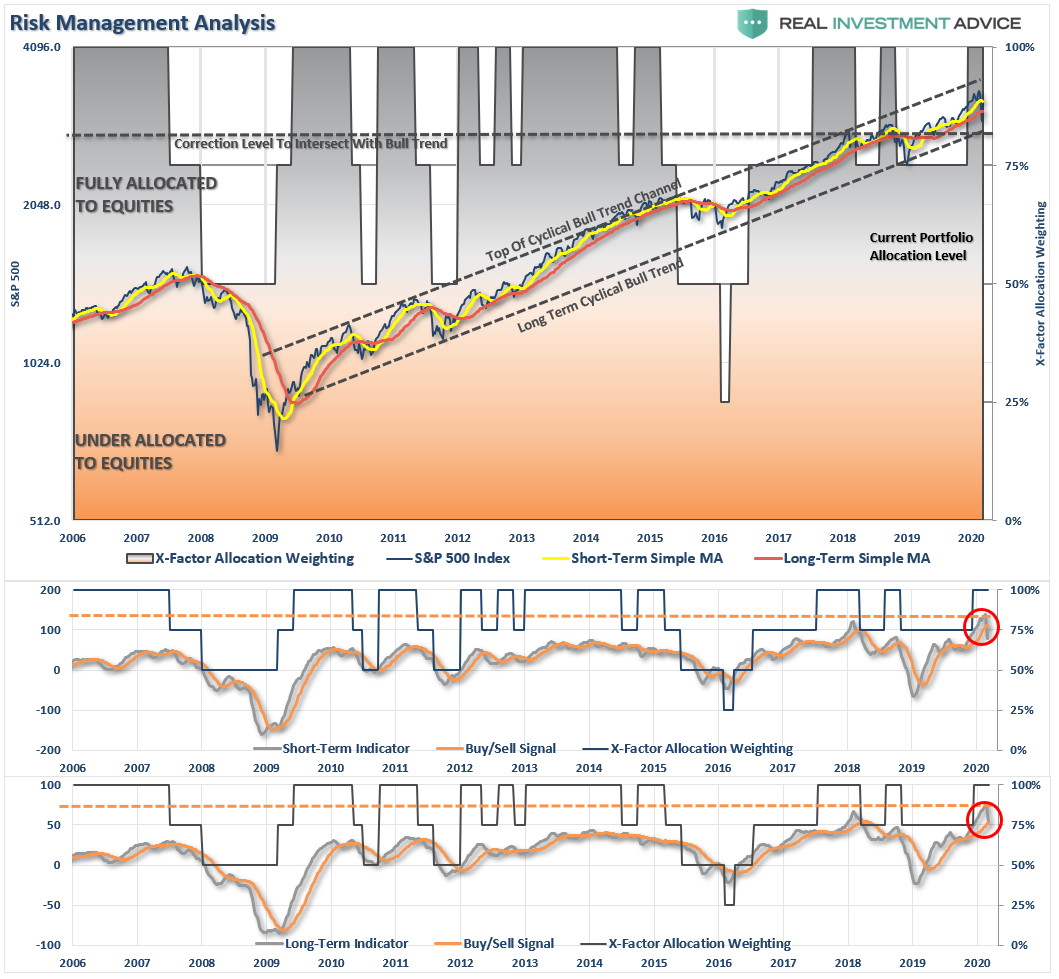
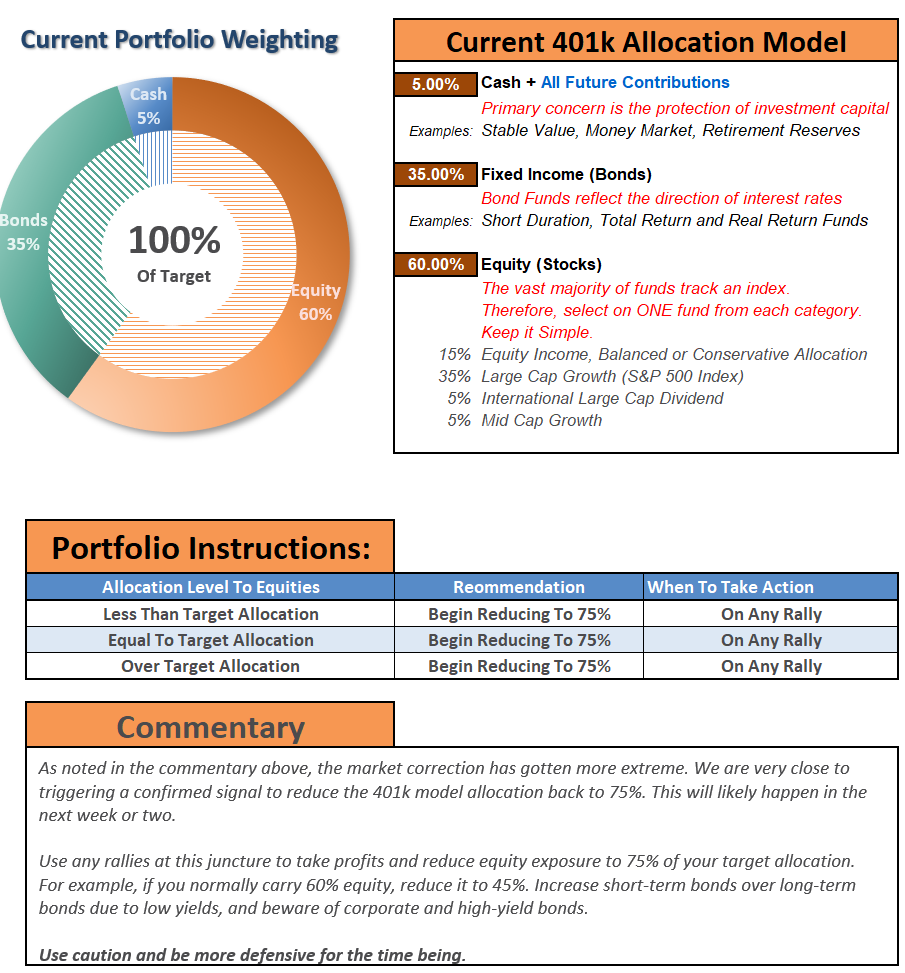
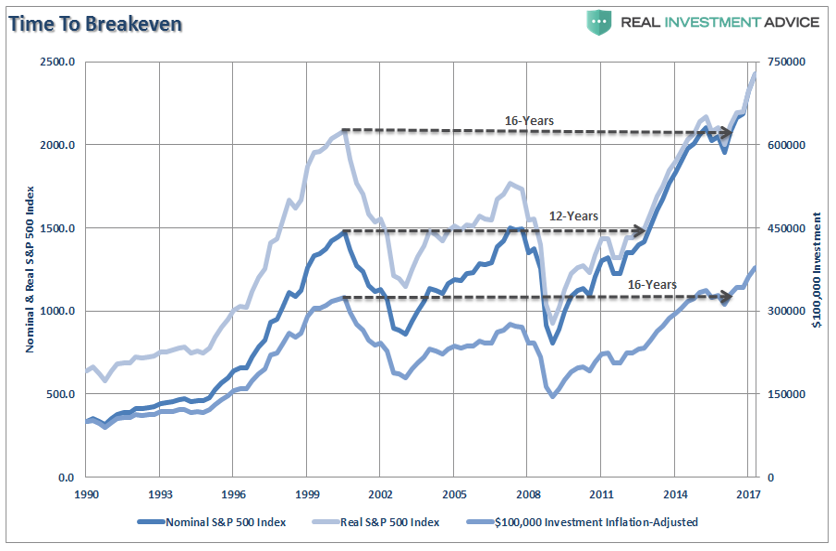
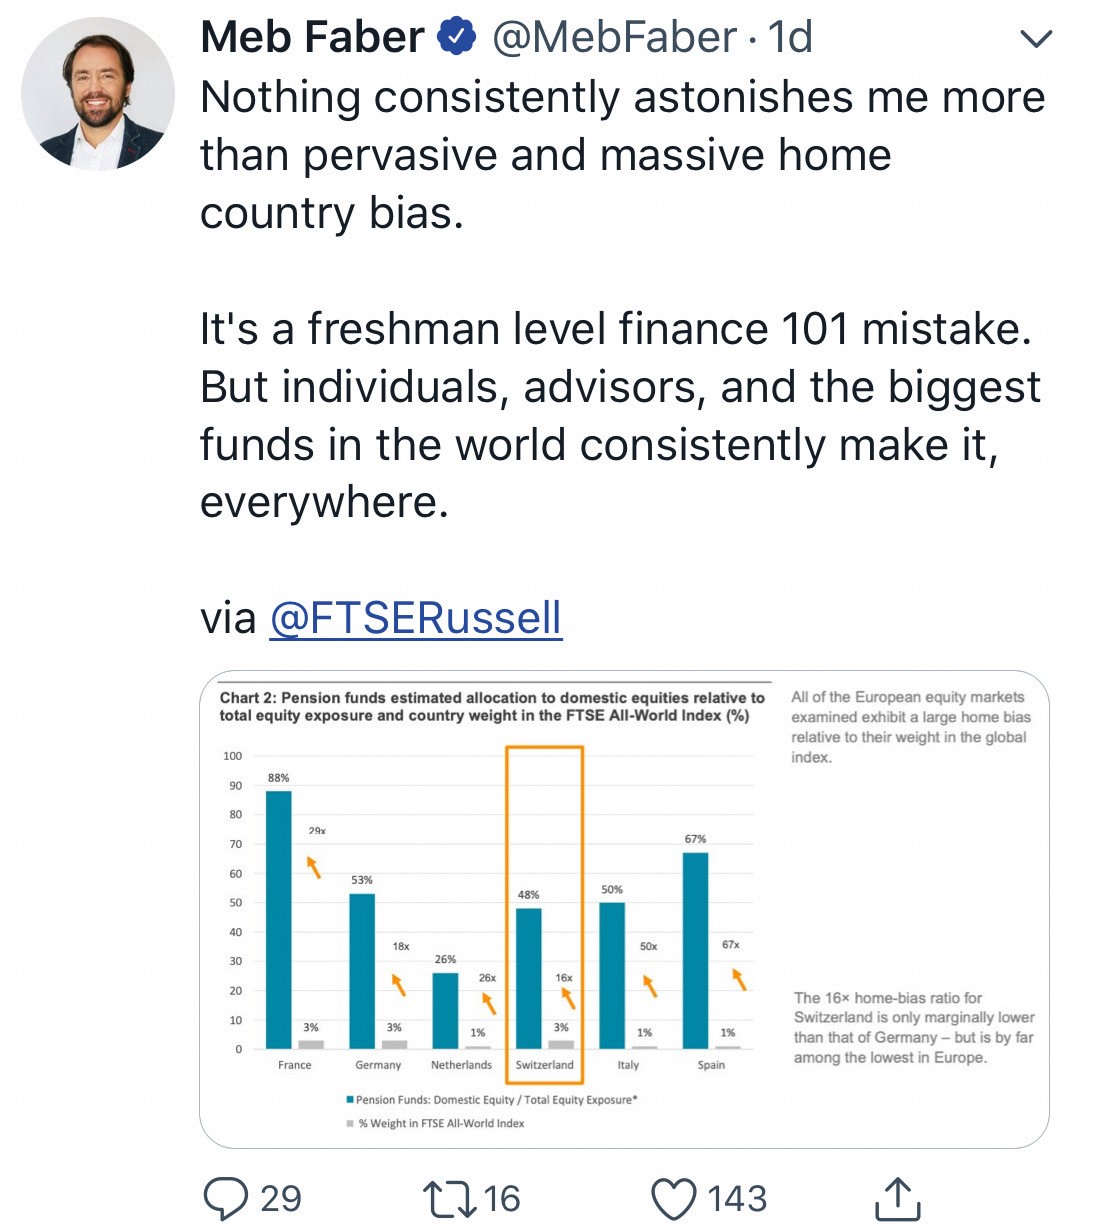
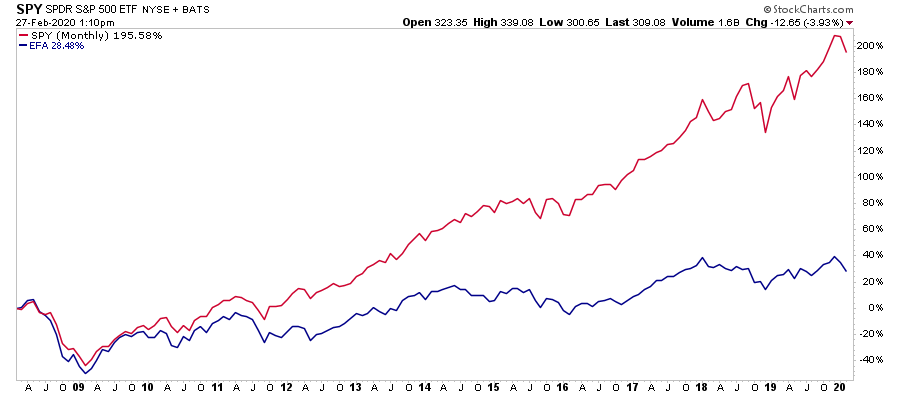
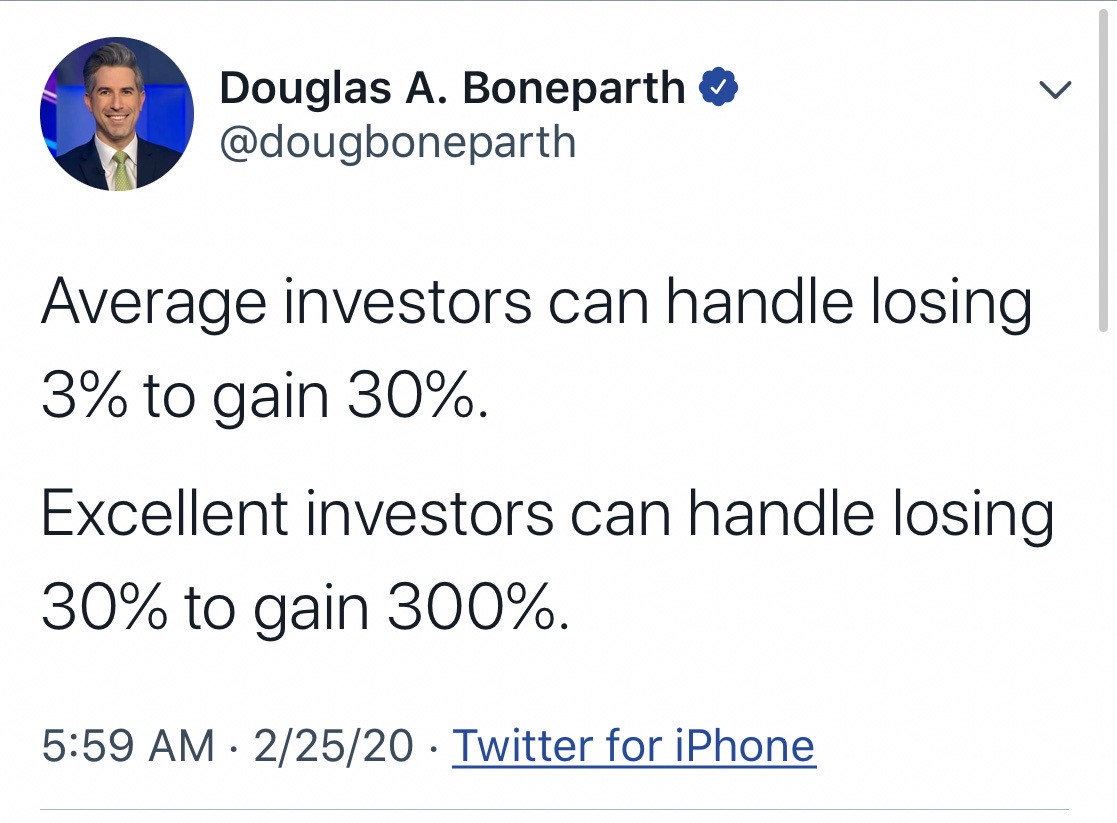
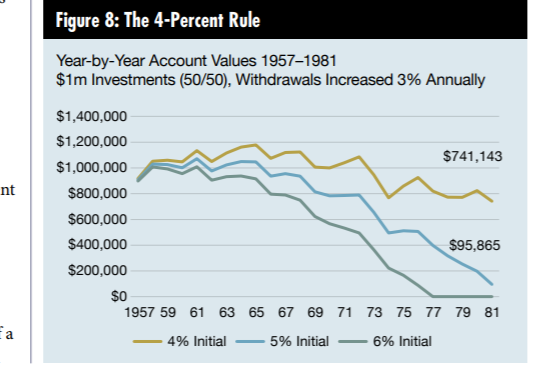

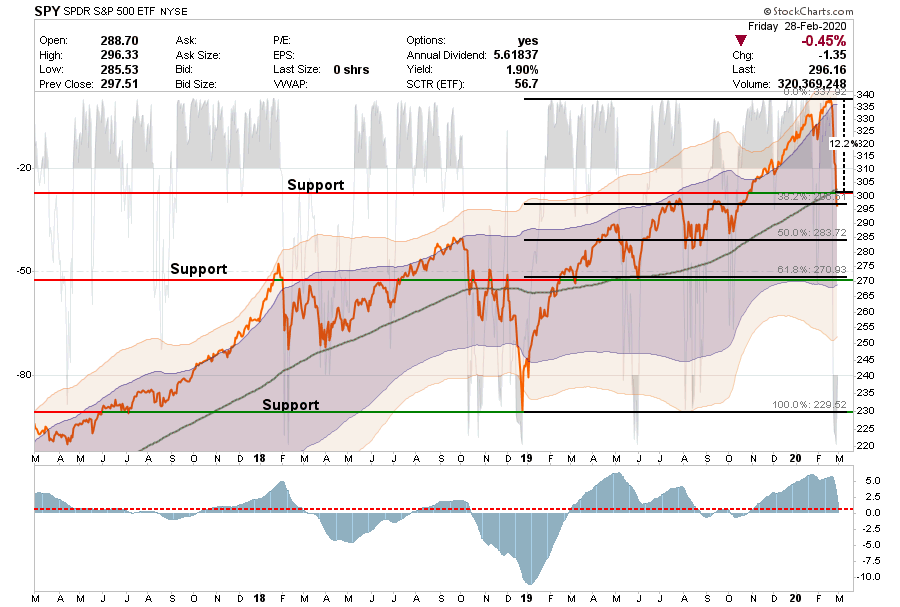
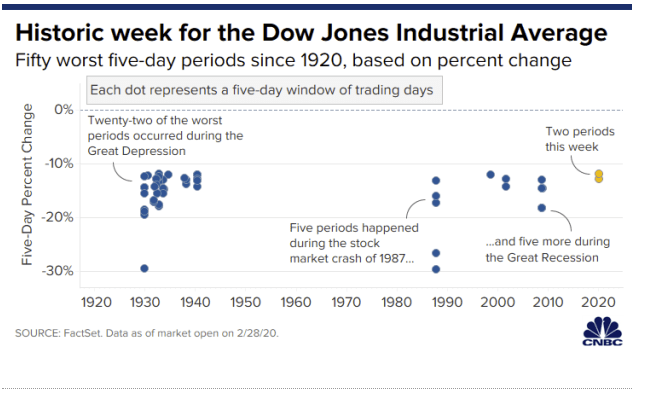
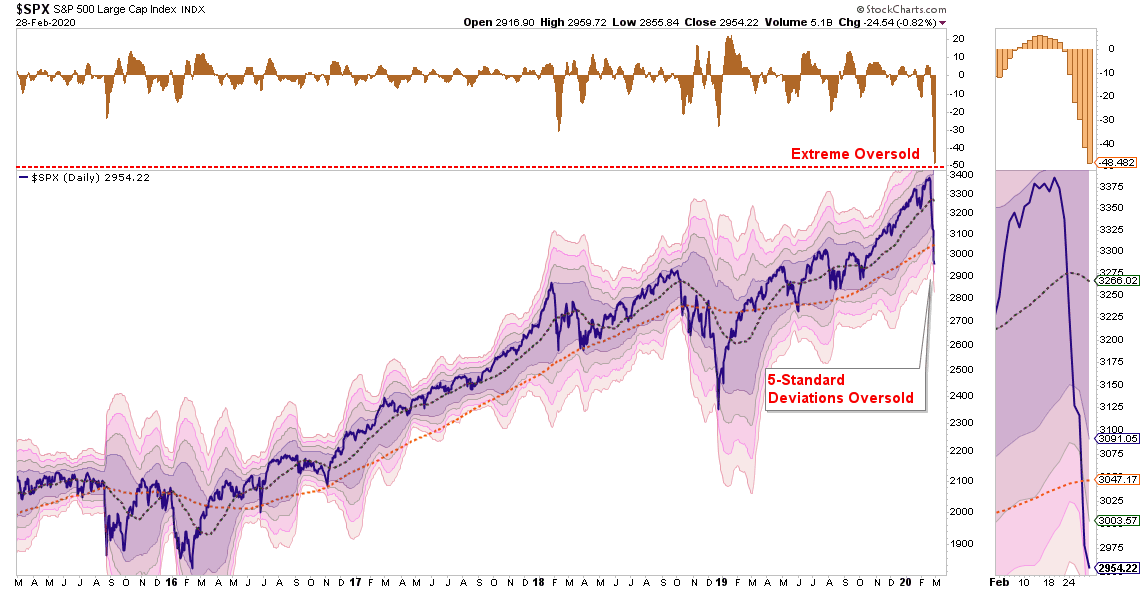
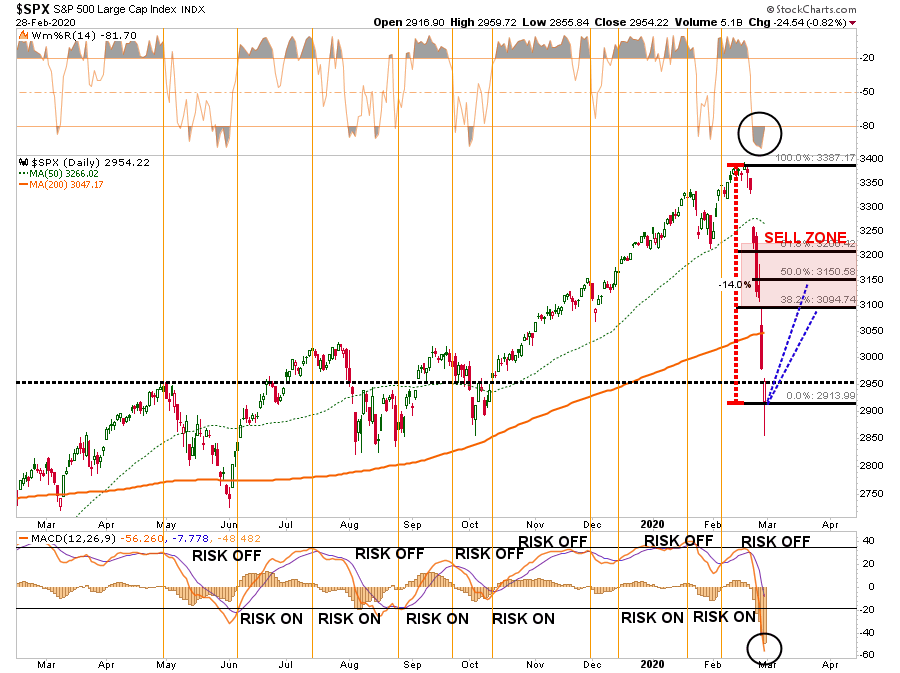
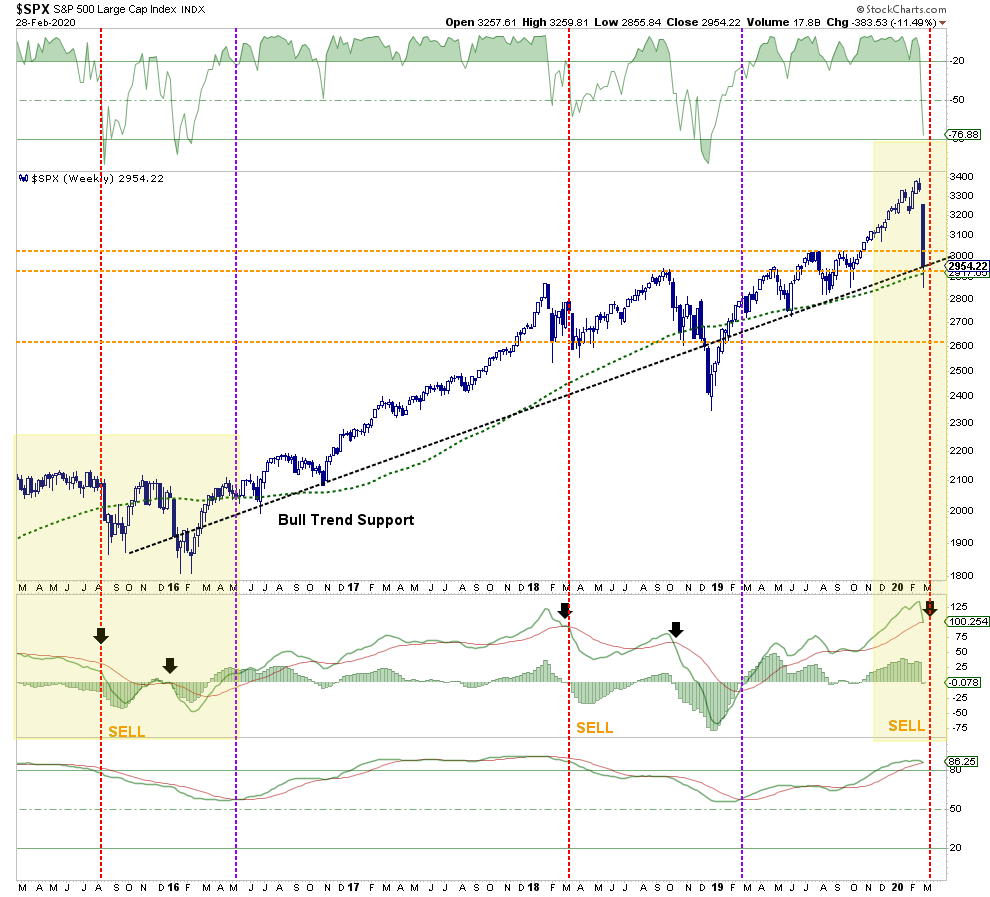
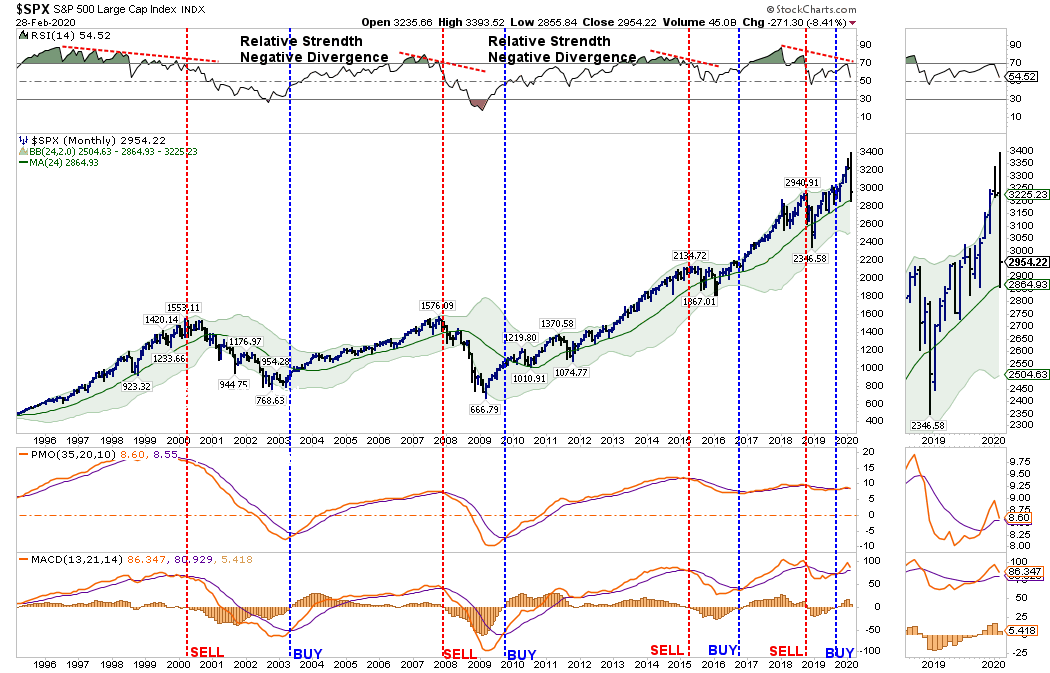


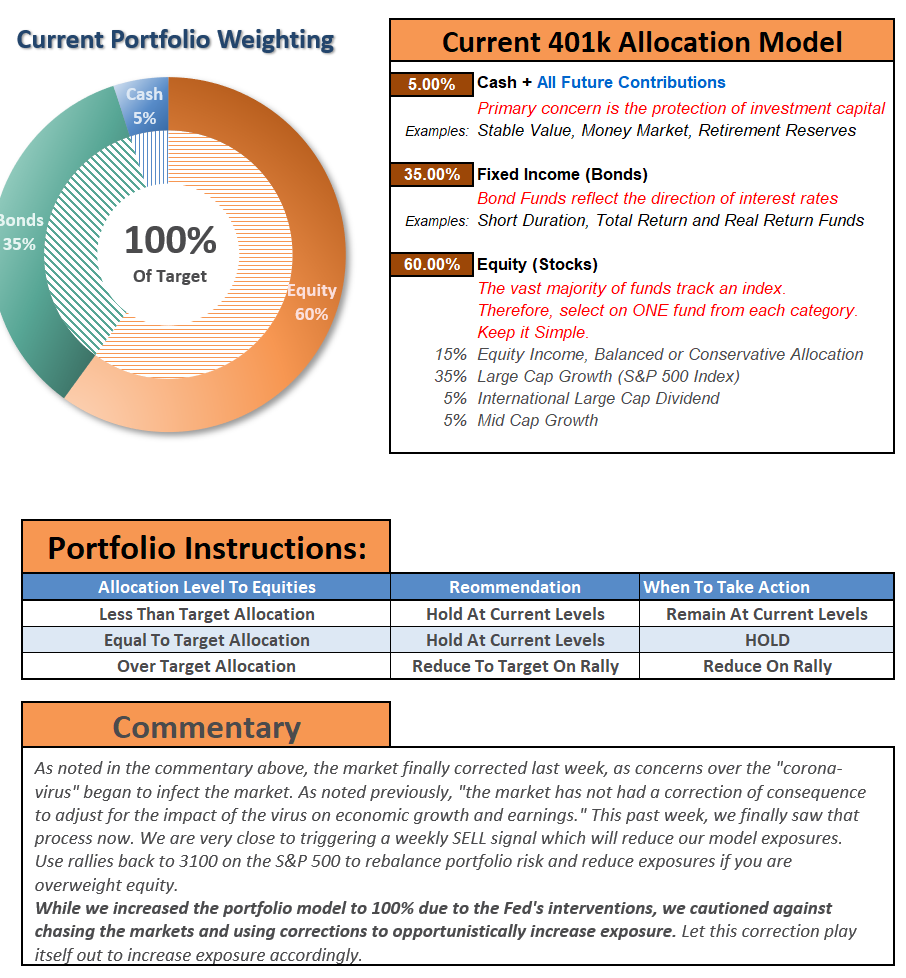


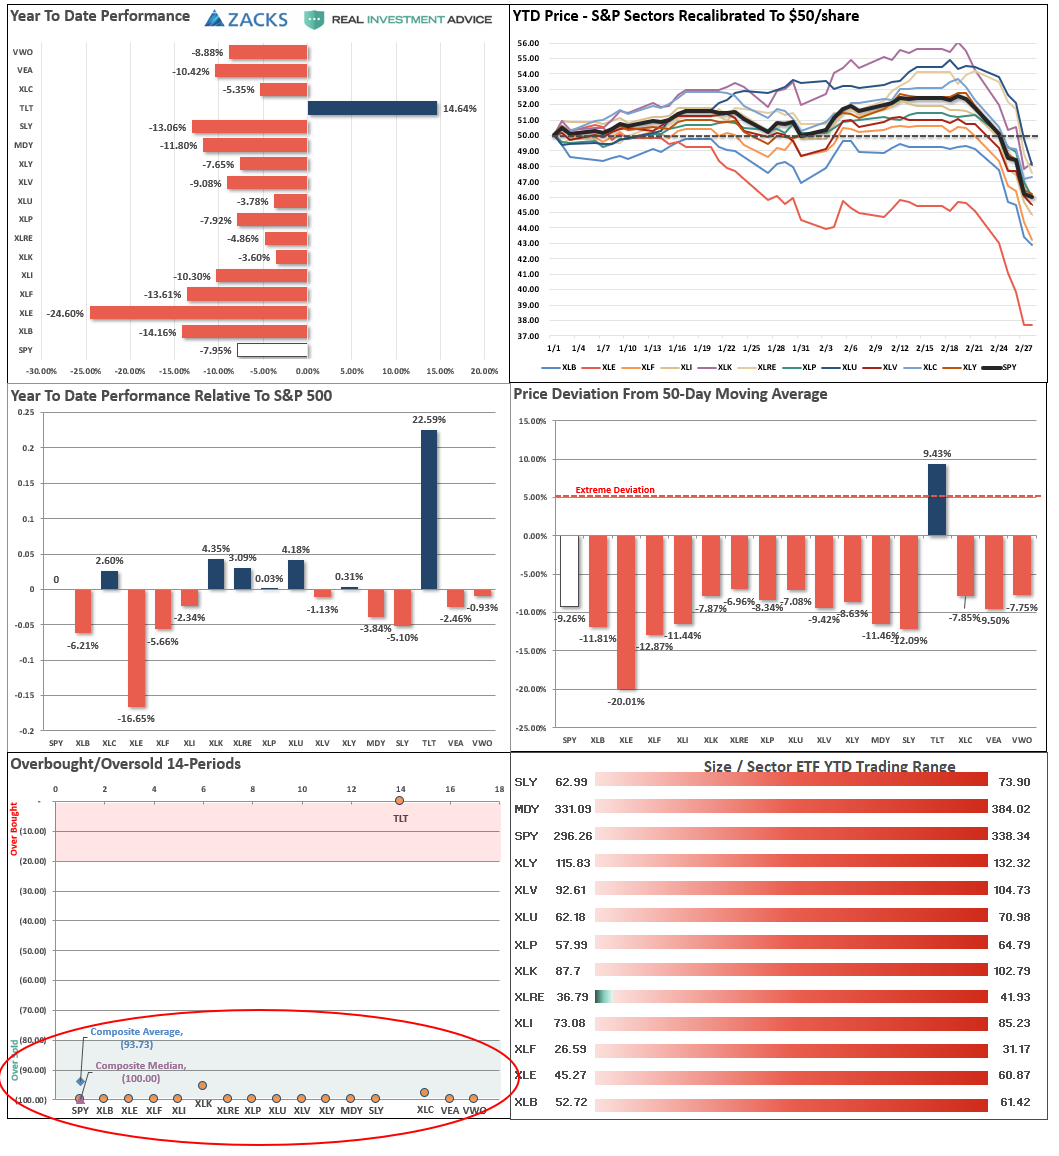
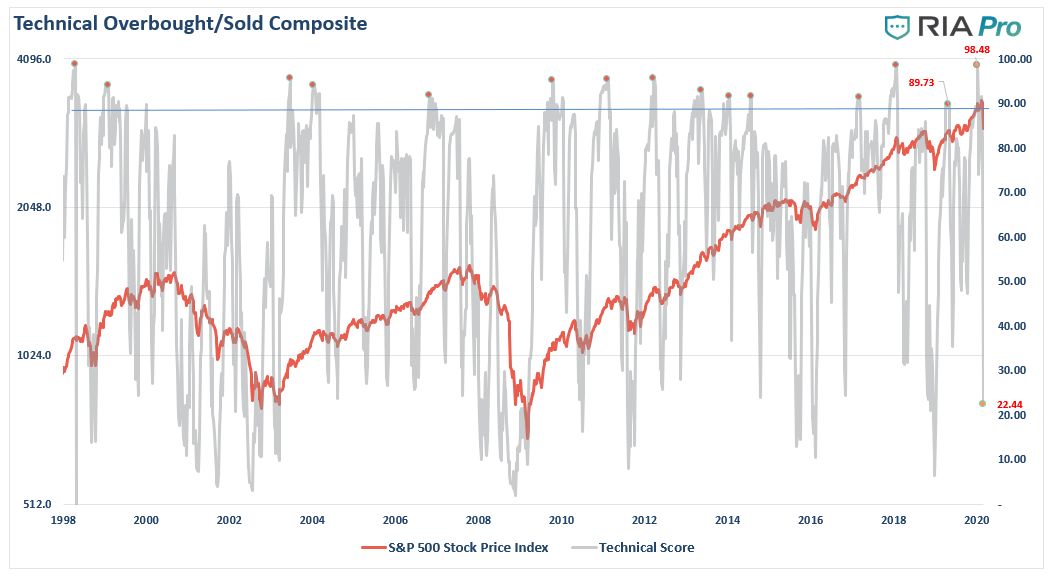
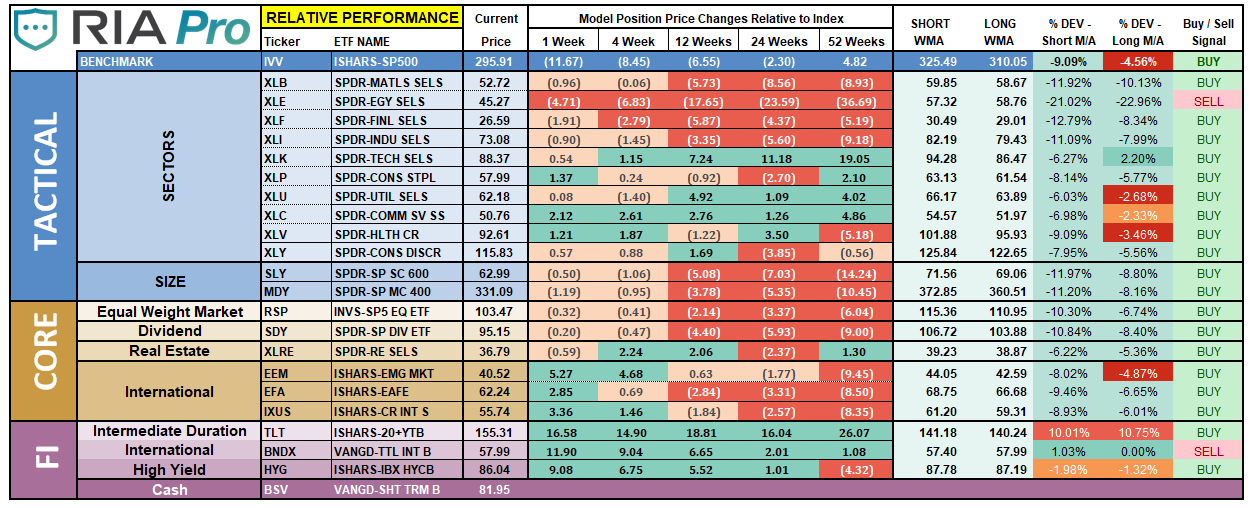


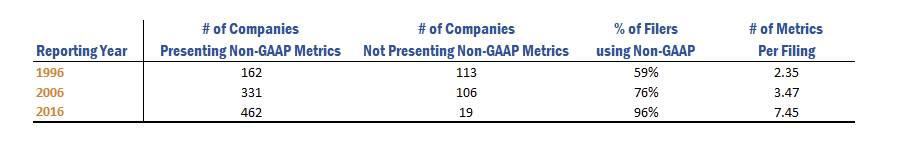
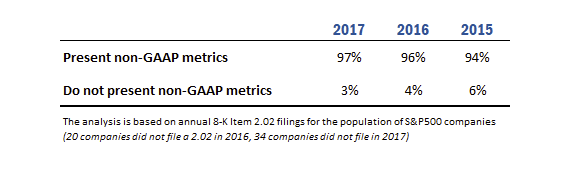
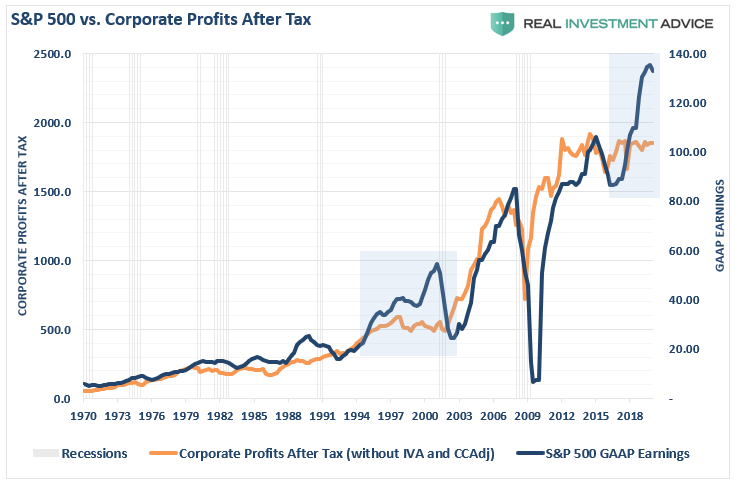
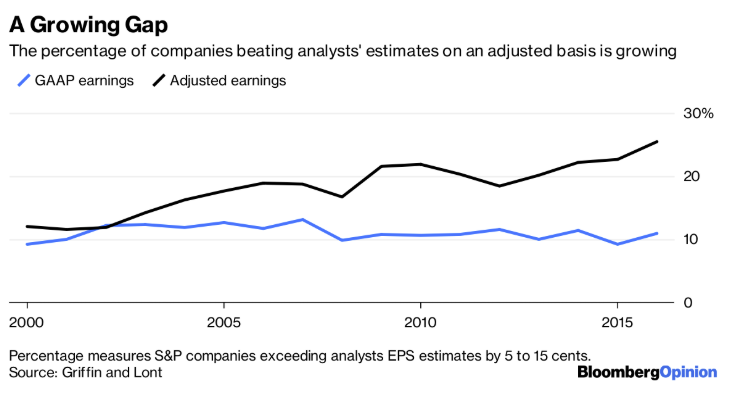
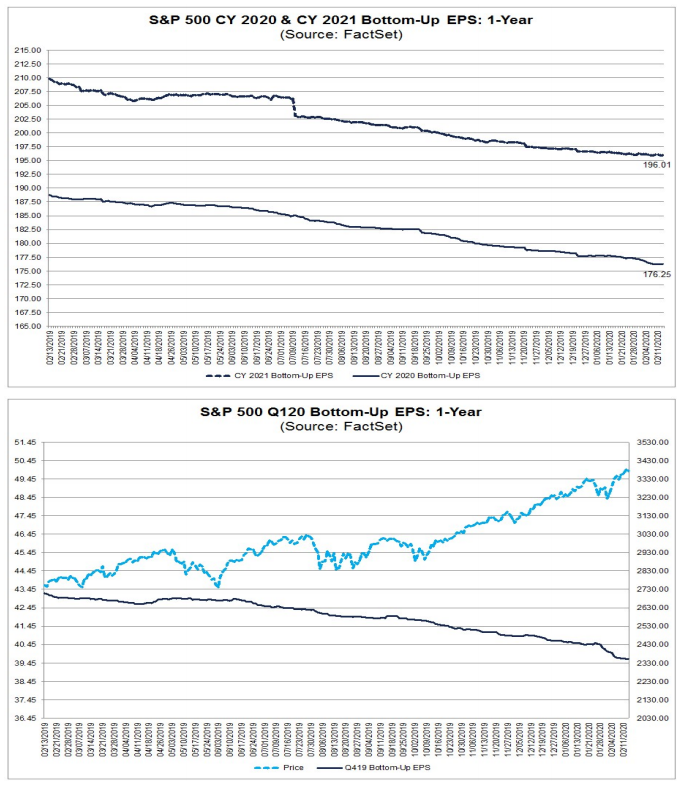


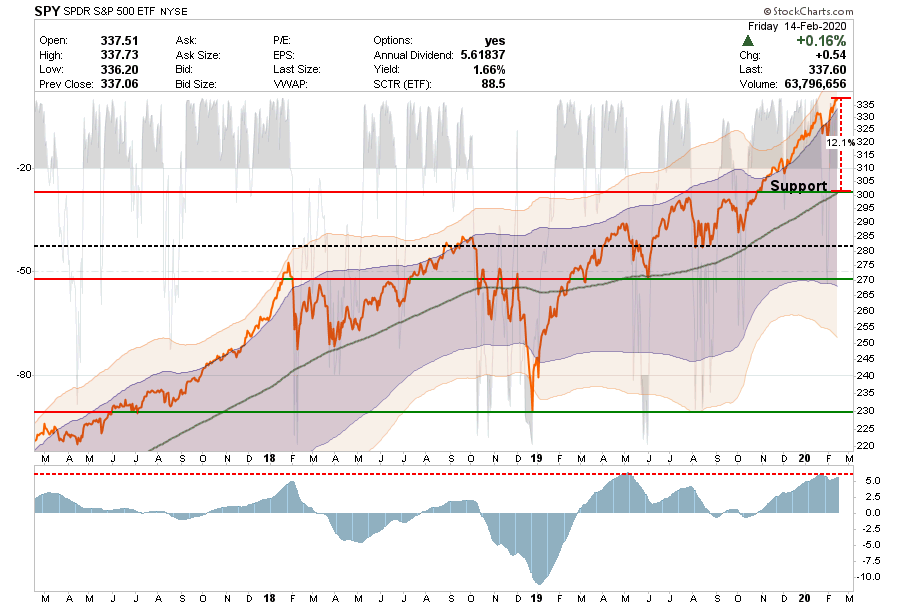
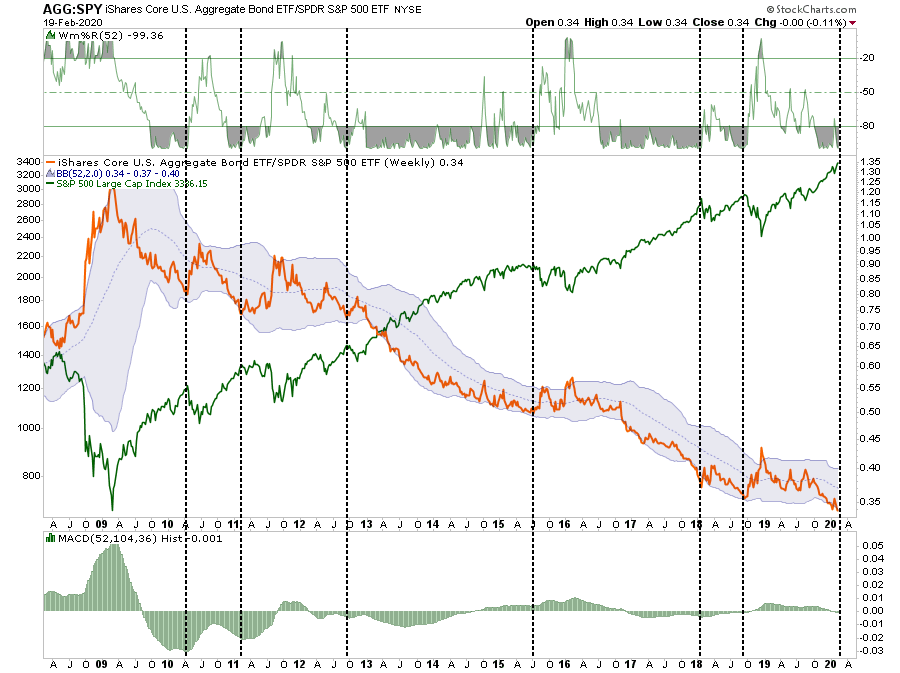
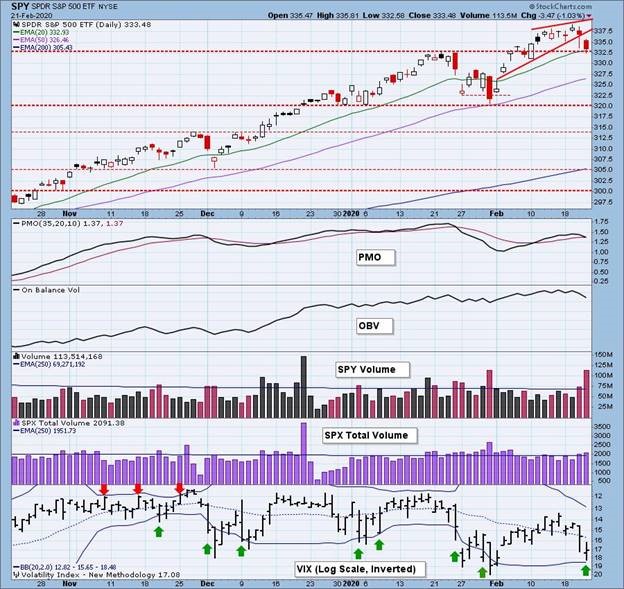

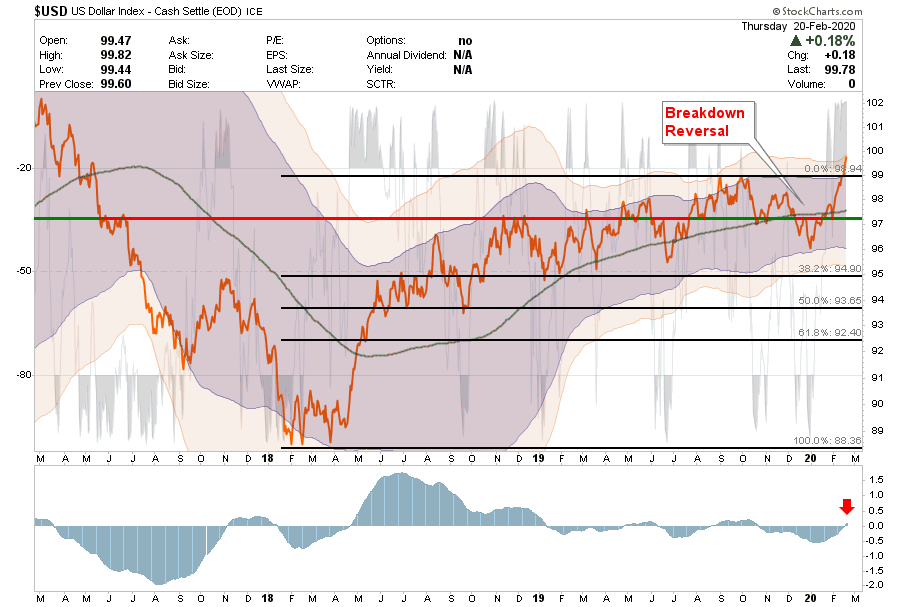
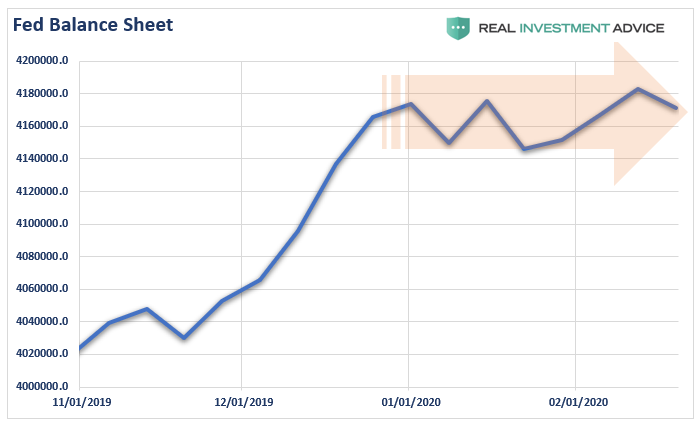
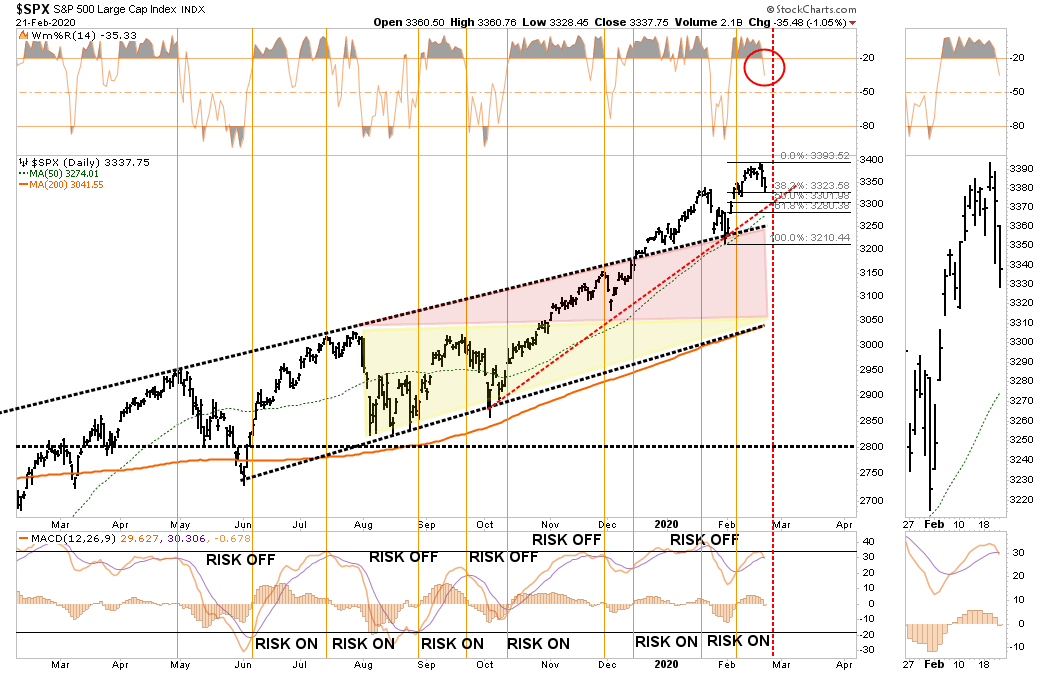
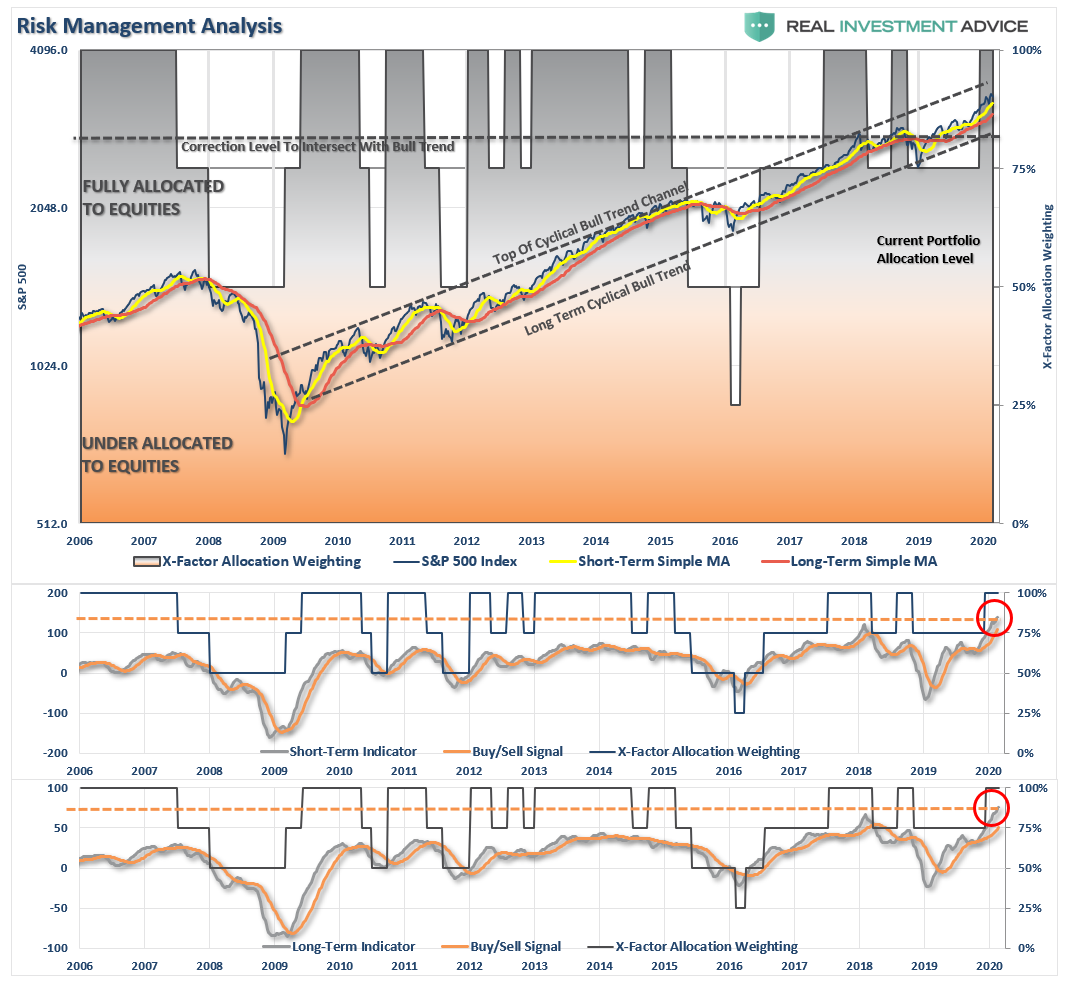
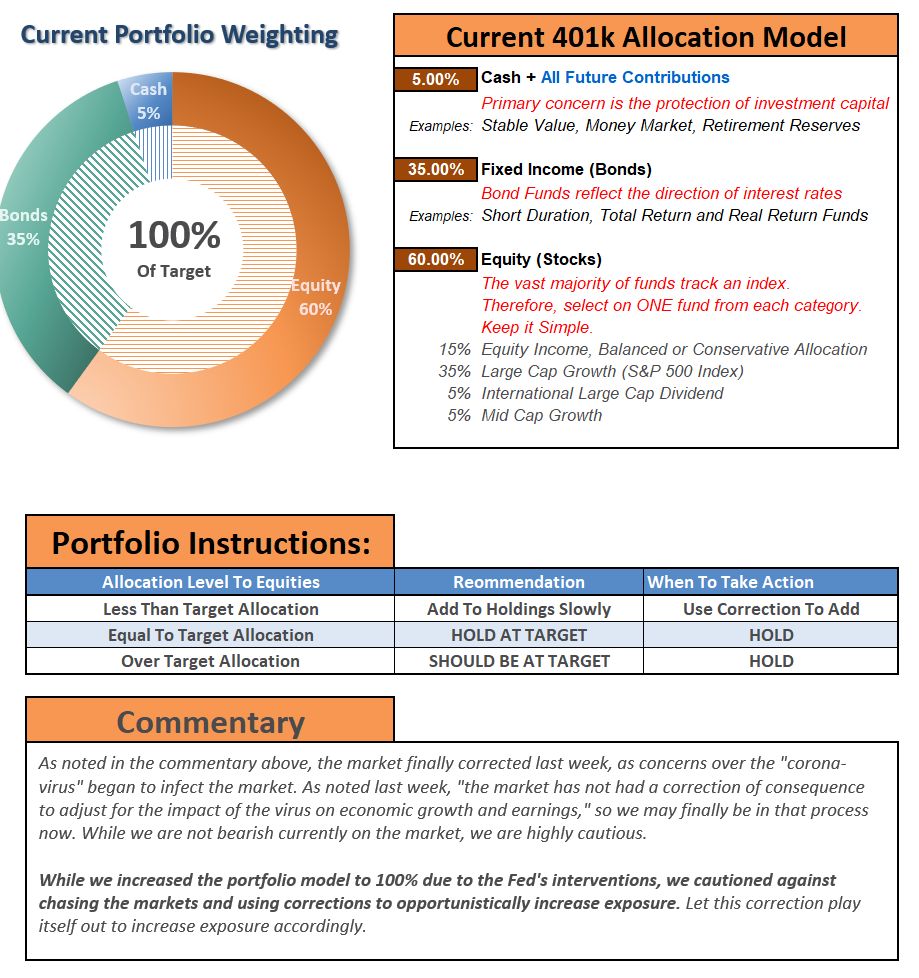
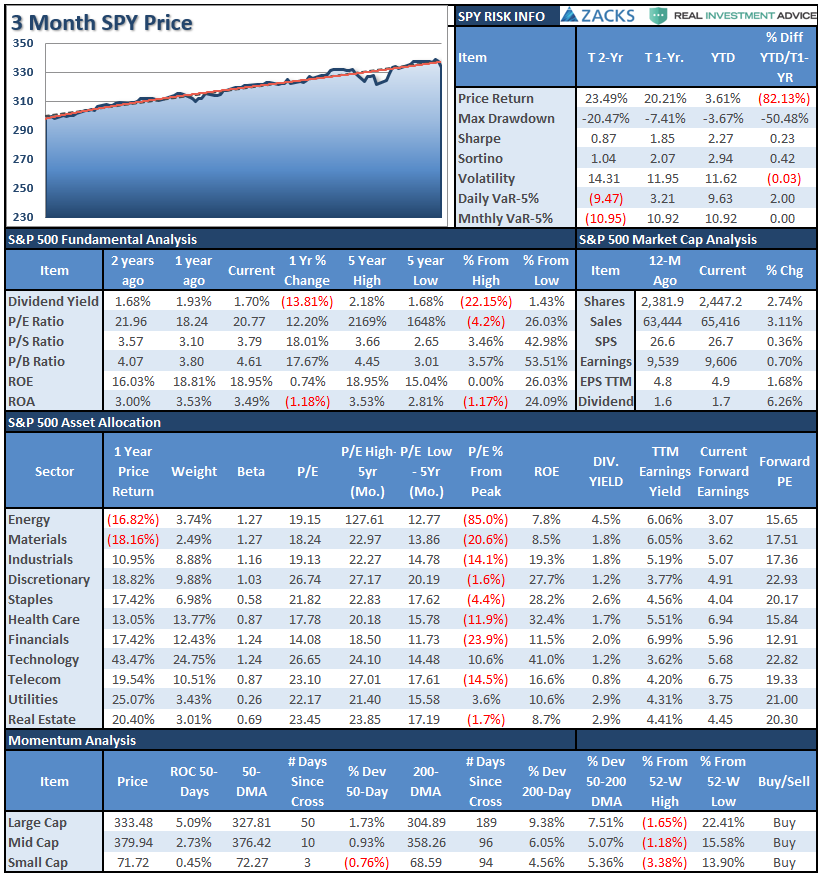

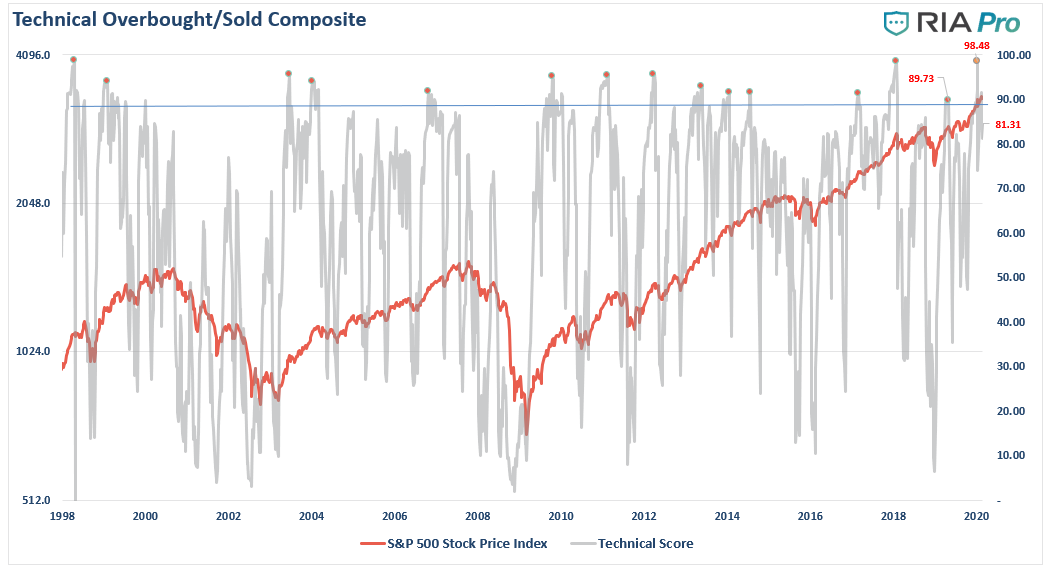
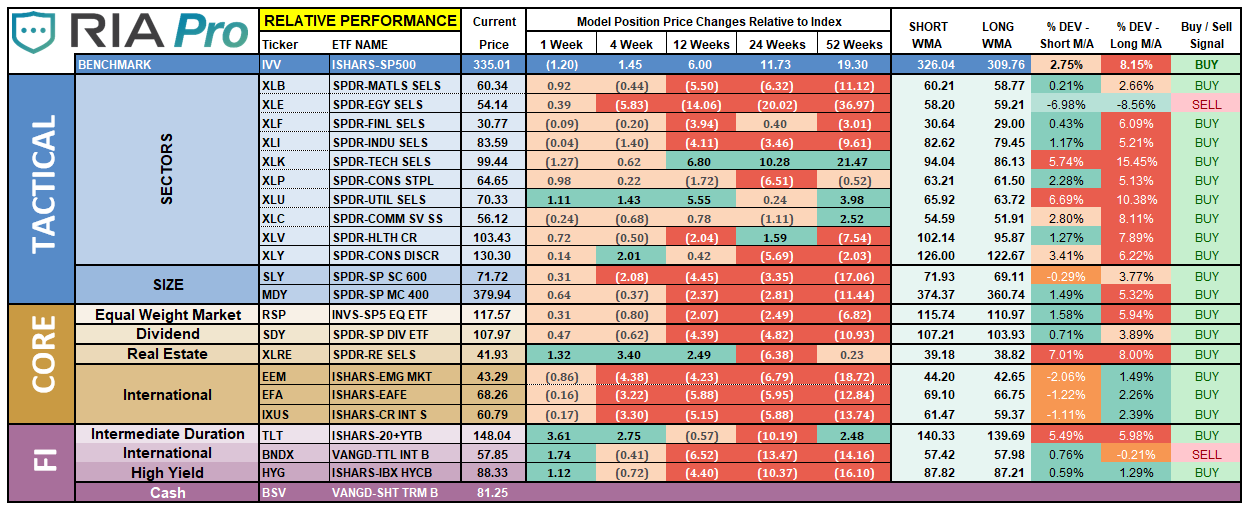
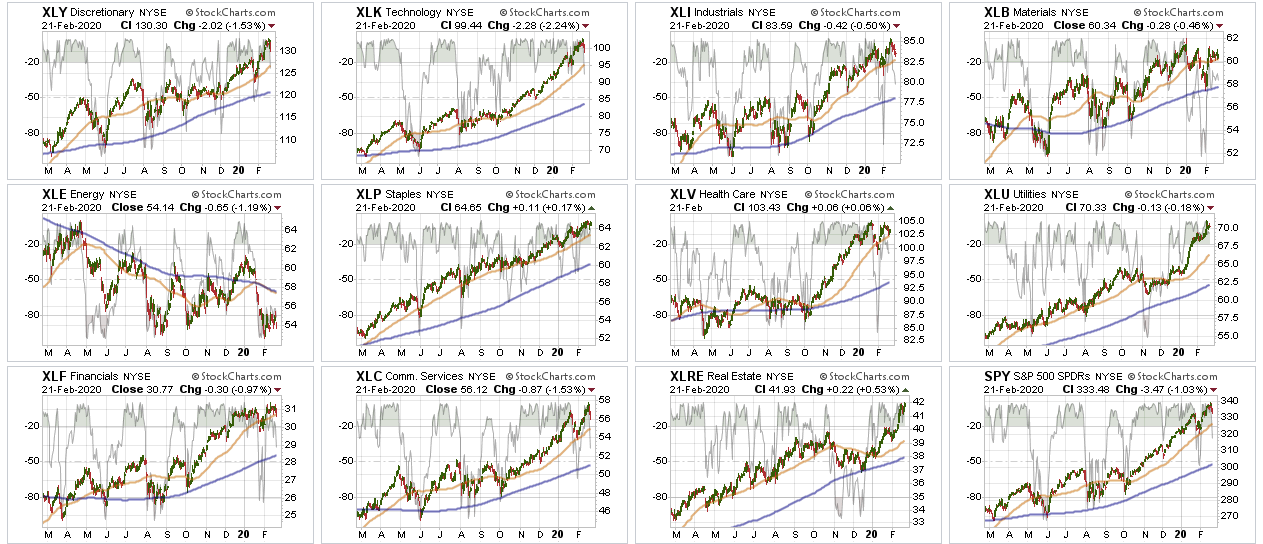

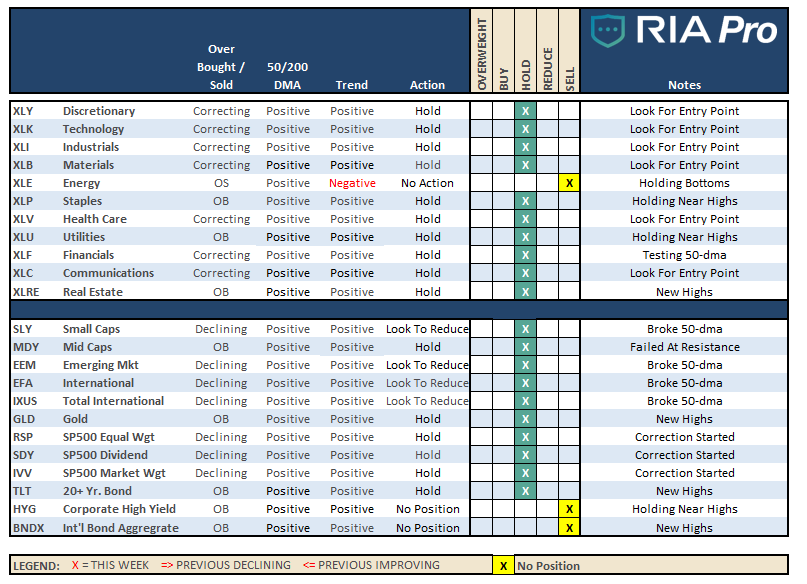
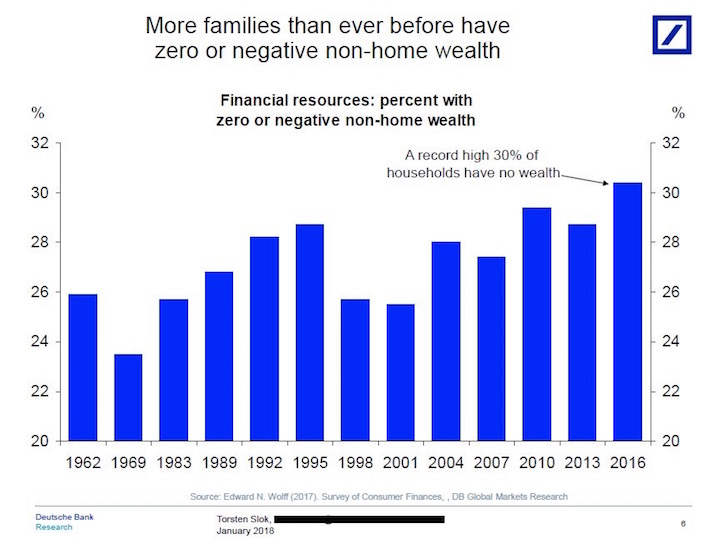


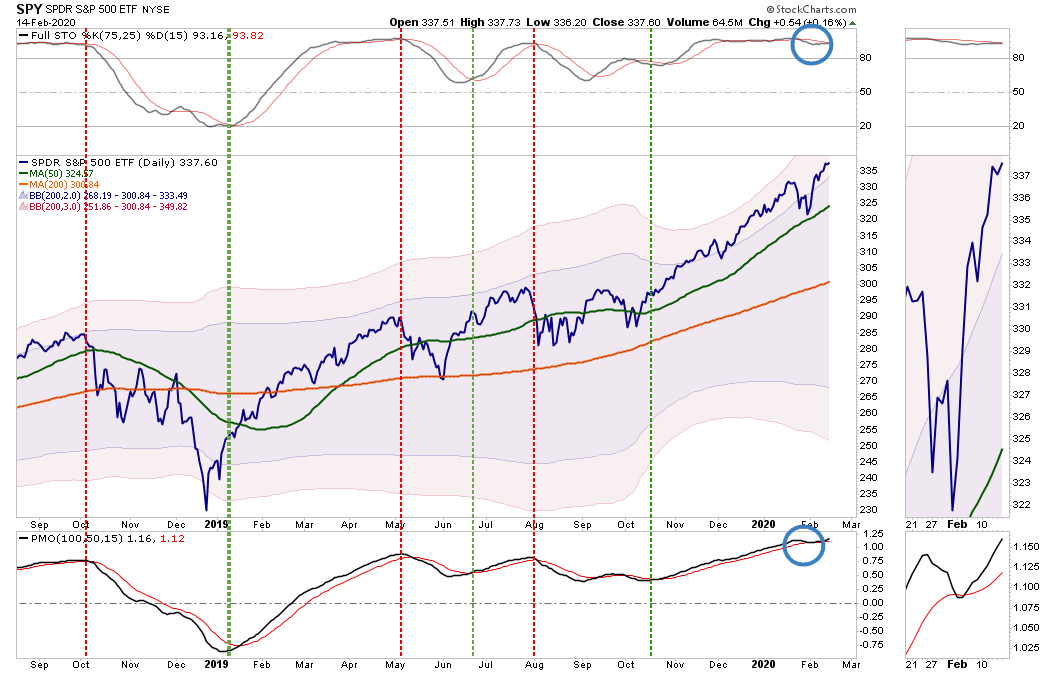
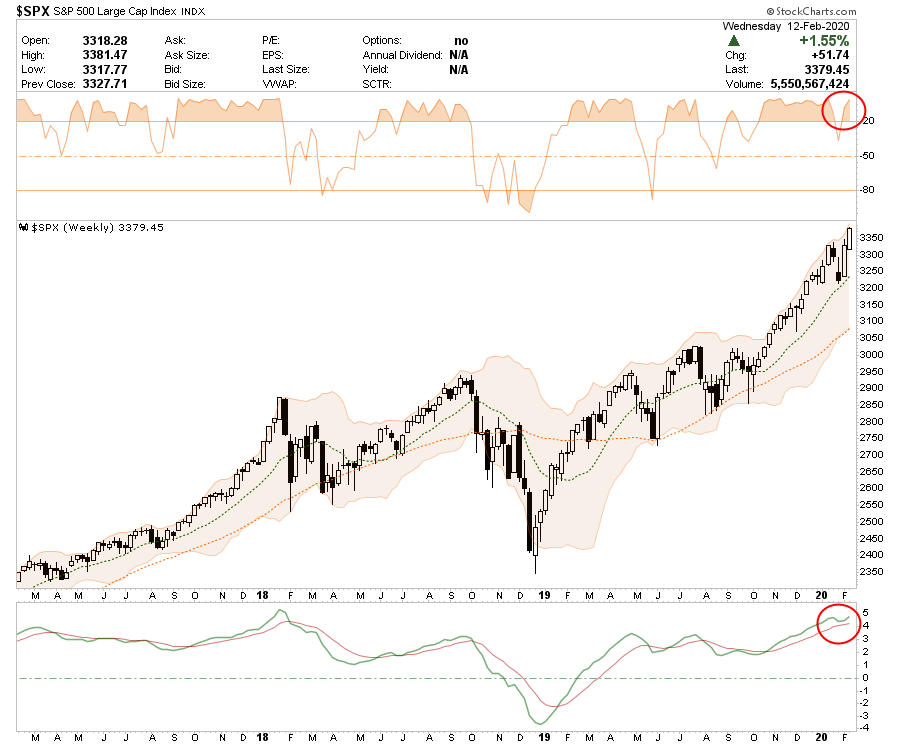
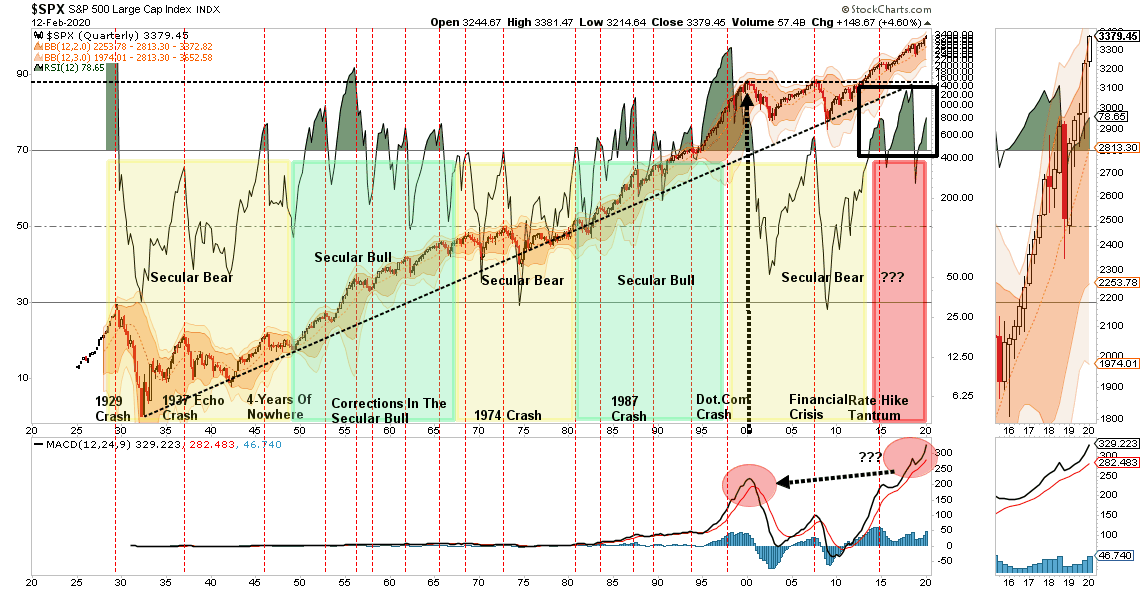
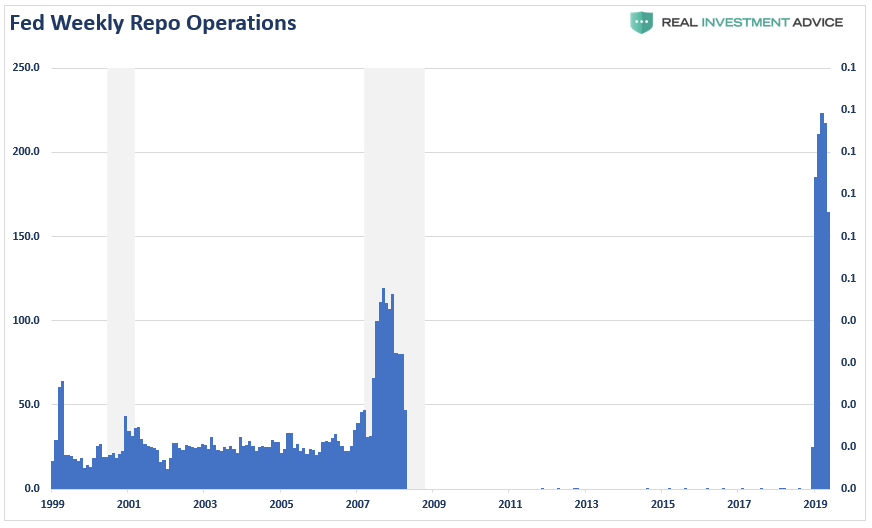
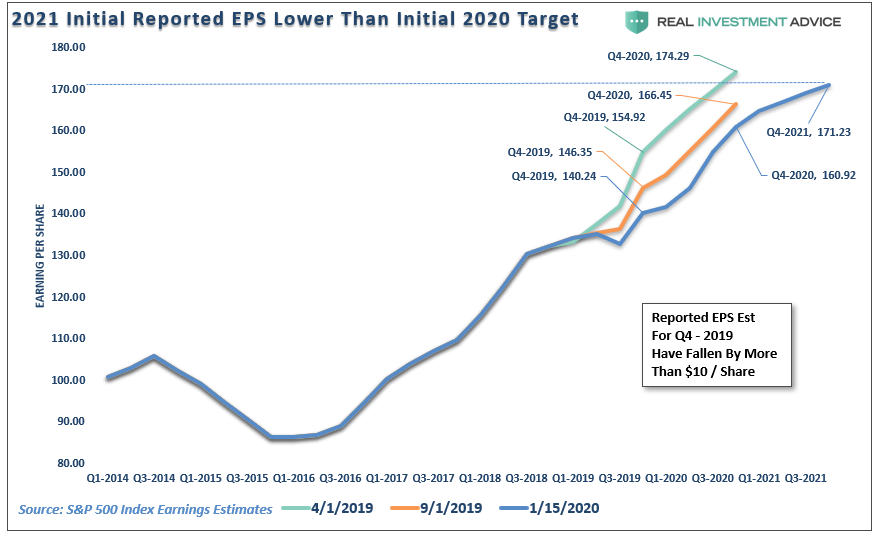


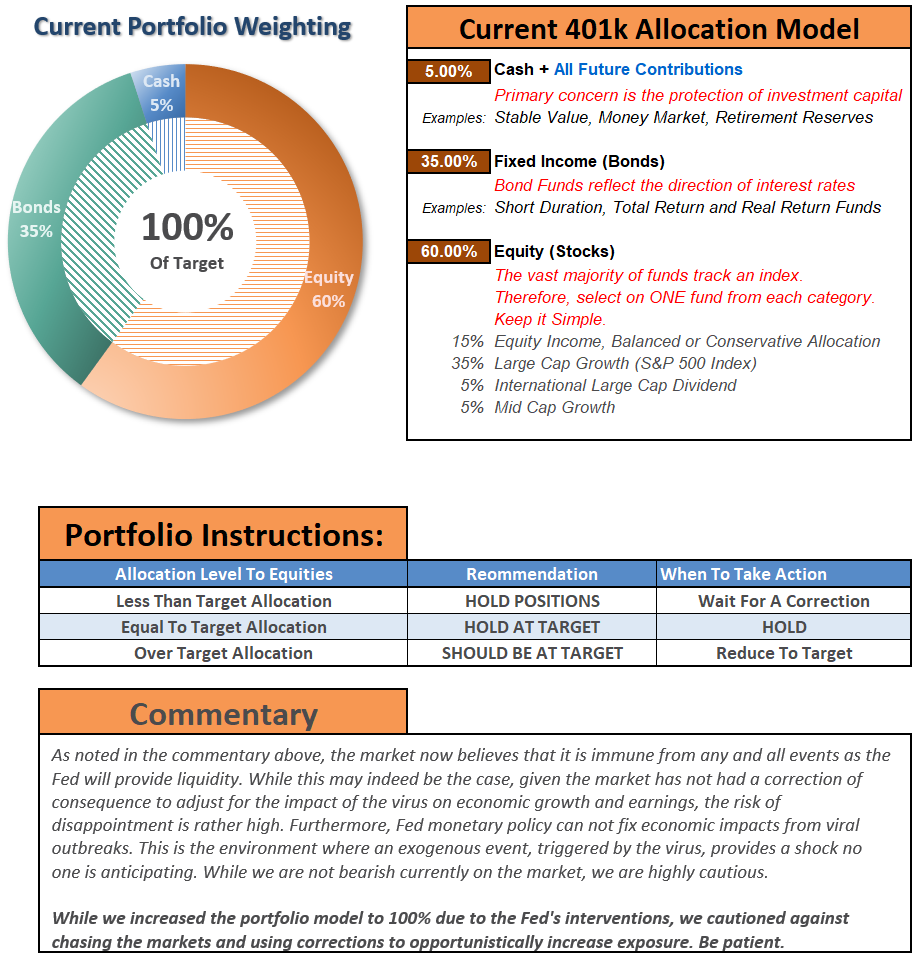

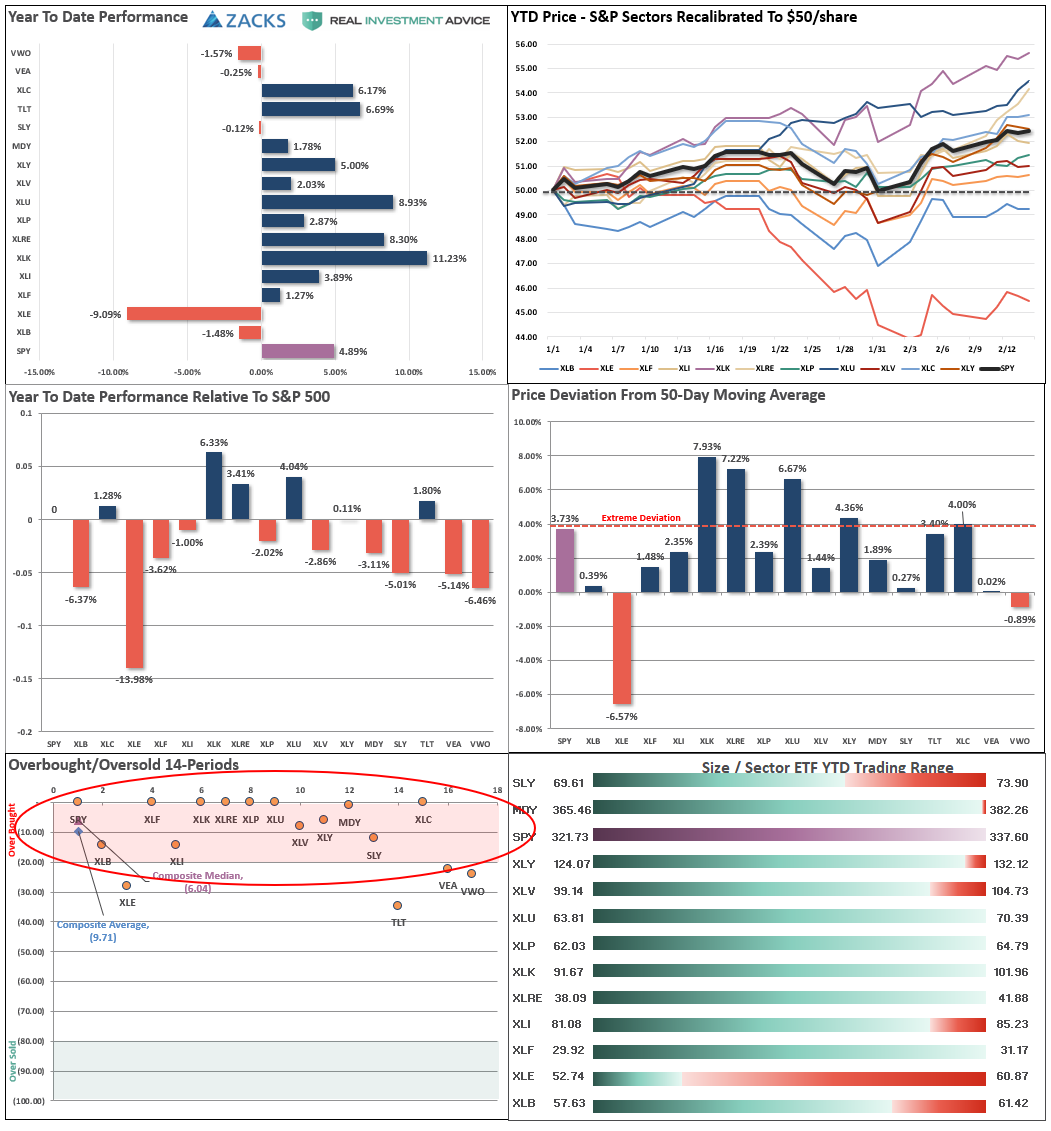
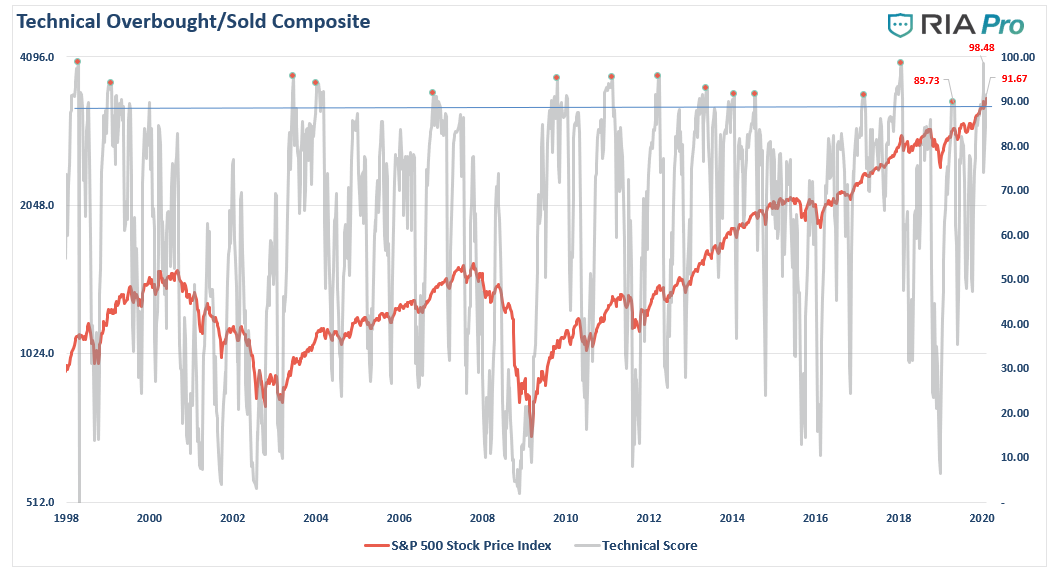
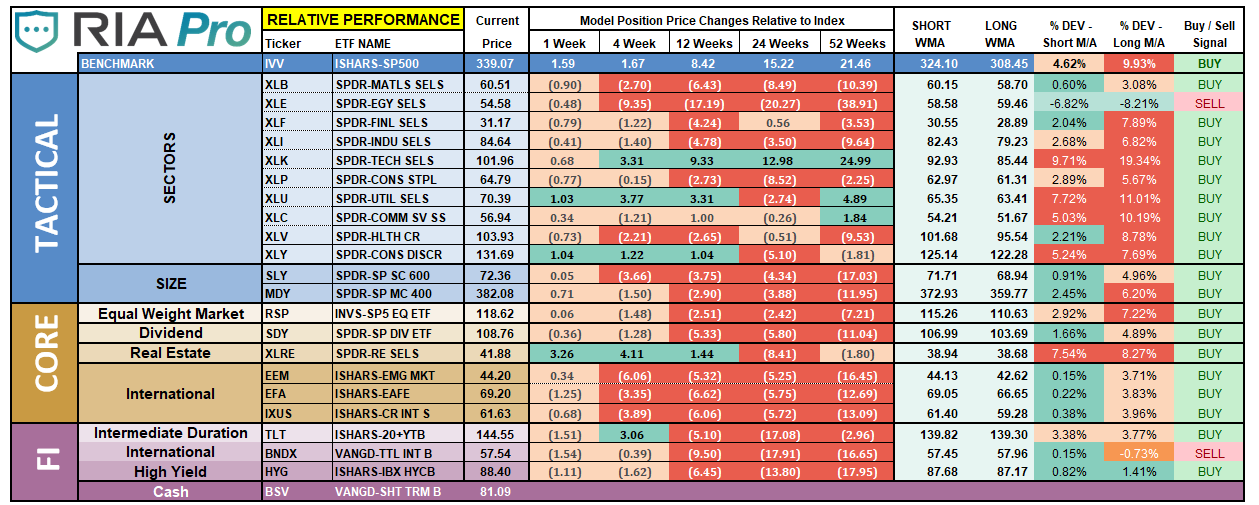
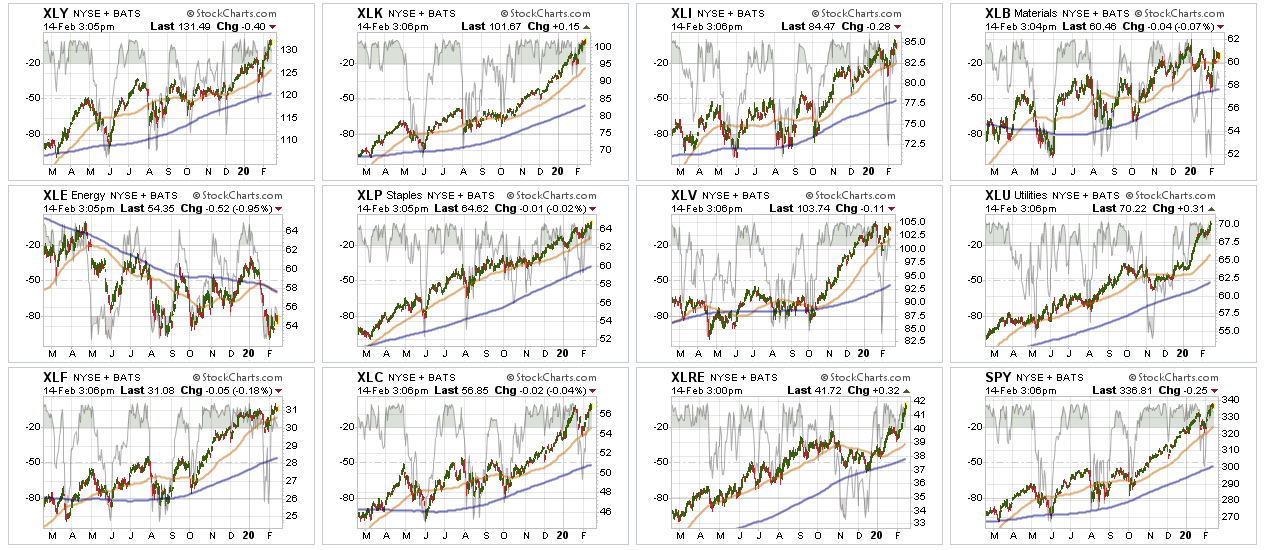
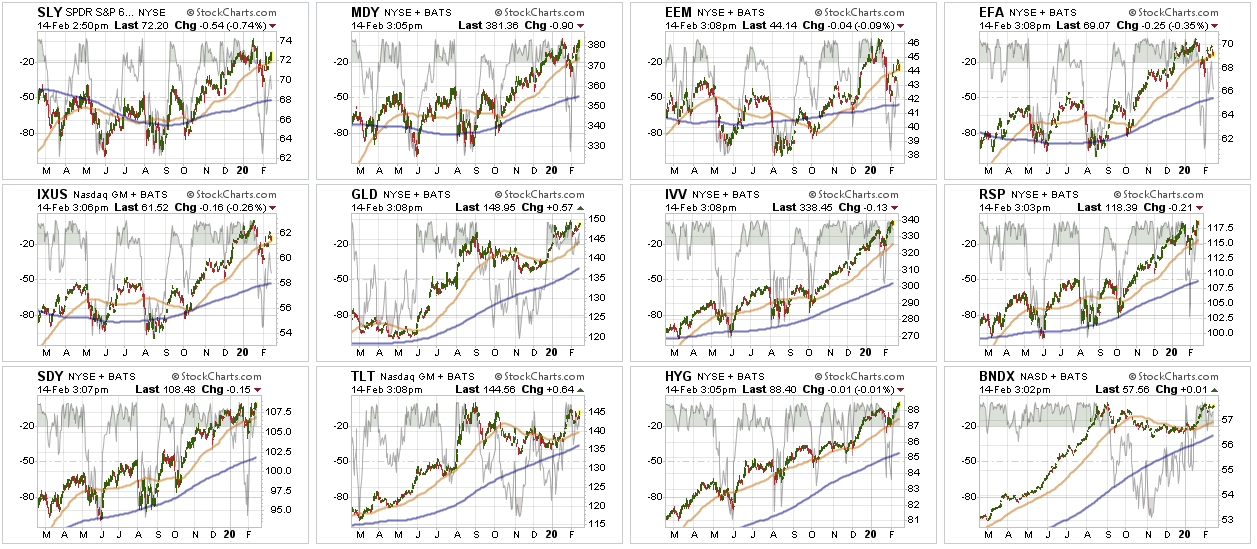
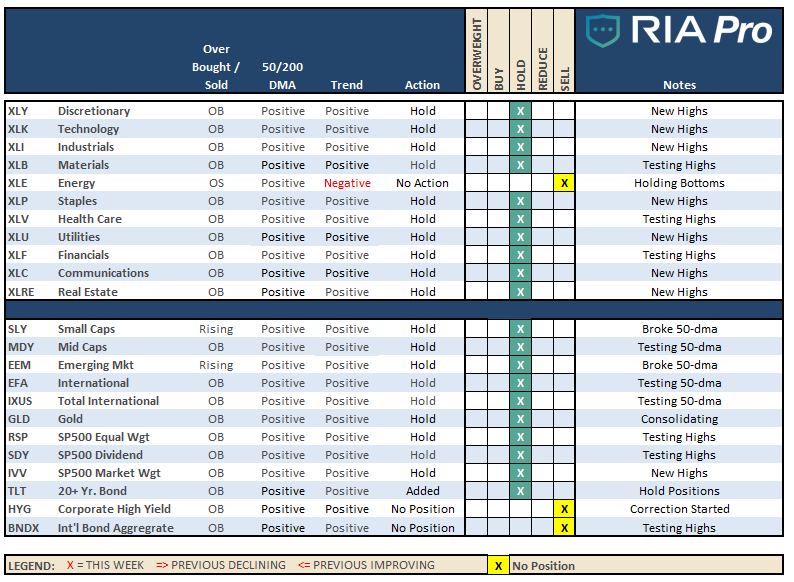

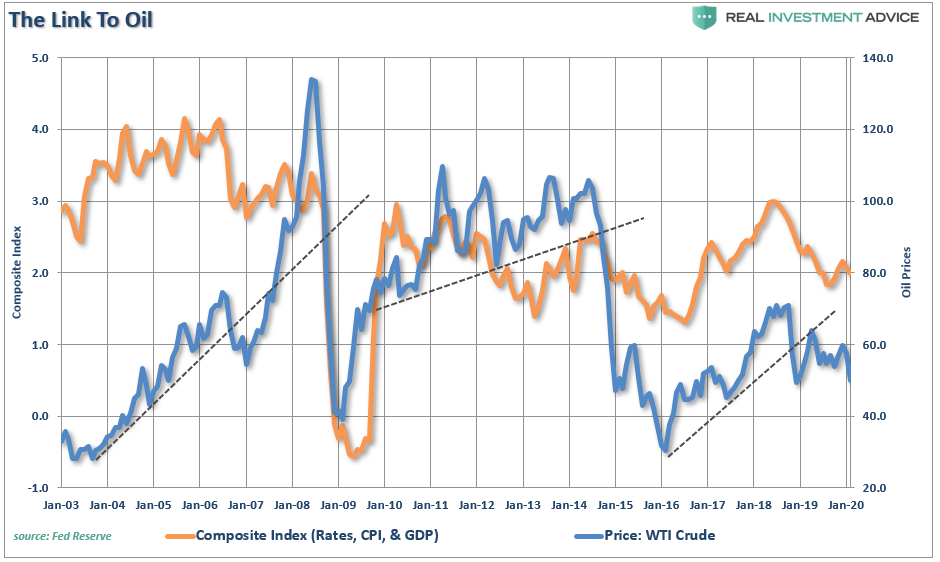
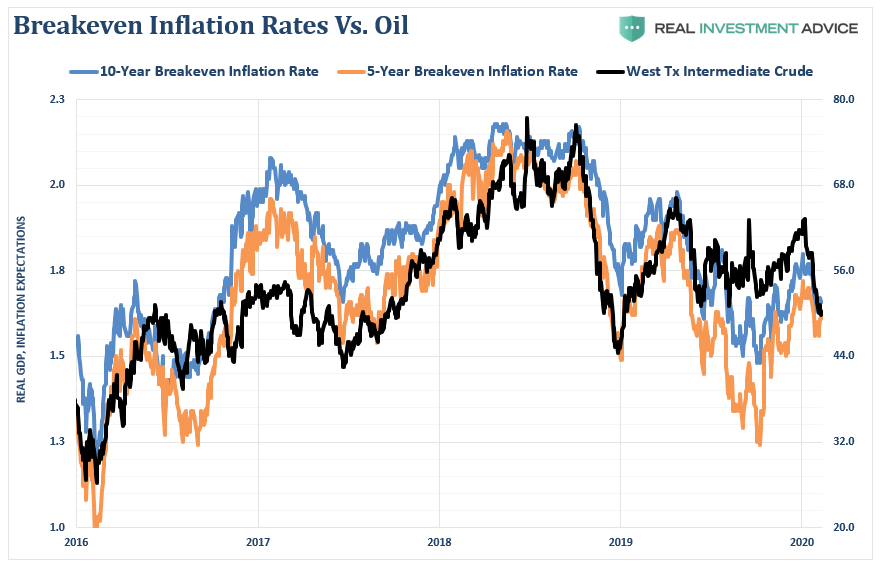
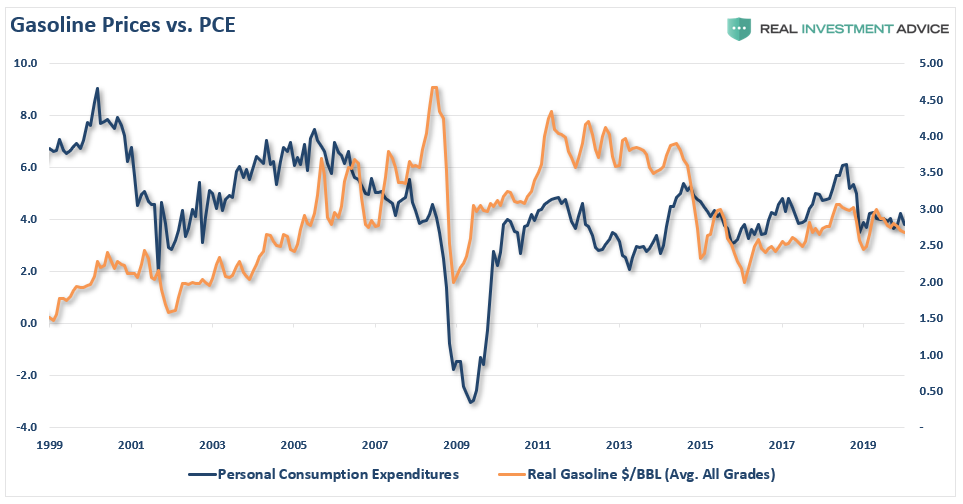
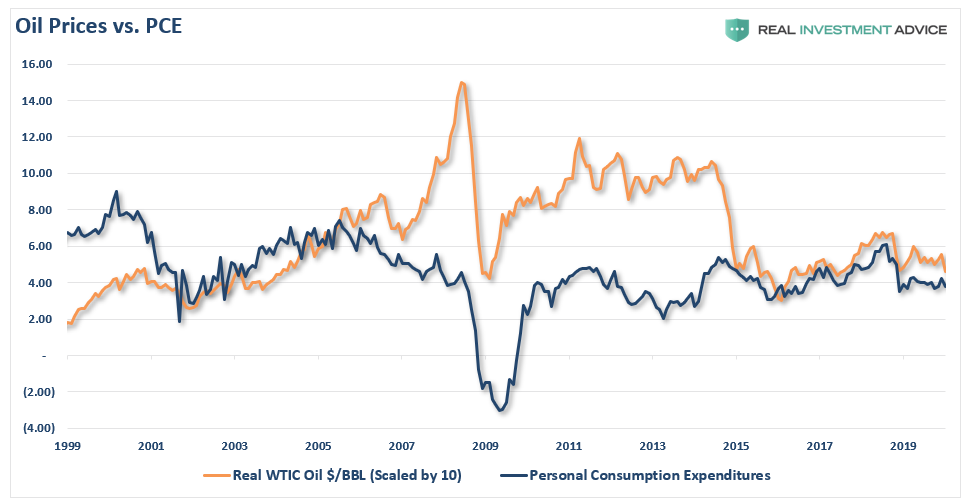
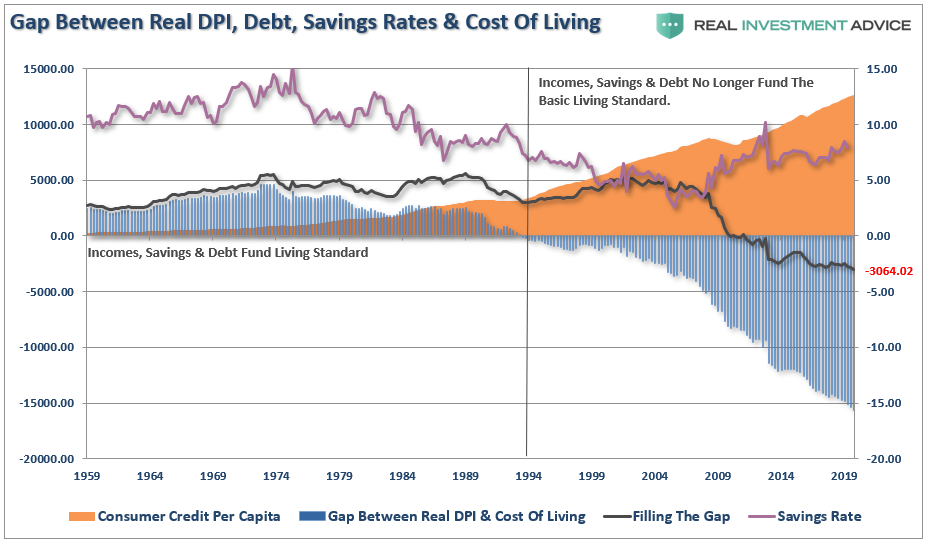
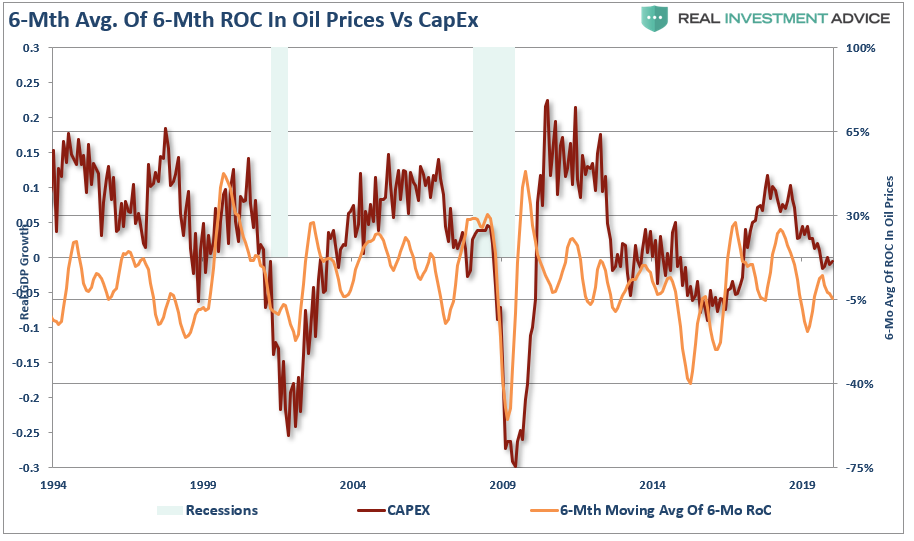


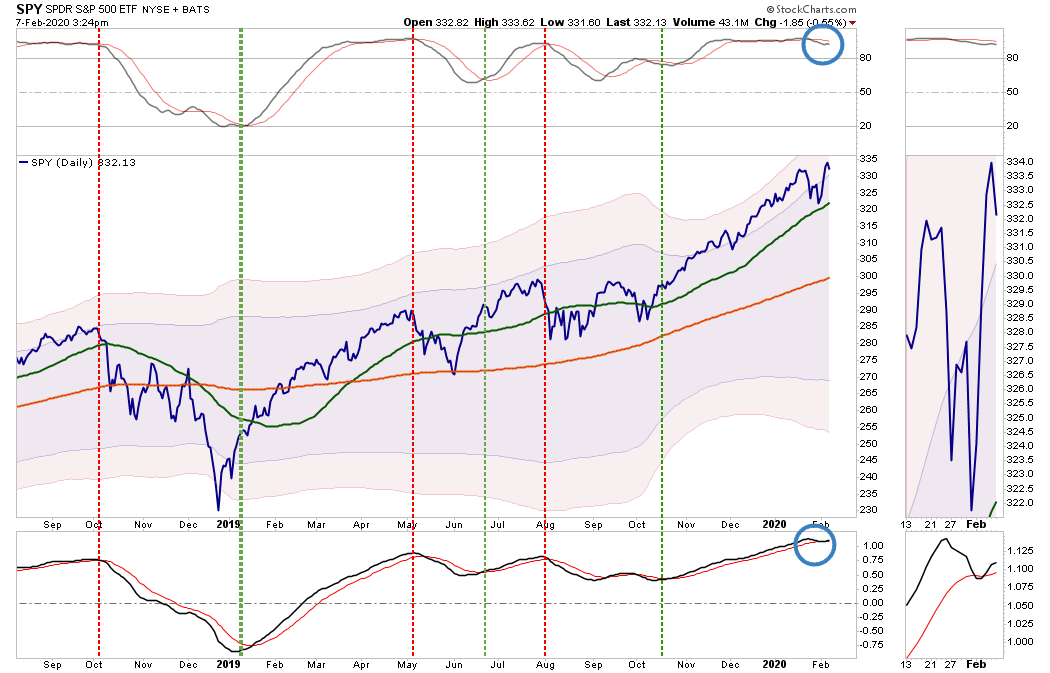
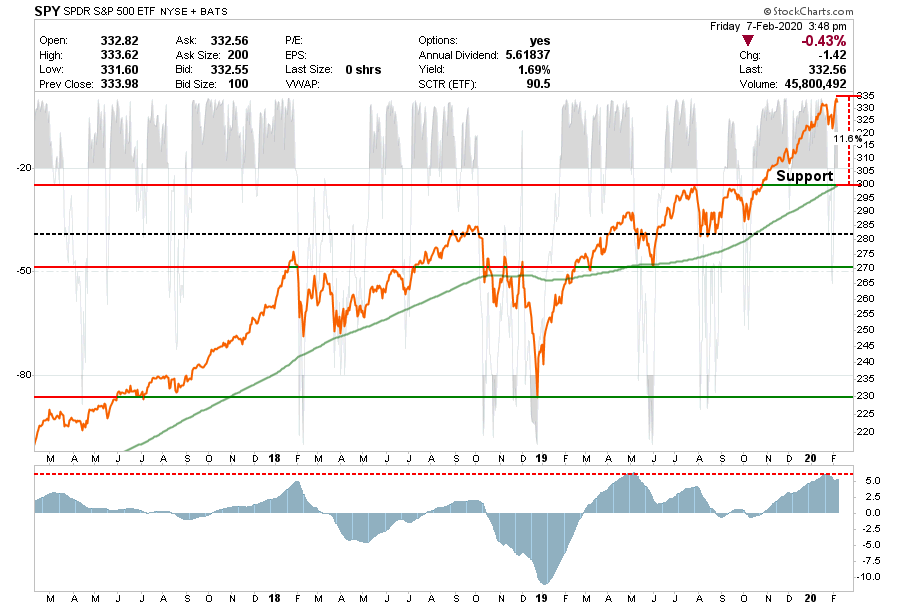
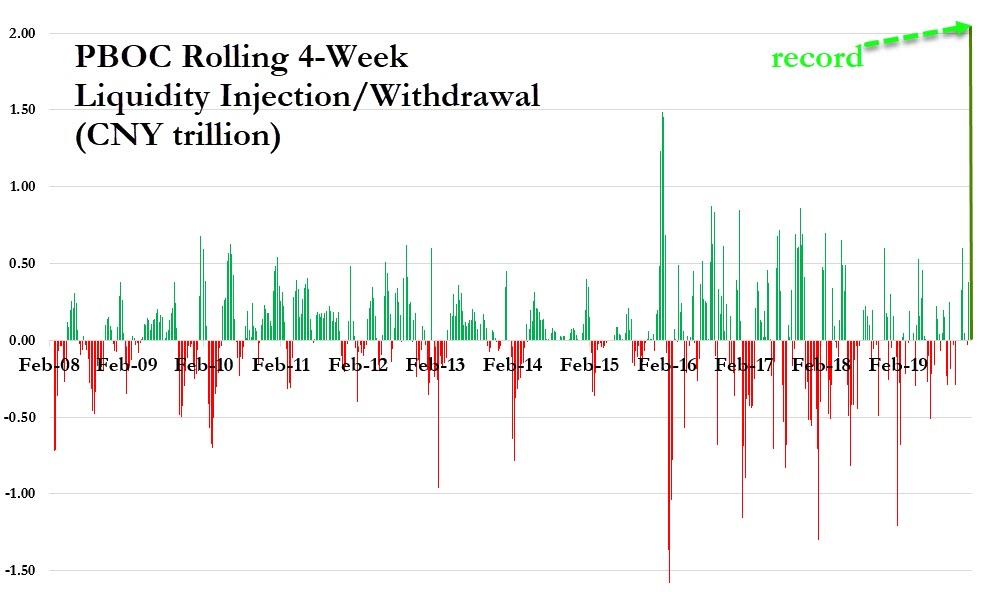
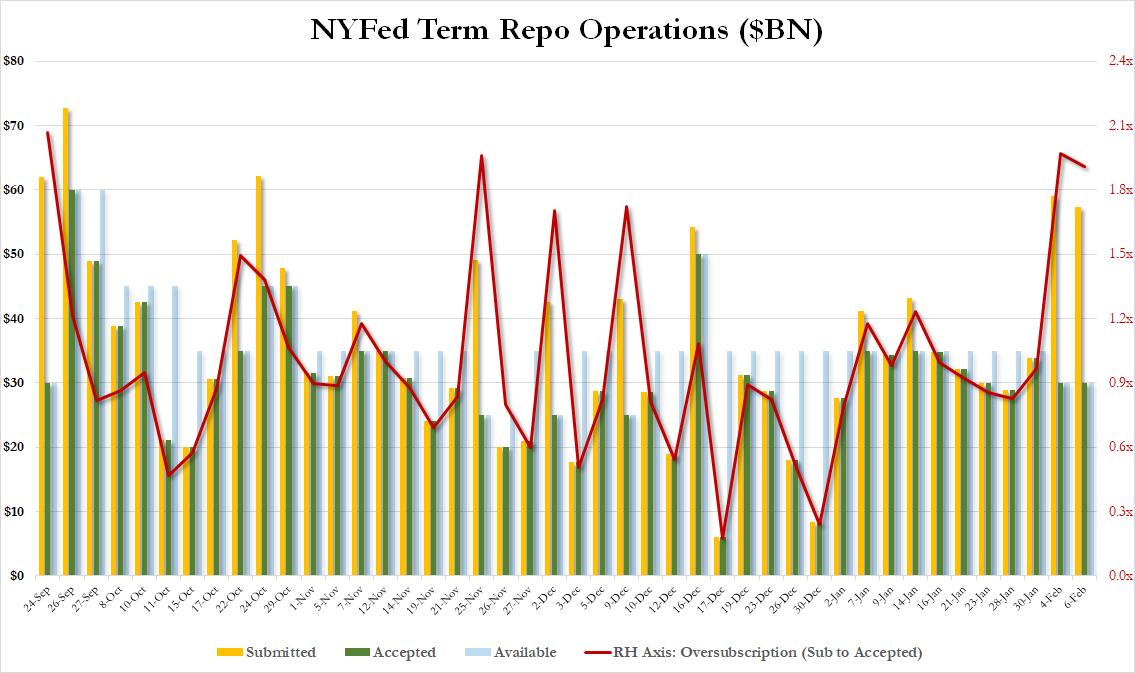
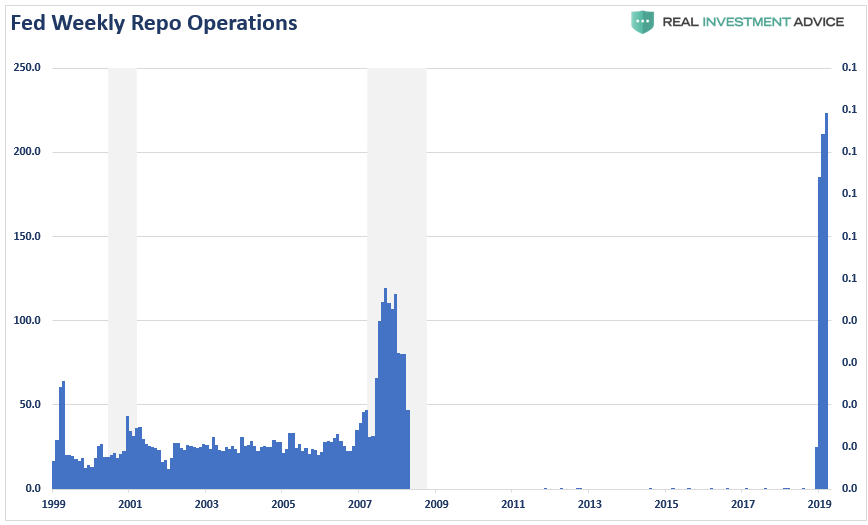
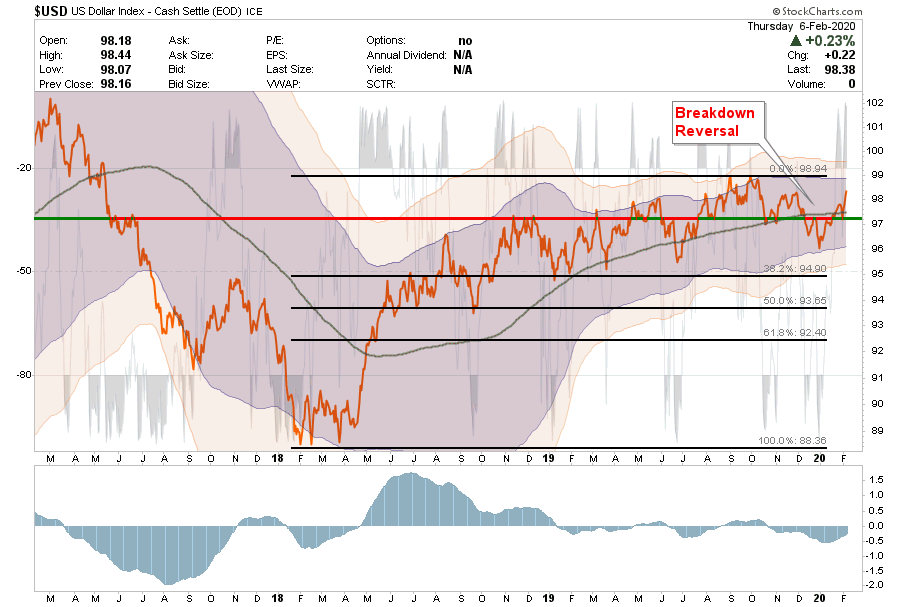
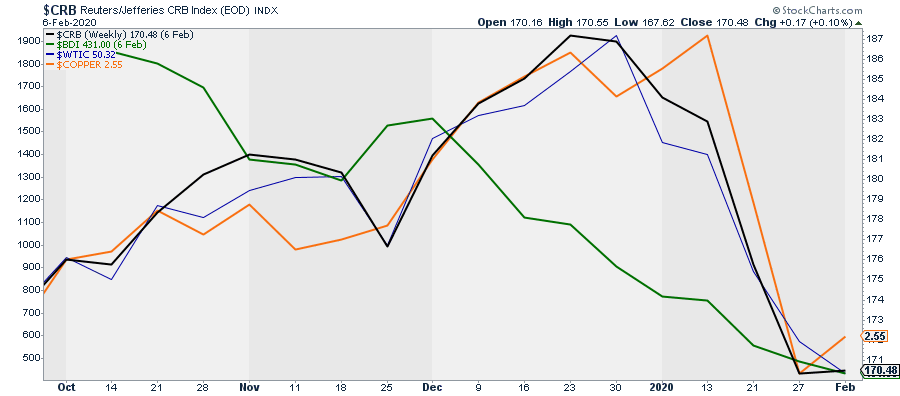
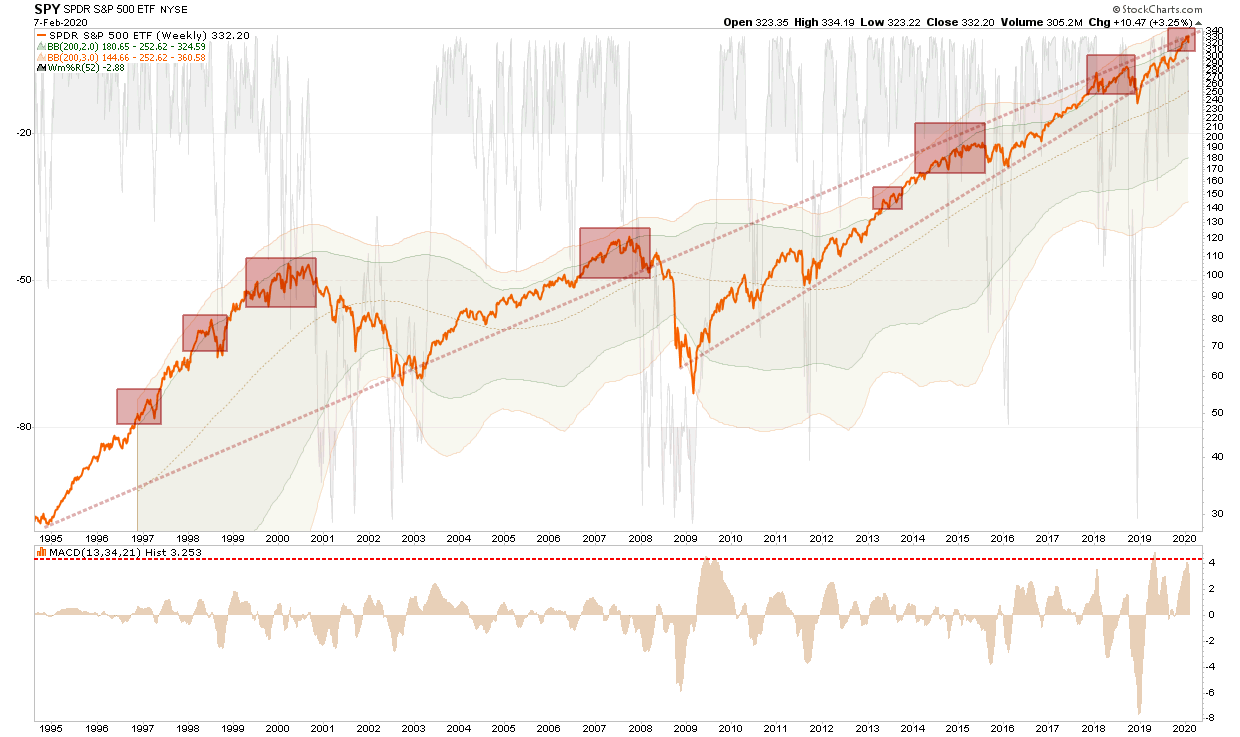
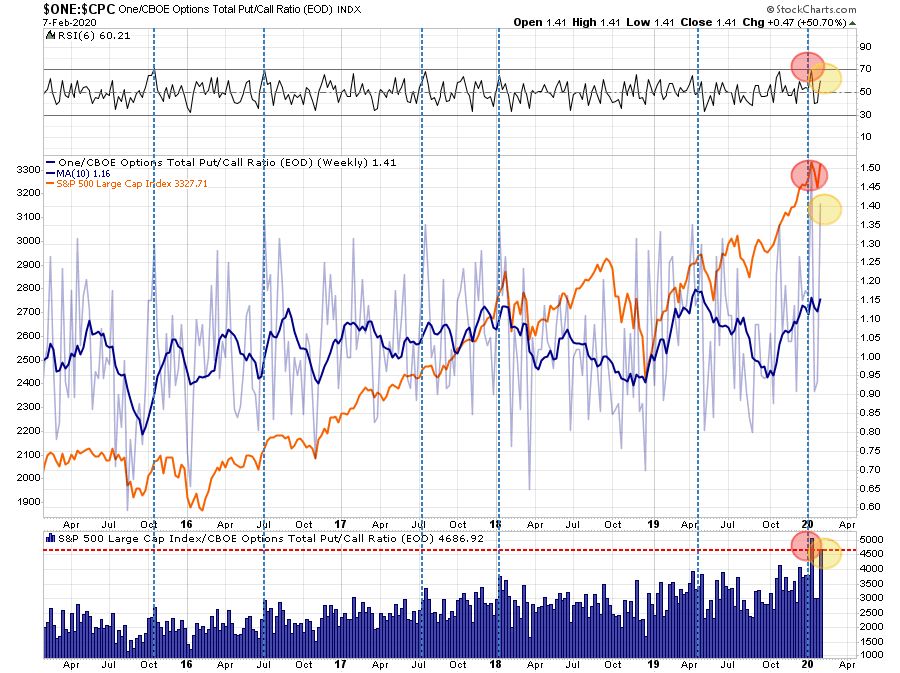
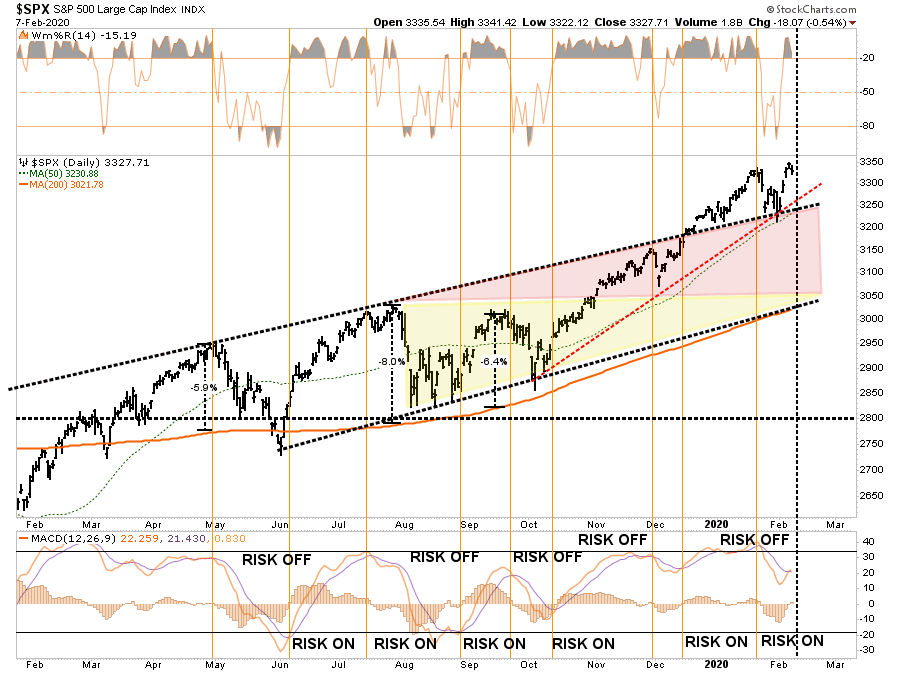


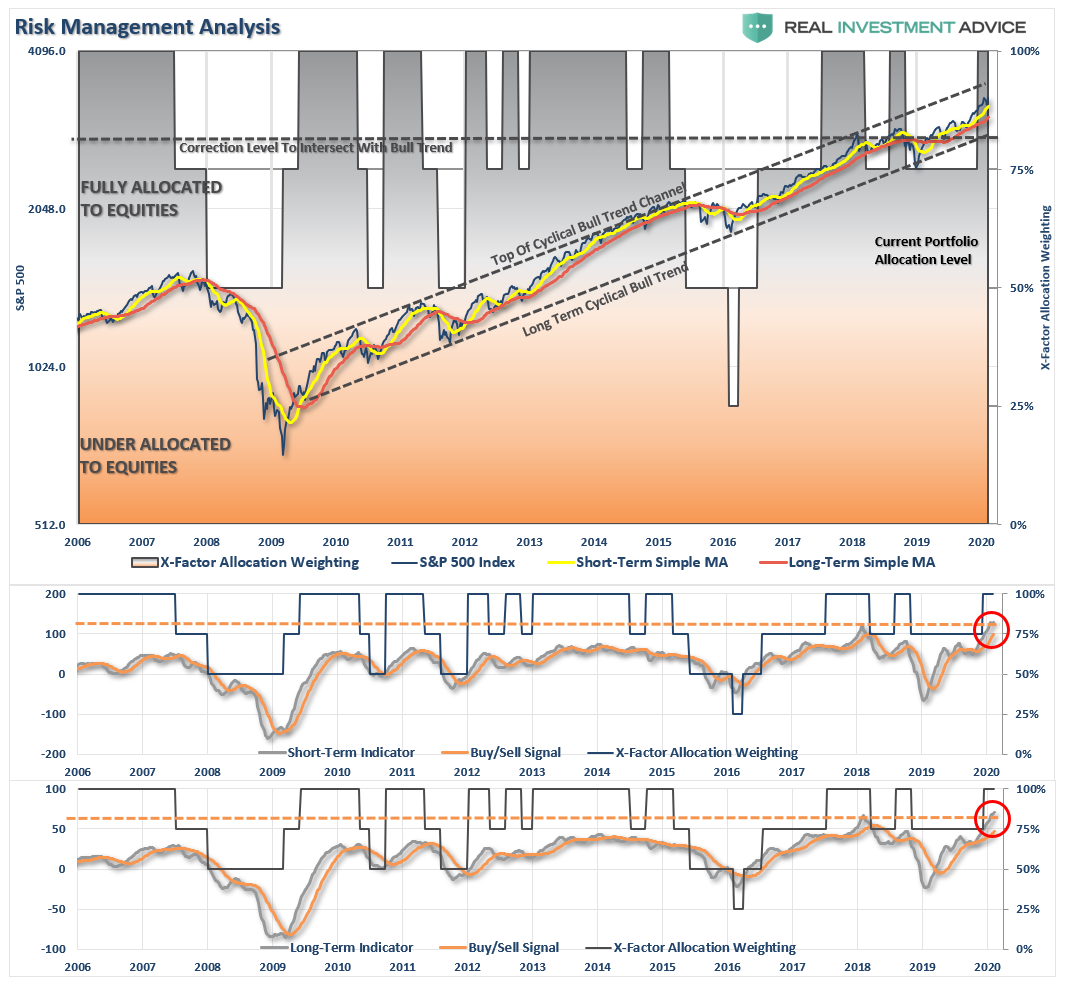
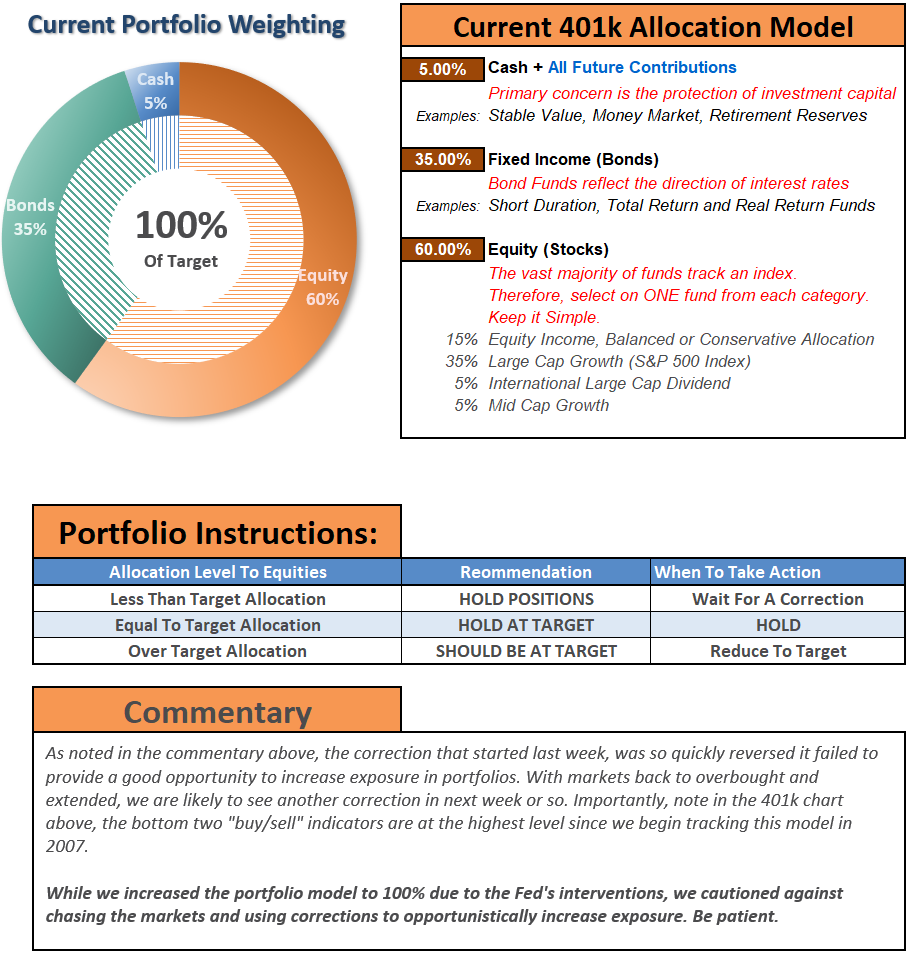

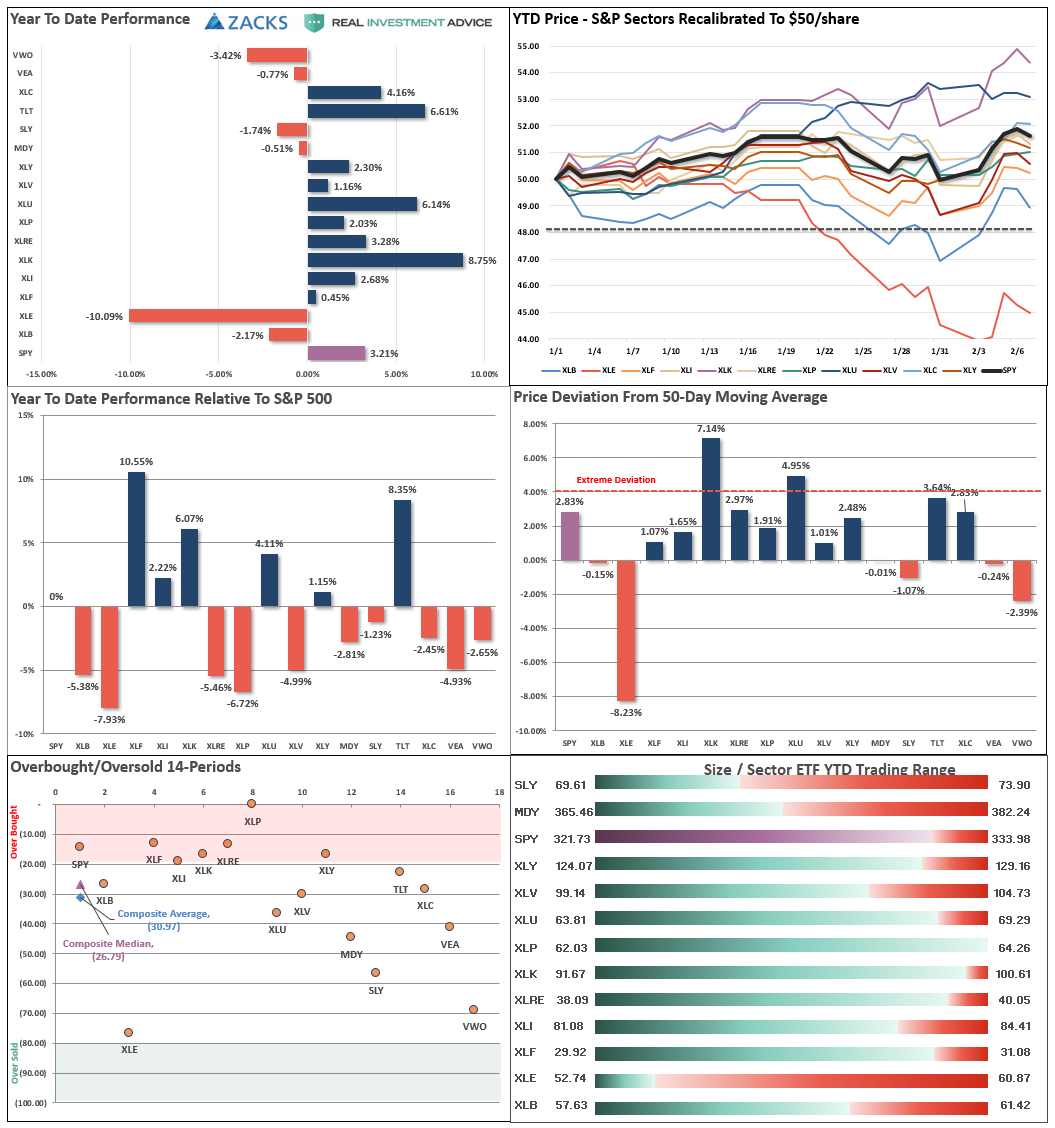
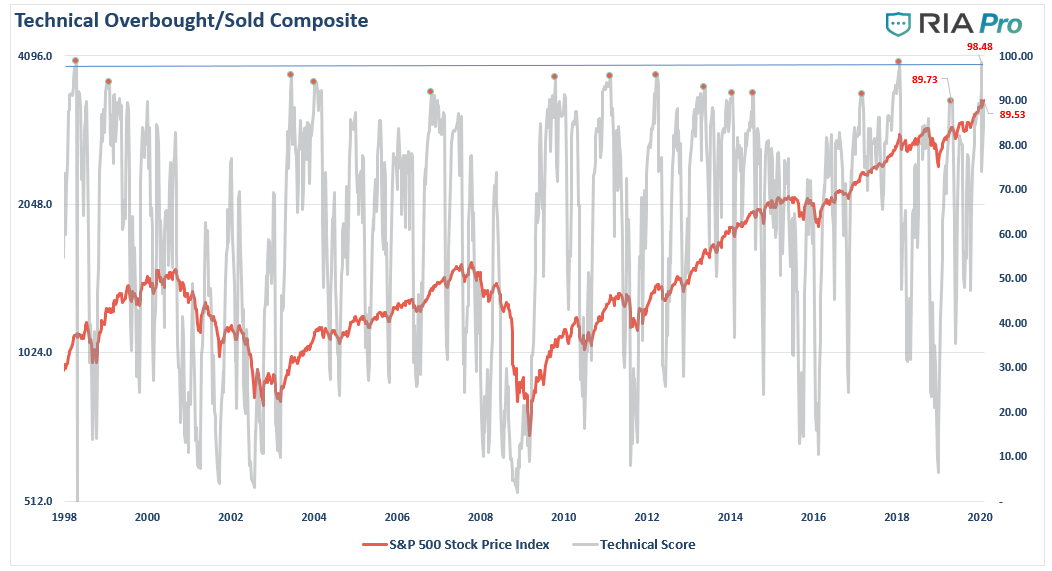
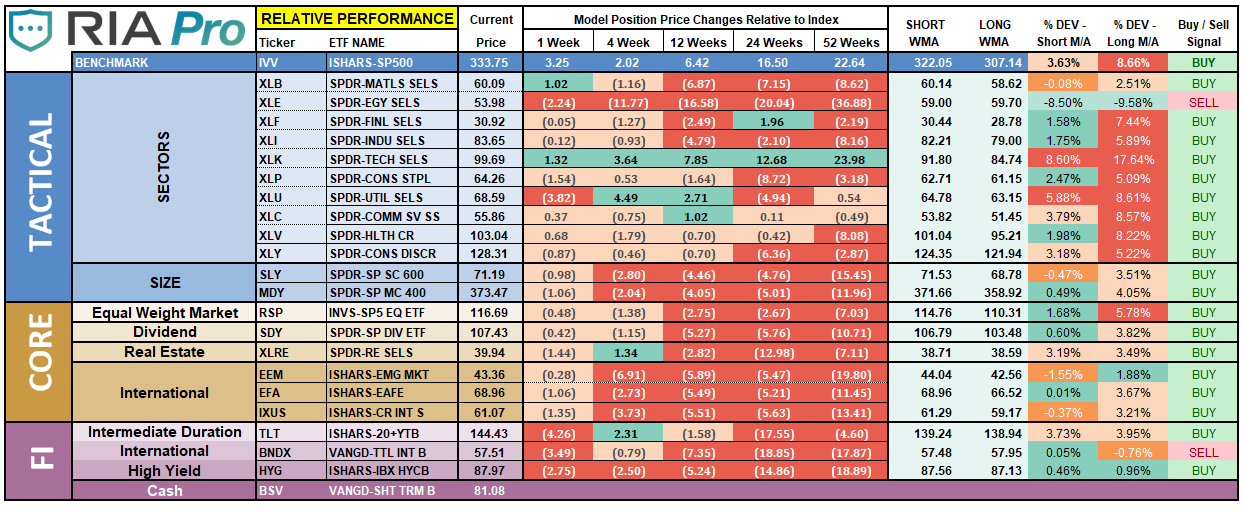
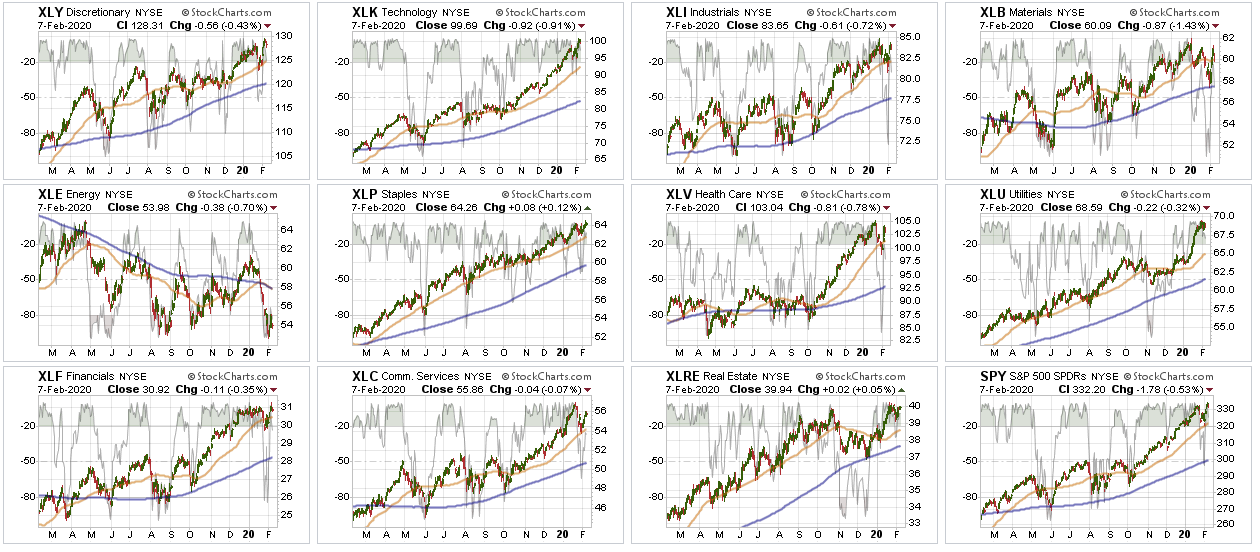
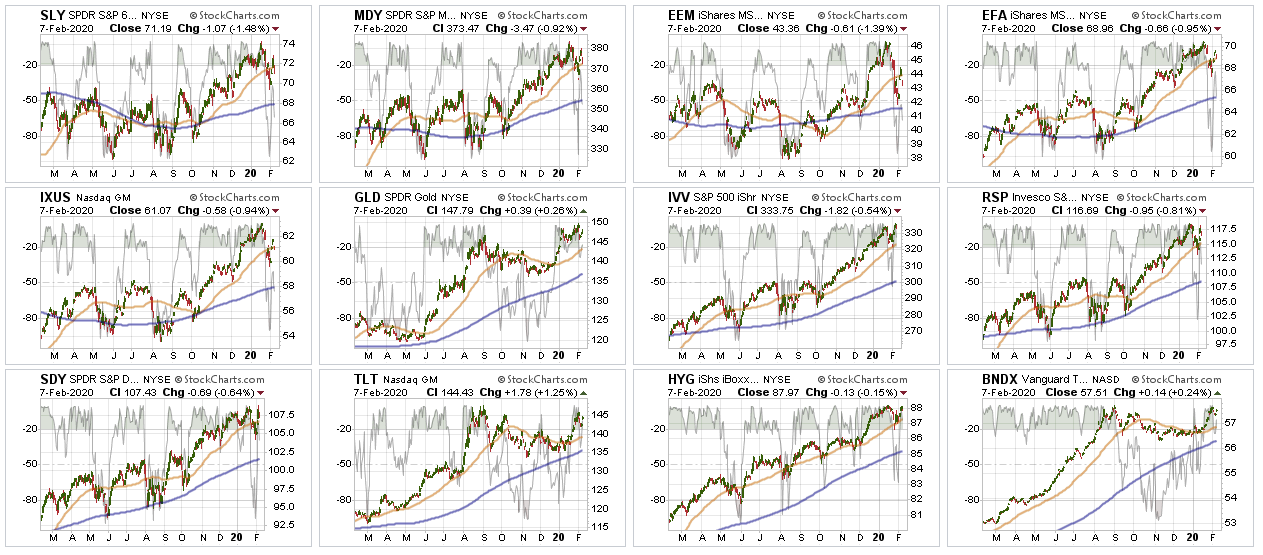
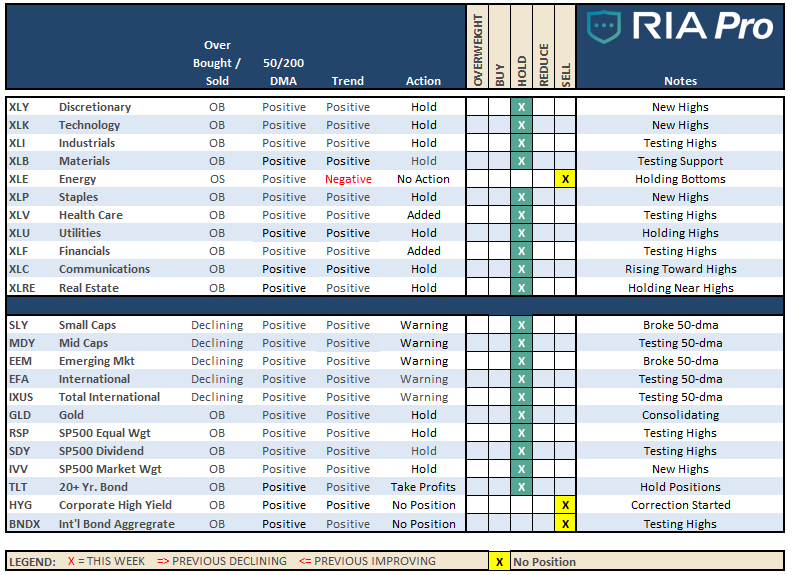
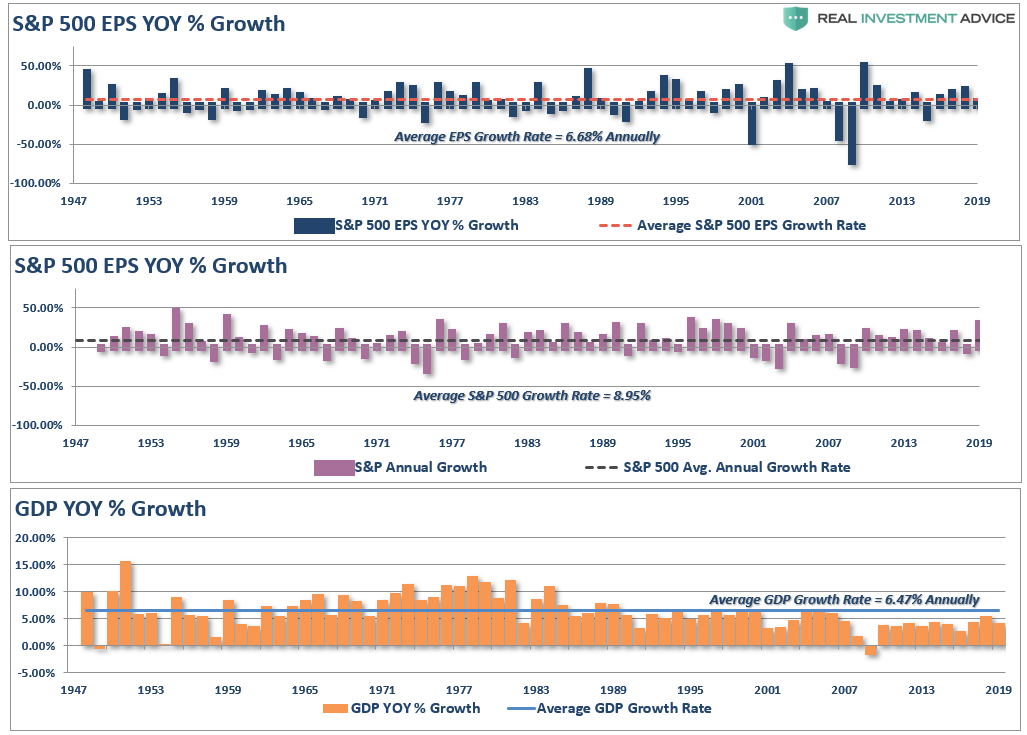
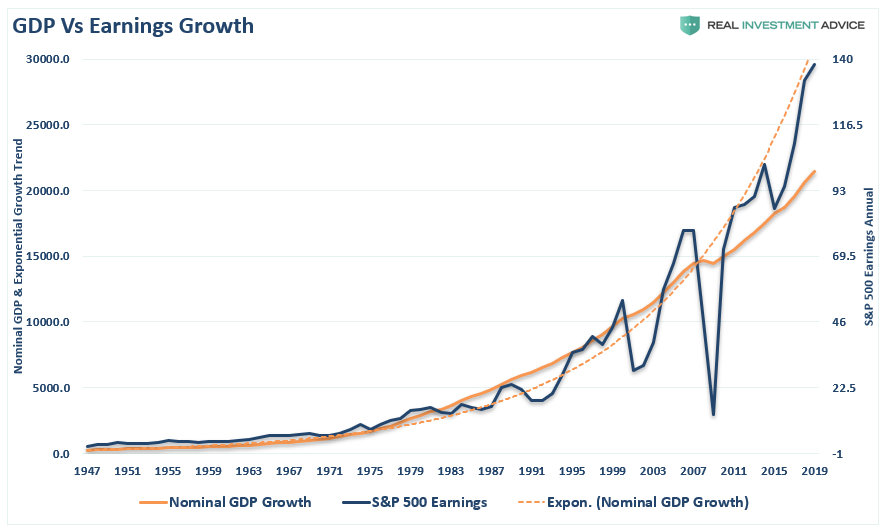
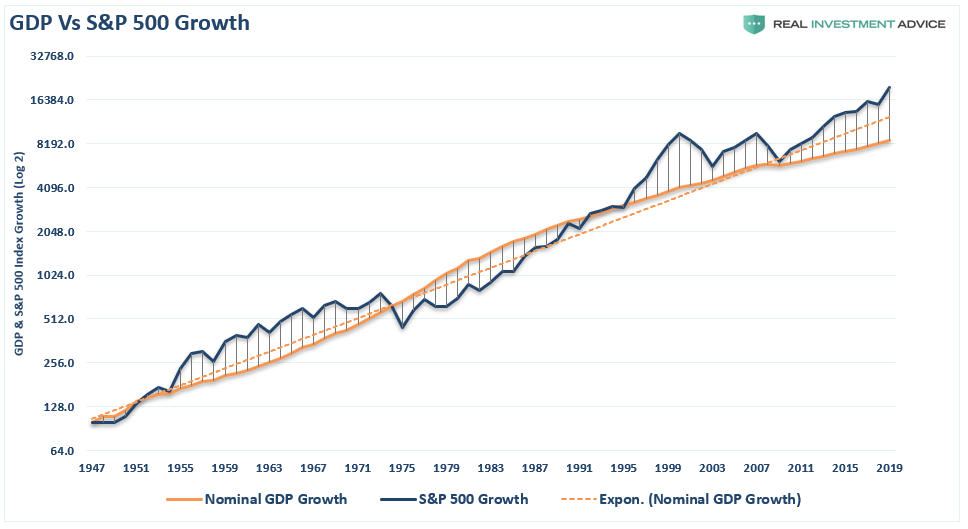
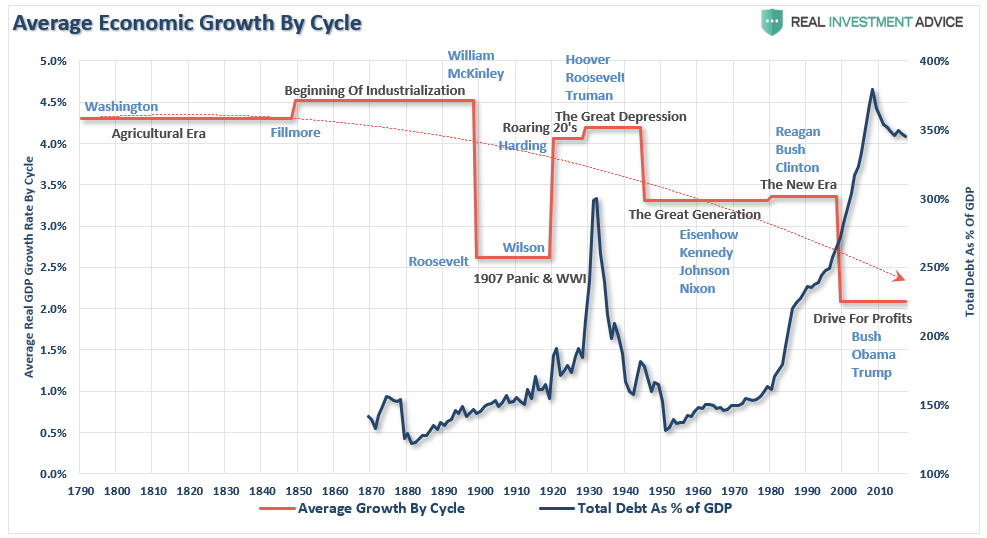
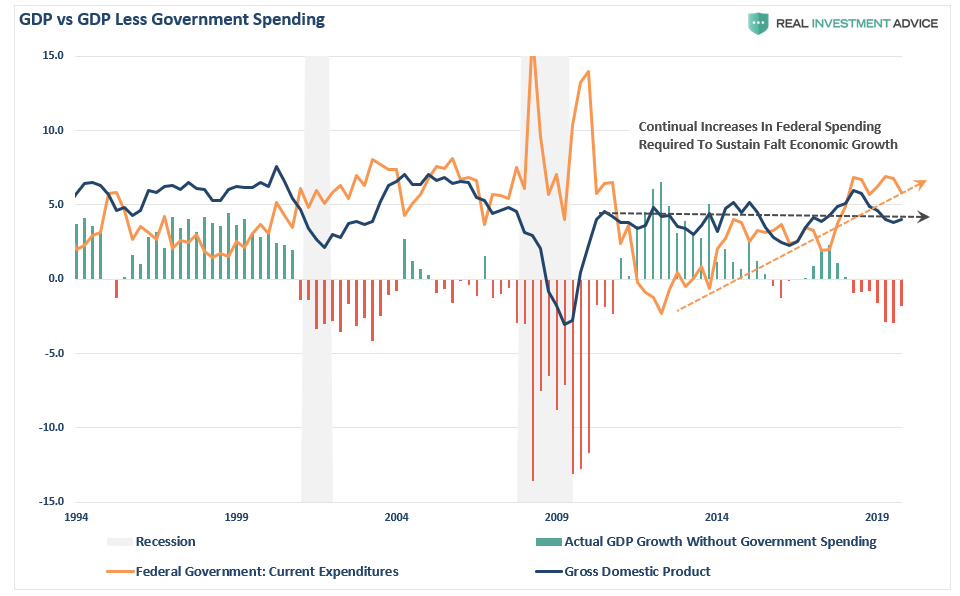
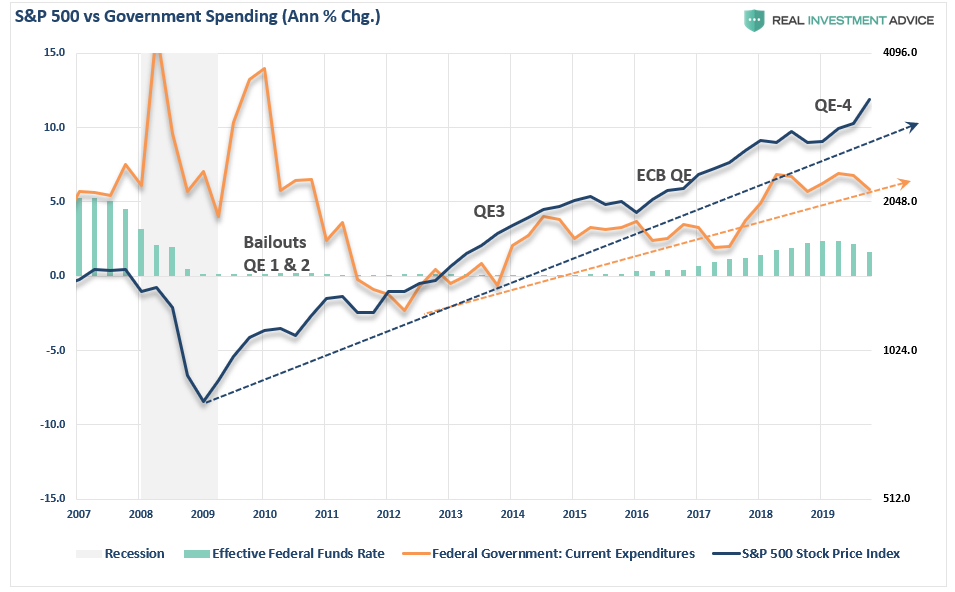
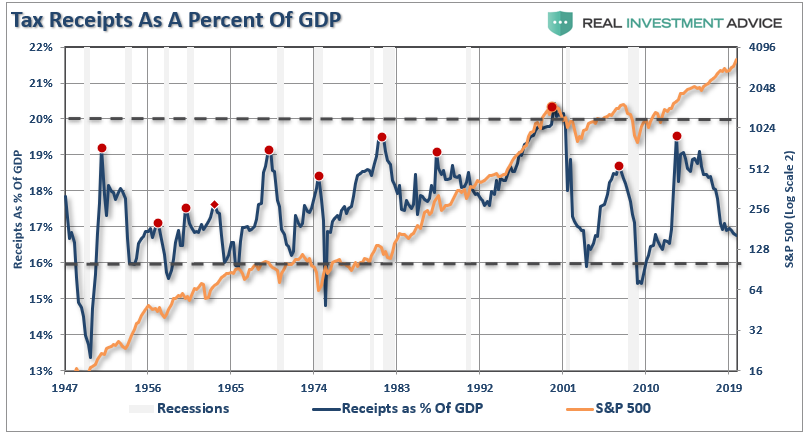
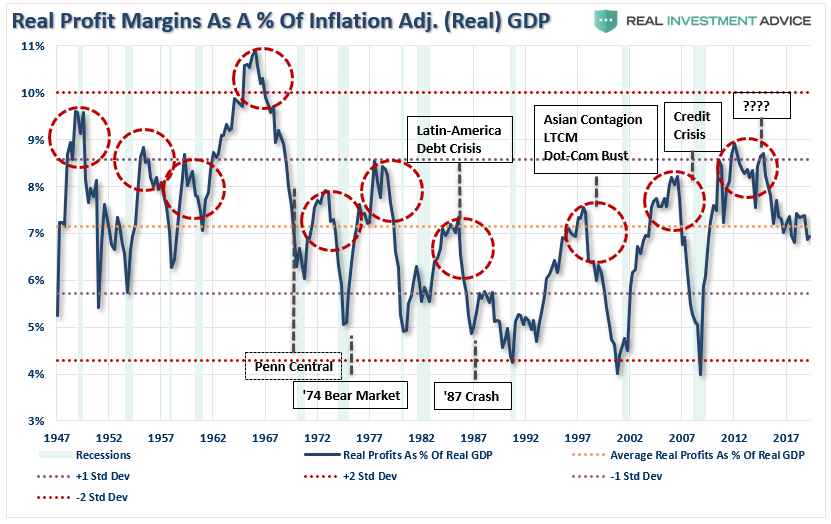
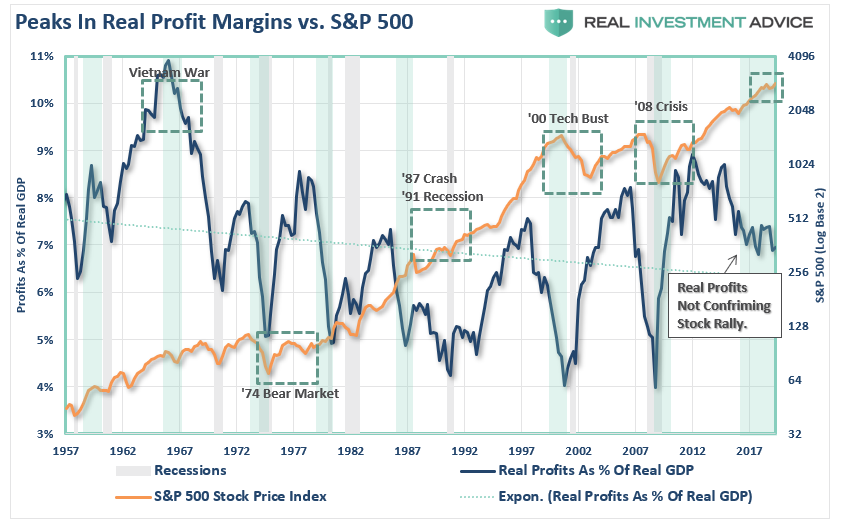
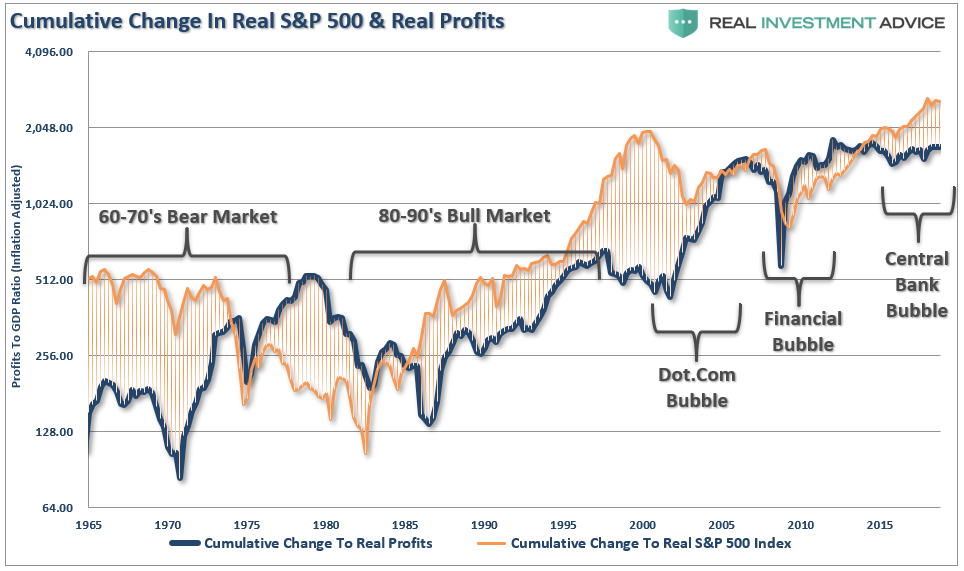
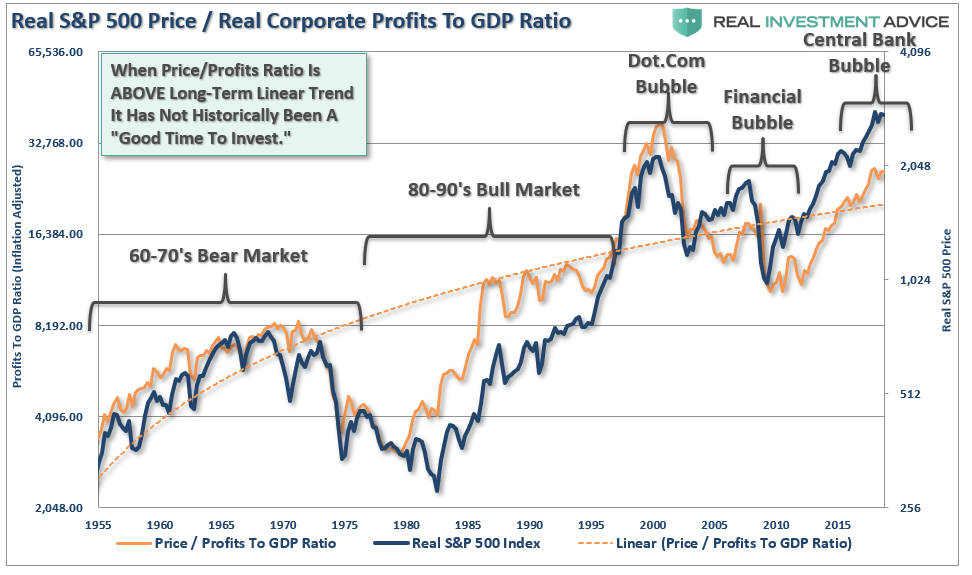


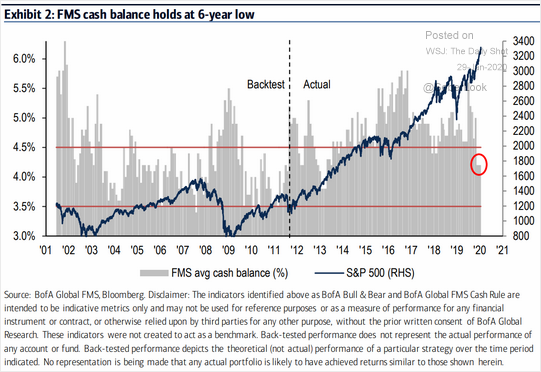

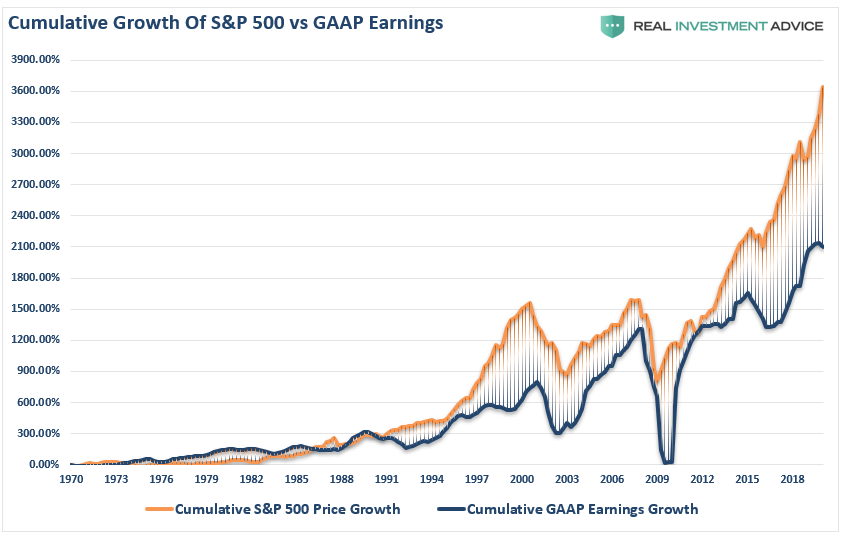

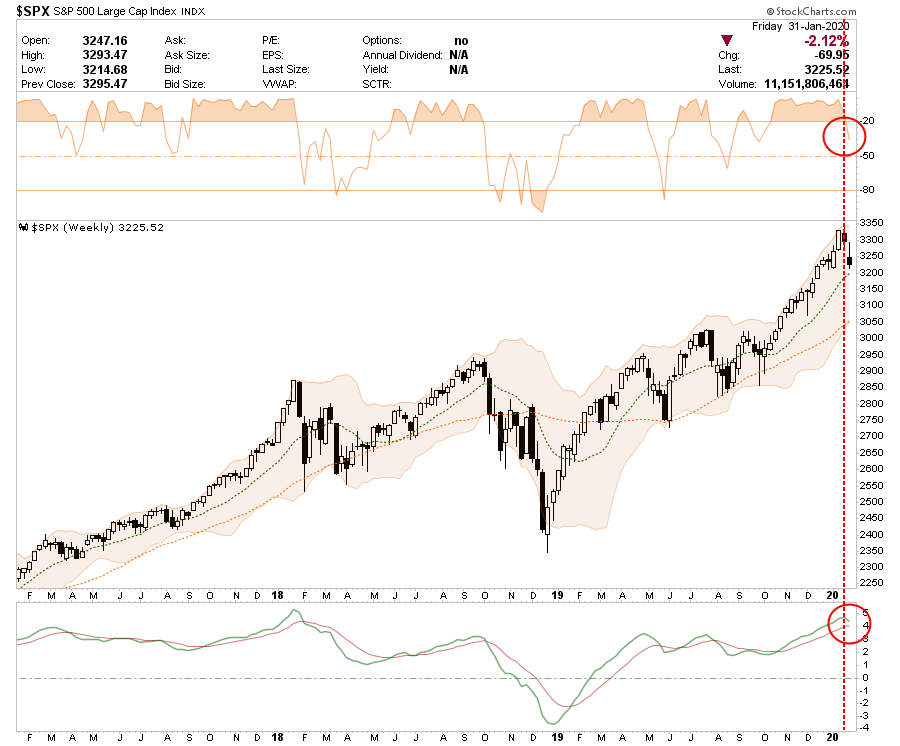
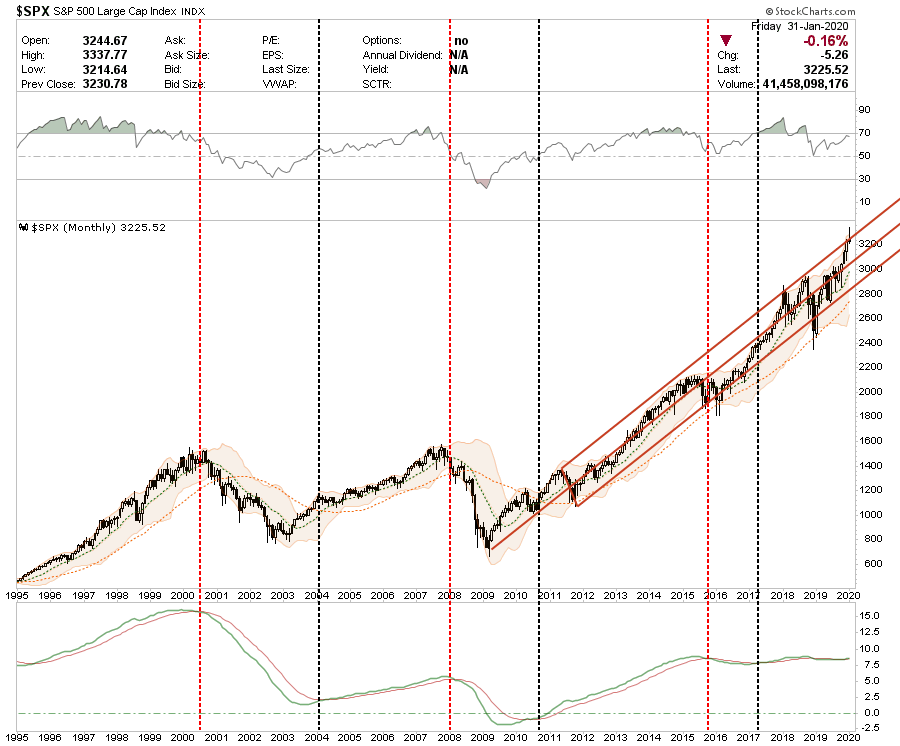
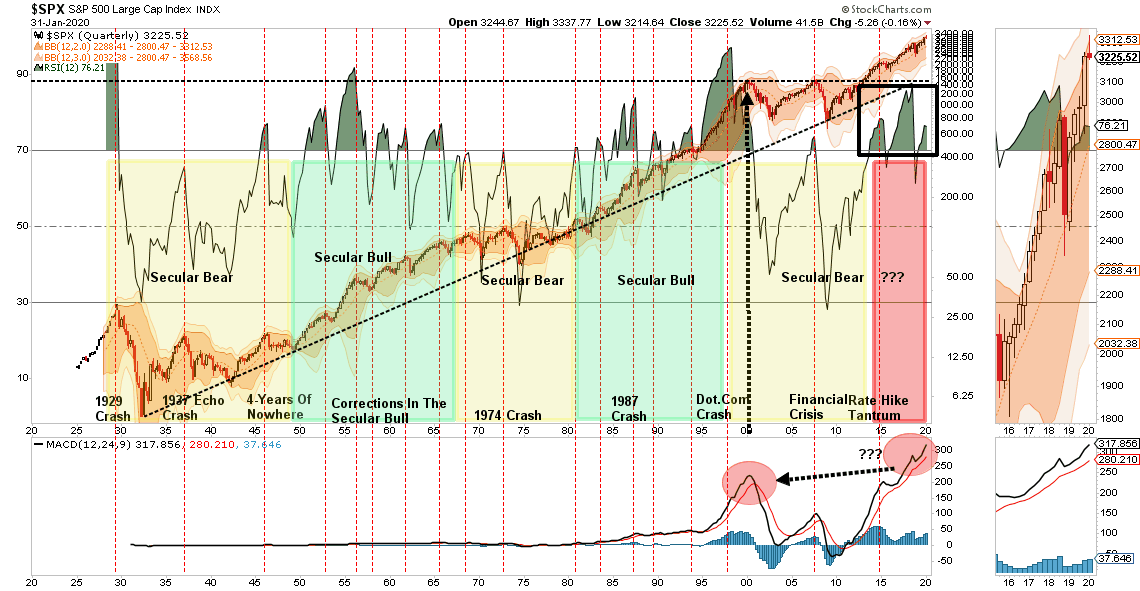
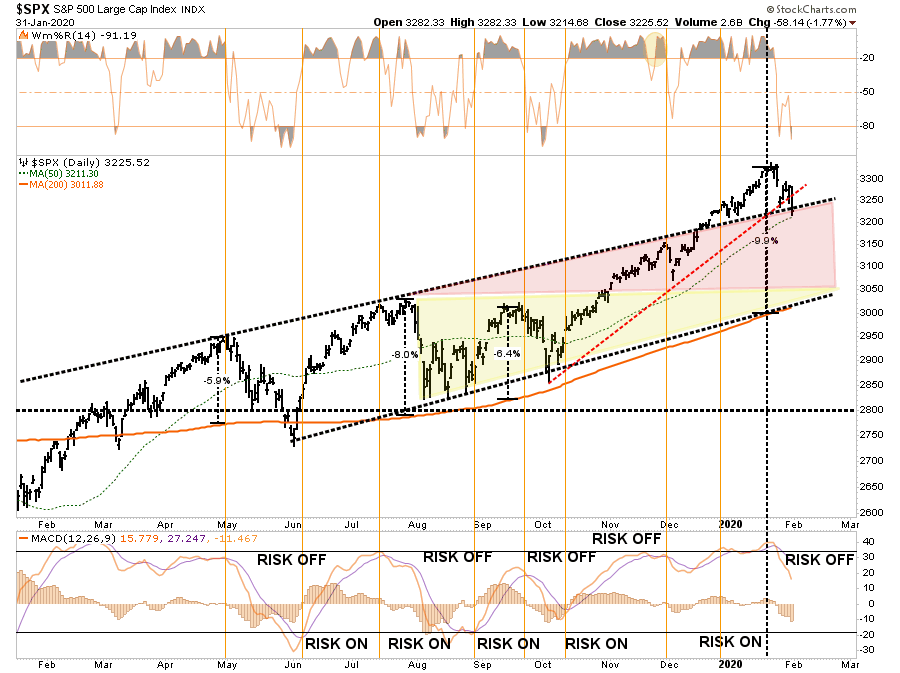


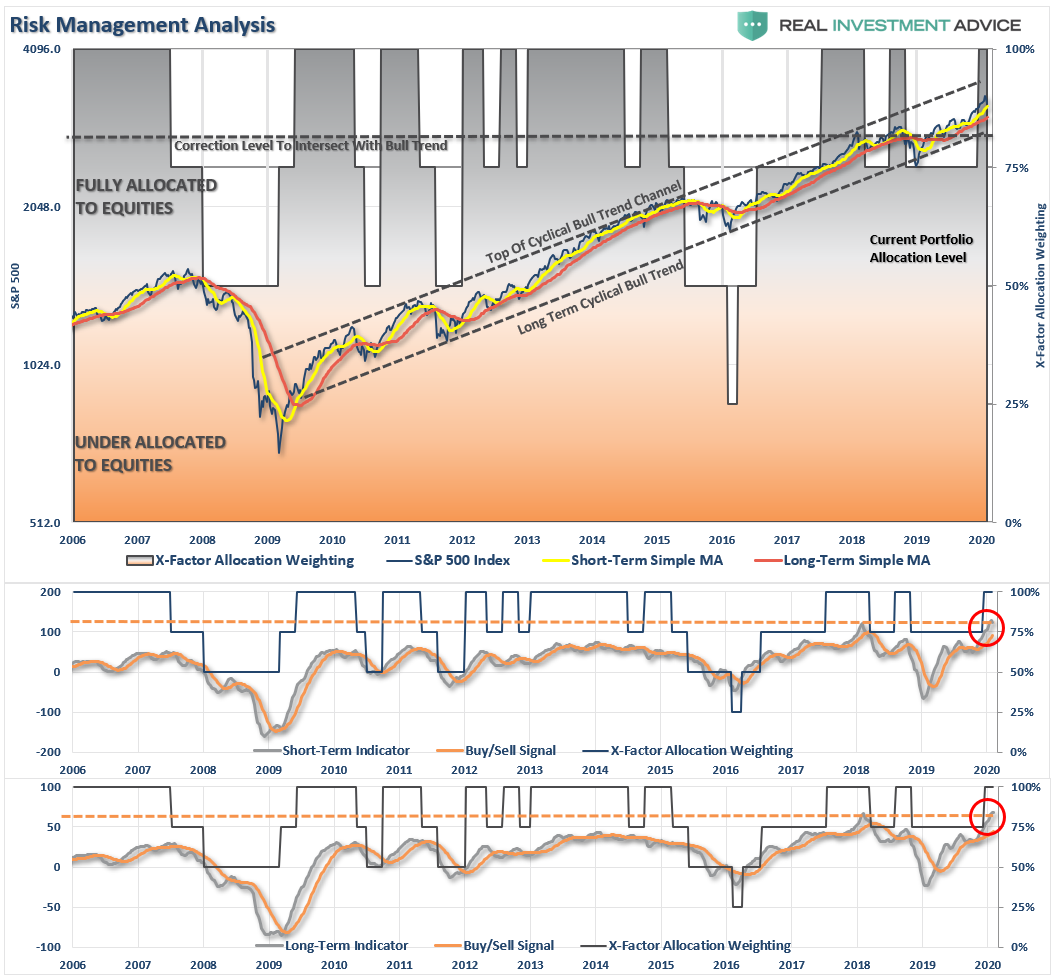
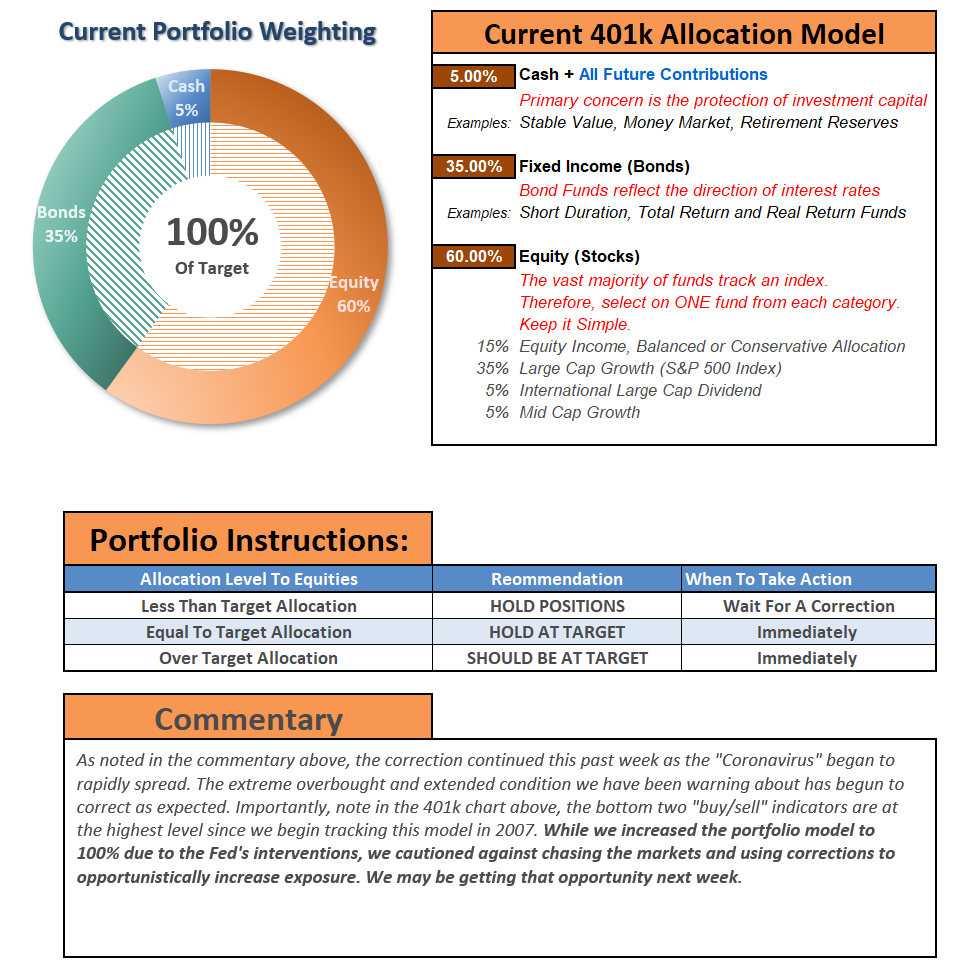


