Tag Archives: savings

Falling Oil Prices An Economic Warning Sign

On Tuesday morning, I got engaged in a debate on the recent decline in oil prices following my report on COT Positioning in the space. To wit:

“The inherent problem with this is that if crude oil breaks below $48/bbl, those long contracts will start to get liquidated which will likely push oil back into the low 40’s very quickly. The decline in oil is both deflationary and increases the risk of an economic recession.”

It didn’t take long before the debate started.

“Aren’t low oil prices good for the economy? They are a tax cut for the consumer?”

There is an old axiom which states that if you repeat a falsehood long enough, it will eventually be accepted as fact.

Low oil prices equating to stronger economic growth is one of those falsehoods.

Oil prices are indeed crucial to the overall economic equation, and there is a correlation between the oil prices, inflation, and interest rates.

Given that oil is consumed in virtually every aspect of our lives, from the food we eat to the products and services we buy, the demand side of the equation is a tell-tale sign of economic strength or weakness. We can see this clearly in the chart below which combines rates, inflation, and GDP into one composite indicator. One important note is that oil tends to trade along pretty defined trends (black trend lines) until it doesn’t. Importantly, since the oil industry is very manufacturing and production intensive, breaks of price trends tend to be liquidation events which has a negative impact on manufacturing and CapEx spending and feeds into the GDP calculation.

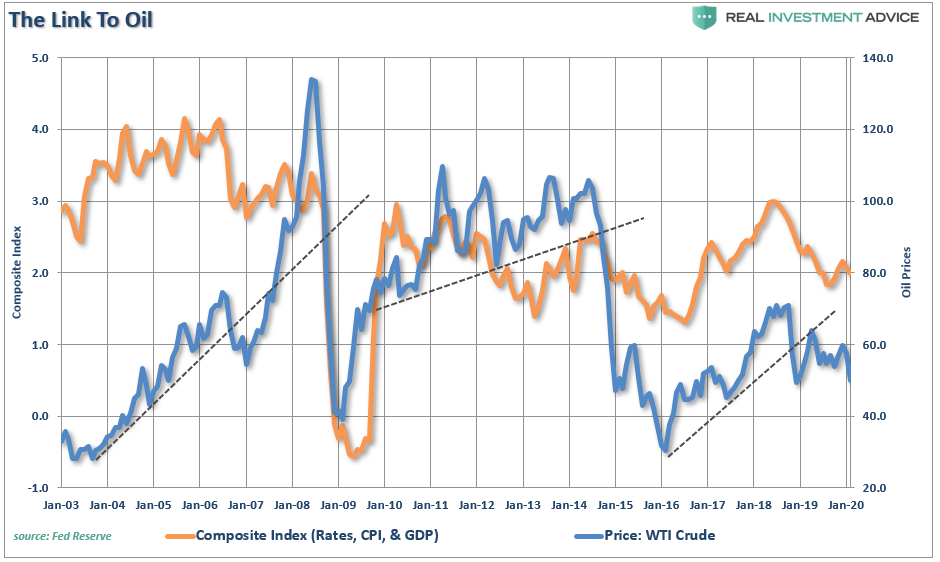
“It should not be surprising that sharp declines in oil prices have been coincident with downturns in economic activity, a drop in inflation, and a subsequent decline in interest rates.

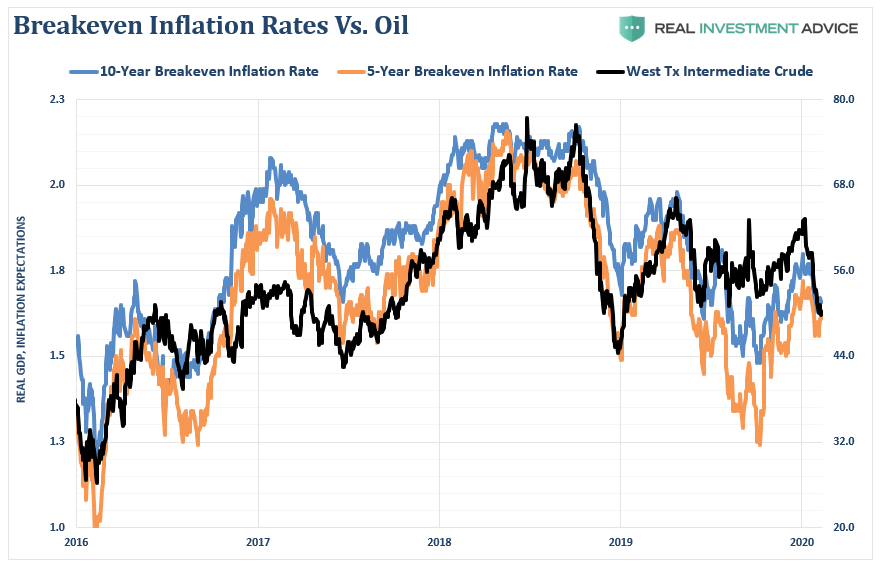
We can also view the impact of oil prices on inflation by looking at breakeven inflation rates as well.

The short version is that oil prices are a reflection of supply and demand. Global demand has already been falling for the last several months, and oil prices are sending warnings that “market hopes” for a “global reflation” are likely not a reality. More importantly, falling oil prices are going to put the Fed in a very tough position in the next couple of months as deflationary pressures rise. The chart below shows breakeven 5-year and 10-year inflation rates versus oil prices.

Zero Sum

The argument that lower oil prices give consumers more money to spend certainly seems entirely logical. Since we know that roughly 80% of households in America effectively live paycheck-to-paycheck, they will spend, rather than save, any extra disposable income.

However, here is the most important part of the fallacy:

“Spending in the economy is a ZERO-SUM game.”

Falling oil prices are an excellent example since gasoline sales are part of the retail sales calculation.

Let’s take a look at the following example:

  • Oil Prices Decline By $10 Per Barrel
  • Gasoline Prices Fall By $1.00 Per Gallon
  • Consumer Fills Up A 16 Gallon Tank Saving $16 (+16)
  • Gas Station Revenue Falls By $16 For The Transaction (-16)
  • End Economic Result = $0

Now, the argument is that the $16 saved by the consumer will be spent elsewhere, which is true. However, this is the equivalent of “rearranging deck chairs on the Titanic.”

So, let’s now extend our example from above.

Oil and gasoline prices have dropped, so Elaine, who has budgeted $100 to spend each week on retail-related purchases, goes to the gas station to fill up.

  • Elaine fills up her car for $60, which previously cost $80. (Savings +$20)
  • Elaine then spends her normal $20 on lunch with her friends. 
  • She then spends her additional $20 (saved from her gas bill) on some flowers for the dining room.

————————————————-
Total Spending For The Week = $100

Now, economists quickly jump on the idea that because she spent $20 on flowers, there has been an additional boost to the economy.

However, this is not the case. Elaine may have spent her money differently this past week, but she still spent the same amount. Here is the net effect on the economy.

Gasoline Station Revenue = (-$20)
Flower Store Revenue = +$20
—————————————————-
Net Effect To Economy = $0

Graphically, we can show this by analyzing real (inflation-adjusted) gasoline prices compared to total Personal Consumption Expenditures (PCE). I am using “PCE” as it is the broadest measure of consumer spending and comprises almost 70% of the entire GDP calculation.

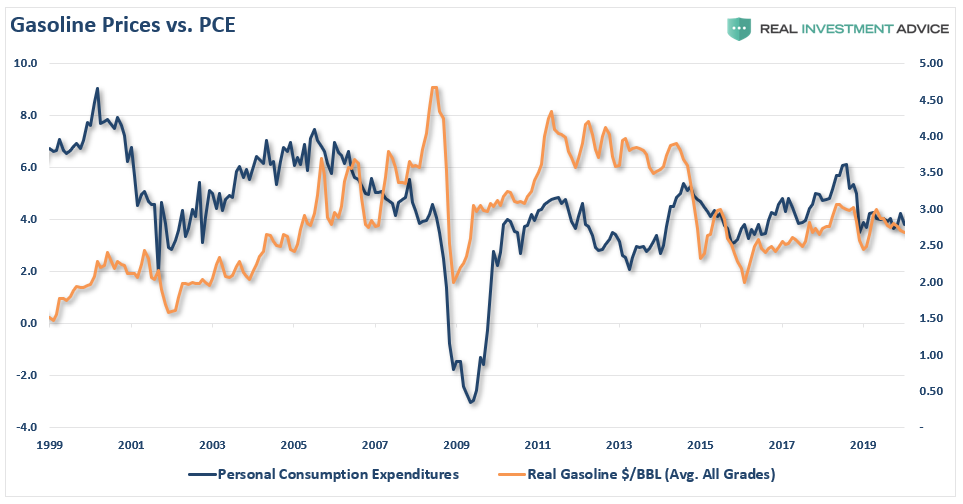
As shown, falling gasoline prices have historically equated to lower personal consumption expenditures, and not vice-versa. In fact higher oil and gasoline prices have actually been coincident with higher rates of PCE previously. The chart below show inflation-adjusted oil prices as compared to PCE.

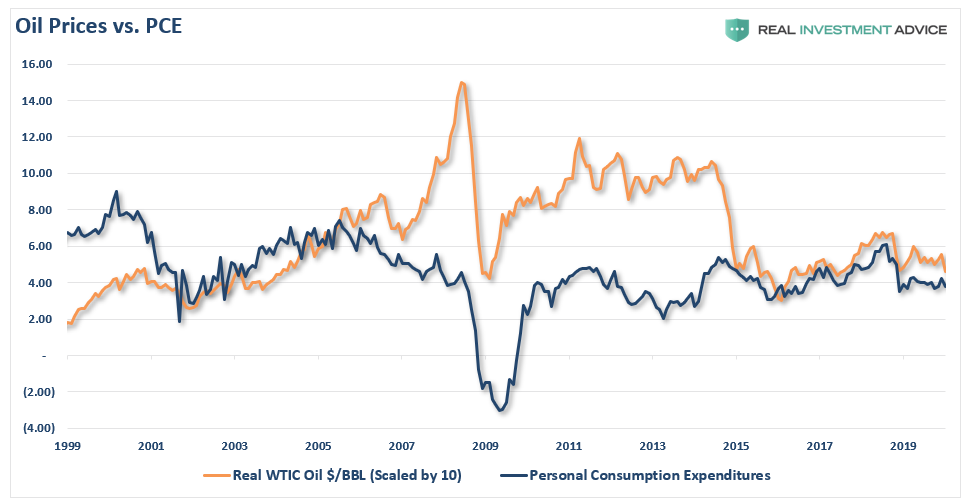
While the argument that declines in energy and gasoline prices should lead to stronger consumption sounds logical, the data suggests this is not the case.

What we find is there is a parity between oil price and the economy. Like “Goldilocks,” prices which are too hot, or too cold, has a negative impact on consumption and economic growth.

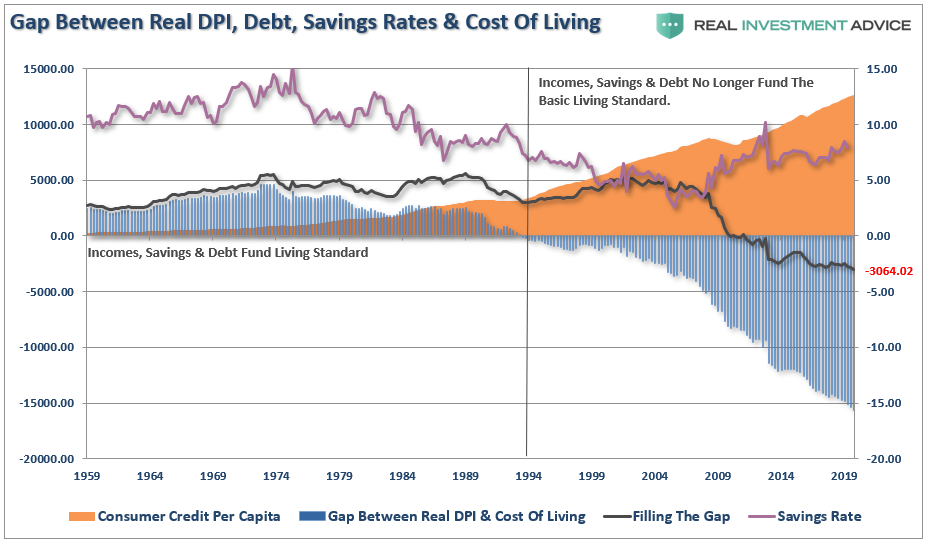
Importantly, regardless of the level of oil prices, the only thing which increases consumer spending are increases in INCOME, not SAVINGS. Consumers only have a finite amount of money to spend. They can choose to “save more” which is a drag on economic growth in the short-term (called the “paradox of thrift”), or they can spend what they have. But they can’t spend more, unless they take on more debt. 

Which is what has been occurring as individuals struggle to fill the gap between the cost of living and incomes. (Read more on this chart)

A Bigger Drag Than The Savings

Importantly, falling oil prices are a bigger drag on economic growth than the incremental “savings” received by the consumer.

The obvious ramification of the plunge in oil prices is to the energy sector itself. As oil prices decline, the loss of revenue eventually leads to cuts in production, declines in capital expenditure plans (which comprises almost 1/4th of all CapEx expenditures in the S&P 500), freezes and/or reductions in employment, not to mention the declines in revenue and profitability.

Let’s walk through the impact of lower oil prices on the economy.

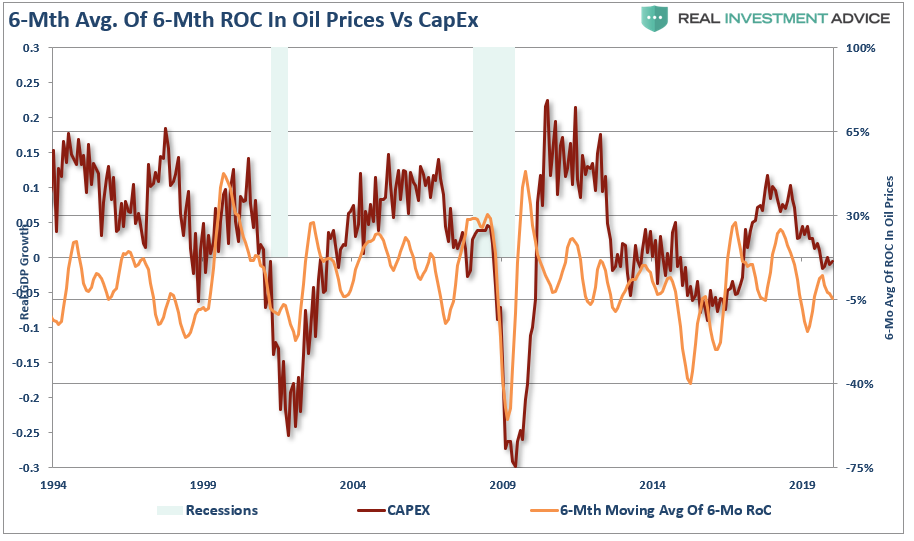
Declining oil prices lead to declining revenue for oil and gas companies. Given that drilling for oil is a very capital intensive process requiring a lot of manufactured goods, equipment, supplies, transportation, and support, the decrease in prices leads to a reduction in activity as represented by Capital Expenditures (CapEx.) The chart below shows the 6-month average of the 6-month rate of change in oil prices as compared to CapEx spending in the economy.

Of course, once CapEx is reduced the need for employment declines. However, since drilling for oil is a very intensive process, losses in employment may start with the energy companies, but eventually, all of the downstream suppliers are impacted by slower activity. As job losses rise, and incomes decline, it filters into the economy.

Importantly, when it comes to employment, the majority of the jobs “created” since the financial crisis has been lower wage-paying jobs in retail, healthcare and other service sectors of the economy. Conversely, the jobs created within the energy space are some of the highest wage paying opportunities available in engineering, technology, accounting, legal, etc.

In fact, each job created in energy-related areas has had a “ripple effect” of creating 2.8 jobs elsewhere in the economy from piping to coatings, trucking and transportation, restaurants and retail.

Given that oil prices are a reflection of global economic demand, falling oil prices have a negative feedback loop in the economy as a whole. The longer oil prices remain suppressed, the negative impacts of loss of employment, reductions in capital expenditures, and declines in corporate profitability will begin to outstrip any small economic benefit gained through consumption.

Simply put, lower oil and gasoline prices may actually have a bigger detraction on the economy than the “savings” provided to consumers.

Newton’s third law of motion states:

“For every action, there is an equal and opposite reaction.”

In any economy, nothing works in isolation. For every dollar increase that occurs in one part of the economy, there is a dollars’ worth of reduction somewhere else.

Where’s the Adult Merit Badge for Super Savers?

Super Savers are a special breed.

They are not concerned about keeping up impressions; they exist outside the mainstream of seductive consumerism.

Call it a mindset, call it walking a different path; perhaps it’s an offbeat childhood money script. Whatever it is, those who fall into this category or save 20% or more of their income on a consistent basis are members of an elite group who strive for early financial independence.

Speaking of independence: At RIA we believe households should maintain 3-6 months of living expenses in a savings account for emergencies like car and house repairs.  They should also maintain an additional 6 months of living expenses as a “Financial Vulnerability Cushion,”  whereby cash is set aside for the big, life-changing stuff like extended job loss especially as we believe the economy is in a late-stage expansionary cycle. Job security isn’t what it used to be; best to think ahead.

In 2018, TD Ameritrade in conjunction with Harris Poll, completed a survey among 1,503 U.S. adults 45 and older to understand the habits that set Super Savers apart from the pack. The results are not surprising. However, they do validate habits all of us should adopt regardless of age.

Like a physical exercise regimen, shifting into Super Saver mode takes small, consistent efforts that build on each other.

So, what lessons can be learned from this elite breed?

First, on average, Super Savers sock away 29% of their income compared to non-super savers. 

Super Savers place saving and investing over housing and household expenses.

Keep in mind, the Personal Saving Rate as of December 2019 according to the Federal Reserve Bank of St. Louis was a paltry 7.6%.  How does this group manage to accomplish such an arduous task? They abhor the thought of being house poor. They focus attention on the reduction of spending on the big stuff, or the fixed costs that make a huge impact to cash flow. Candidly, they’re not concerned about cutting out lattes as a viable strategy to save money. Super Savers spend 14% on housing, 16% on essential household expenses compared to non-supers who spend 23% and 21%, respectively. Any way you cut it, that’s impressive!

Perhaps it’s because Super Savers think backwards, always with a financially beneficial endgame in mind. There is great importance placed on financial security, peace of mind and freedom to do what they want at a younger age. They consider the cumulative impact of monthly payments on their bottom line, which is not common nature for the masses.  They internalize the opportunity cost of every large or recurring expenditure.

Super Savers weigh the outcome of every significant purchase, especially discretionary items, which invariably increases their hesitancy to spend. This manner of thought provides breathing room to deliberate less expensive alternatives and thoroughly investigate the pros and cons of their decisions.

Tip for the Super Saver in training: Sever the mental connection between monthly payments and affordability. How? First, calculate the interest cost of a purchase. For example, let’s say you’re looking to purchase an automobile. First, never go further than 36 months if you must make payments. Why? Because longer loan terms like 48 to 72 months is a payment mentality that will undoubtedly increase interest costs.

For example, let’s say an auto purchase is financed for $23,000. At 3.49% for 36 months, the payment is roughly $674 with total loan interest of $1,258. For 72 months, naturally there’s a lower monthly obligation – $354. However, total loan interest amounts to $2,525.

A Super Saver’s consideration would be on the interest incurred over the life of a loan, not the affordability of monthly payments. An important difference between this manner of thinking and most, is to meet a lifestyle, it’s common for households to go for the lowest monthly payment with little regard to overall interest paid. Super savers will either consider a less expensive option or adjust household budgets to meet higher payments just to pay less interest in the long run.

Second, Super Savers live enriching lives; they don’t deprive themselves.

Members of the super crowd don’t live small lives -a big misnomer. I think people are quick to spread this narrative to ease personal guilt or envy. Certainly, a fiscal discomfort mindset is part of who they are when they believe personal financial boundaries are breached. However, the TD Ameritrade survey shows that both super and non-super savers spend the same 7% of their income on vacations!

Third, starting early is key for Super Savers.

Per the study, more than half of Super Savers started investing by age 30 (54%).  I’m not a fan of personal finance dogma. Many of the stale tenets preached by the brokerage industry are part of a self-serving agenda to direct retail investor cash into cookie-cutter asset allocation portfolios; all to appease shareholders.

However, one rule I’m happily a complete sucker for is Pay Yourself First. It’s not just a good one. It’s the core, the very foundation, of every strong financial discipline. Why? Paying yourself first, whereby dollars are directed to savings or investments before anything else, reflects a commitment to delayed gratification. An honorable trait that allows the mental breathing room to avoid impulse buys, raise the bar on savings rates and minimize the addition of debt.

Per Ilene Strauss Cohen, Ph.D. for Psychology Today, people who learn how to manage their need to be satisfied in the moment thrive more in their careers, relationships, health and finances when compared to those who immediately give in to gratification. Again, the root of Pay Yourself First is delayed gratification; the concept goes back further than some of the concepts the financial industry has distorted just to part you from your money.

Fourth, Super Savers embrace the simple stuff.

When it comes to financial decisions, basics work. For example, Super Savers avoid high-interest debt (65% vs. 56% for non-super savers),  stick to a budget (60% vs. 49%), invest in the market (58% vs. 34%) and max out retirement savings (55% vs. 30%).

Listen, these steps aren’t rocket science; they’re basic financial literacy.

For example, I’ve been ‘pencil & paper’ budgeting since I began my Daily News Brooklyn paper route at age 11. Budgeting over time fosters an awareness of household cash flow.  Try micro-budgeting for a few months. It will help you intimately engage with  personal spending trends.

Micro-budgets are designed to increase awareness through simplicity.

Yes, they’re a bit time-consuming, occasionally monotonous; however the goal is worth it – to uncover weaknesses and strengths in your strategy and build a sensitivity to household cash-flow activities. My favorite old-school book for budgeting comes from the Dome companies. For a modest investment of $6.50, a Dome Budget Book is one of the best deals on the market.

Last, Super Savers believe in diversified streams of income and accounts!

44% of Super Savers prefer to bolster already impressive savings rates by funding diversified sources of income, compared to only 36% of their non-super brethren. In addition, Super Savers are especially inclined to lean into Roth IRAs compared to non-super savers. It is rewarding to discover how the best of savers seek various income streams to build their top-line.  They are also tremendous believers in Roth IRAs. The reason I’m glad is this information further validates why our advisors and financial planning team members have passionately communicated the importance of the diversification of accounts for several years.

Super Savers build the following income streams outside of employment income – Dividends, investment real estate, annuities (yes, annuities – 21% vs. 14% for non-super savers), and business ownership (14% compared to 8%).

Their retirement accounts are diversified; over 53% of Super Savers embrace Roth options (53% compared to 29%). A great number of Super Savers fund Health Savings Accounts and strive to defer distributions until retirement when healthcare costs are expected to increase.

Why diversification of accounts?

Imagine never being able to switch lanes as you head closer to the destination called retirement. Consider how suffocating it would be to never be able to navigate away from a single-lane road where all distributions are taxed as ordinary income. There lies the dysfunctional concept that Super Savers are onto – They do not believe every investment dollar should be directed to pre-tax retirement accounts.

Congratulations -With the full support of the financial services industry you’ve created a personal tax time bomb!

As you assess the terrain for future distributions, tax diversification should be a priority.  Envision a retirement paycheck that’s a blend of ordinary, tax-free and capital gain income (generally taxed at lower rates than ordinary income). The goal is to gain the ability to customize your withdrawal strategy to minimize tax drag on distributions throughout retirement. Super Savers have figured this out. Regardless of your savings habits, you should too.

Many studies show that super savers are independent thinkers. Working to create and maintain a lifestyle that rivals their neighbors is anathema to them.

Now, as a majority of Americans are utilizing debt to maintain living standards, Super Savers set themselves apart as a badge of courage. No doubt this group is unique and are way ahead at crafting a secure, enjoyable retirement. and financial flexibility. Whatever steps taken to join their ranks will serve and empower you with choices that those with overwhelming debt cannot consider.

And speaking of badges: Did you know Amazon sells Merit badges for adulting? It’s true. I believe they need to add a “I’M A SUPER SAVER” badge to the collection.

If you’d like to read the complete T.D. Ameritrade survey, click here.

Pulling Forward versus Paying Forward

Debt allows a consumer (household, business, or government) to pull consumption forward or acquire something today for which they otherwise would have to wait. When the primary objective of fiscal and monetary policy becomes myopically focused on incentivizing consumers to borrow, spend, and pull consumption forward, there will eventually be a painful resolution of the imbalances that such policy creates. The front-loaded benefits of these tactics are radically outweighed by the long-term damage they ultimately cause.

Due to the overwhelming importance that the durability of economic growth has on future asset returns, we take a new approach in this article to drive home a message from our prior article The Death of the Virtuous Cycle. In this article, we use two simple examples to demonstrate how the Virtuous Cycle (VC) and Un-Virtuous Cycle (U-VC) have benefits and costs to society that play out over time.

The Minsky Moment

Before walking you through the examples contrasting the two economic cycles, it is important to put debt into its proper context. Debt can be used productively to benefit the economy in the long term, or it can be used to fulfill materialistic needs and to temporarily stimulate economic growth in the short term. While both uses of debt look the same on a balance sheet, the effect that each has on the borrower and the economy over time is remarkably different.

In the course of his life’s work as an economist, Hyman Minsky focused on the factors that cause financial market fragility and how extreme circumstances eventually resolve themselves. Minsky, who died in 1996, only recently became “famous” as a result of the sub-prime mortgage debacle and ensuing financial crisis in 2008. 

Minsky elaborated on his “stability breeds instability” theory by identifying three types of borrowers and how they evolve to contribute to the accumulation of insolvent debt and inherent instability.

  • Hedge borrowers can make interest and principal payments on debt from current cash flows generated from existing investments.
  • Speculative borrowers can cover the interest on the debt from the investment cash flows but must regularly refinance, or “roll-over,” the debt as they cannot pay off the principal.
  • Ponzi borrowers cannot cover the interest payments or the principal on debt from the investment cash flows, but believe that the appreciation of the investments will be sufficient to refinance outstanding debt obligations when the investment is sold.

Over the past 20 years, investors have been witness to a remarkable sequence of bubbles. The first culminated when an abundance of Ponzi borrowers concentrated their investments in the equity markets and technology stocks in particular. Technology companies, frequently with operating losses, raised capital through stock and debt offerings from investors who believed excessive valuations could expand indefinitely.

The second bubble emerged in housing. Many home buyers acquired houses via mortgages payments they could in no way afford, but believed house prices would rise indefinitely allowing them to service their mortgage obligations via the extraction of equity.

Today, we are witnessing a broader asset price inflation driven by a belief that central banks will engage in extraordinary monetary policy indefinitely to prop up valuations in the hope for the always “just around the corner” wealth effect. Equity markets are near all-time highs and at extreme valuations despite weak economic growth and limited earnings growth. Bond yields are near the lowest levels (highest prices) human civilization has ever seen. Commercial real estate is back at 2007 bubble valuations and real assets such as art, wine, and jewelry are enjoying record-setting bidding at auction houses.

These financial bubbles could not occur in an environment of weak domestic and global economic growth without the migration of debt borrowers from hedge to speculative to Ponzi status.

Compare and Contrast

The tables below summarize two extreme economic models to exhibit how an economy dependent upon “Ponzi” financing compares to one in which savings are prioritized. In both cases, we show how the respective financial decisions influence consumption, profits, and wages.

Table 1, below, is based on the assumption that consumers spend 100% of their wages and borrow an additional amount equivalent to 10% of their income annually for ten years straight. The debt amortizes annually and is therefore retired in full in 20 years.  

Assumptions: Debt is borrowed each year for the first ten years at a 5% interest rate and ten year term, corporate profits and employee wages are 7% and 3% of consumption respectively, annual income is constant at $100,000 per year. 

Table 2, below, assumes consumers spend 90% of wages, save and invest 10% a year, and do not borrow any money. The table is based on the work of Henry Hazlitt from his book Economics in One Lesson.  

Assumptions: Productivity growth is 2.5% per year, corporate profits and employee wages are 7% and 3% of consumption respectively.

Table 1 is the U-VC and Table 2 is the VC. The tables illustrate that there are immediate economic benefits of borrowing and economic costs of saving. For example, in year one, consumption in Table 1 rises as a result of the new debt ($100,000 to $108,705) and wages and corporate profits follow proportionately. Conversely, table 2 exhibits an initial $10,000 decline in consumption to $90,000, and a similar decline in wages and corporate profits as a result of deferring consumption on 10% of the income that was designated for saving and investing.

After year one, however, the trends begin to reverse. In the U-VC example (Table 1), when new debt is added, debt servicing costs rise, and the marginal benefits of additional debt decline. By year eight, debt service costs ($10,360) are larger than the additional new debt ($10,000). At that point, without lower interest rates or larger borrowings, consumption will fall below the income level.

Conversely, in the VC example (Table 2), savings and investments engender productivity growth, which drives wages, profits, and consumption higher.

The graphs below highlight the consumption and wage trends from both tables.

As illustrated in both graphs, the short term justification for promoting the U-VC is prompt economic growth. Equally important, the reason that savings and investments in the VC are admonished is that they require discipline and a period of lesser growth, profits, and wages.

Debt-fueled consumption is an expedient measure to take when economic growth stalls and immediate economic recovery is demanded. While the marginal benefits of such action fade quickly, a longer-term policy that consistently encourages greater levels of debt and lower debt servicing costs can extend the beneficial economic effects for years, fooling many consumers, economists and business leaders into believing these activities are sustainable.

In the tables above, it takes almost seven years before consumption in the VC (Table 2) is greater than in U-VC (Table 1).  However, after that breakeven point, the benefits of a VC become evident as economic growth compounds at an increasing rate, quickly surpassing the stagnating trends occurring under the U-VC.

In the real world, VC or U-VC economies do not exist. Economies tend to exhibit characteristics of both cycles. In the United States, for example, some consumers and corporations are saving, investing, and generating productive economic gains. Productivity gains from years past are still providing benefits as well.  However, over the past 30 years, consumers have increasingly opted to borrow and consume in a Ponzi-like manner and neglect savings. In other words, the U.S. economy has increasingly favored “Ponzi” debt-fueled consumption and denied the benefits of savings and the VC. Then again, U.S. leadership has only encouraged these behavioral patterns through imprudent fiscal and monetary policies.

The U.S. and many other countries are once again approaching what has been deemed the Minsky Moment.  Similar to 2008, this is the point when debt becomes unserviceable and a sharp increase in defaults is unavoidable. Will the Federal Reserve be able to once again reignite “Ponzi” borrowing to suspend that outcome?

Summary

The U.S. and many other countries are forced to deal with the consequences of economic policy actions, borrowing, and consumption behaviors from years past. While the present economic situation is troubling, leadership is obligated to reflect on past choices and move forward with changes that are in the best interest of the country and its entire population. As our title suggests, we can continue to try to pull consumption forward and further harm future growth, or we can save and reward future generations with productivity gains resulting in greater economic growth and prosperity. 

Shifting direction, and “paying forward,” via more savings and investments and the deferral of some consumption, comes with immediate negative consequences to wages, profits, and economic growth. Nothing worth having is easy, as the saying goes. However, over time, the discipline is rewarded, and the economy can be on a more sustainable, prosperous path.

These economic concepts, tables, and graphs extend an accurate diagnosis of the “Death of the Virtuous Cycle.” They are intended to help investment managers better understand the costs and benefits of saving versus borrowing from a macroeconomic perspective. If successful in that endeavor, the substance of this article will afford managers better ideas about how to navigate a very uncertain investment landscape. The implications for the sustainability of economic growth and therefore long term asset returns are profound and the bedrock of all investment decisions.