Negative Gamma and the Demise of Optionsellers.com
Brett Freeze, one of my financial market mentors, has several rules that summarize his core trading beliefs. His first rule is “never, ever be short gamma.”
More simply, the rule could read “never sell uncovered options.” Anyone who has received a margin call on their uncovered option positions understands intimately why this is a prudent rule. Options are a leveraged bet on an underlying security, so when price moves against the option, the financial losses and margin calls can happen quickly and are virtually unlimited.
For Optionsellers.com, a hedge fund that had to shut down in late 2018, selling uncovered options was the explicit strategy. It is in their name, after all.
In hindsight, we might conclude that naked selling of options is better handled by machine-driven market makers (banks/brokers). The market makers instantaneously can hedge their exposure with other options positions and long/short positions in the underlying security. The market makers can not only instantaneously lay off risk, they can also respond to volatility more quickly, and adjust positions accordingly. The market makers limit their risk in a way that most individuals and hedge funds cannot.
I am not attempting to arm-chair quarterback the demise of Optionsellers.com, nor do I want to “kick anyone while they are down.” We all make mistakes, and none of us enjoy failure, especially in the public square. I sincerely wish the best for the principals and investors in Optionsellers.com, and hope all matters are resolved with fairness. I had an account with MF Global when it went under, so I understand the feeling of bewilderment many investors must feel.
It has been said that wisdom is learning from the mistakes of others, so our intention here is to understand what happened, and learn from it. As a starting point, retail traders might consider Brett Freeze’s rule #1 – “never ever be short gamma.”
Gamma Squeeze
Options traders closely watch the value of delta and gamma. Delta is a measure of the volatility of an option price, and gamma is a measure of the volatility of delta. In my daily report, I publish the value at which delta and gamma will be neutral for a given security. We define “gamma neutral” as the price level at which the total options market gamma would equal zero.
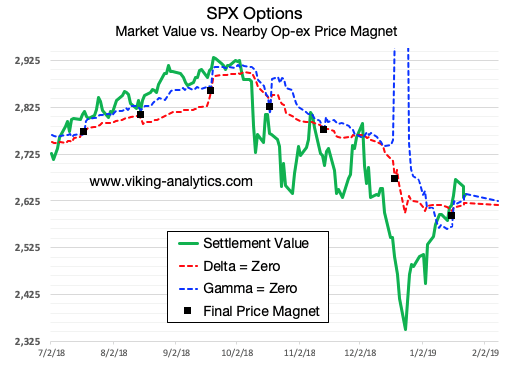
Over the past several months, there have been two high-profile occasions where neutral gamma spiked far from the value of the underlying security. The first time coincided with the collapse of optionsellers.com in mid-November 2018, and the second time was the stock market declines before Christmas 2018. We intend to cover the S&P gamma in another article.
The simple explanation for the collapse of Optionsellers.com was that the fund was net short natural gas options, and the price in the natural gas (NG) market spiked. In options parlance, the fund was short gamma and the market moved violently in the opposite direction. Optionsellers.com was not the only fund that was short the options market at that time, of course. The natural gas options market was as a whole sitting on the wrong side of the boat the time that the price surge occurred, and we can see that in the data that I publish each morning.
With the options market tilted net short, the spike in November natural gas prices turned into an old-fashioned short squeeze. Optionsellers.com and the many net short NG traders had to cover their positions. Short covering plus momentum long trading equals “squeeze” and in this case it became an eye popping upward move.
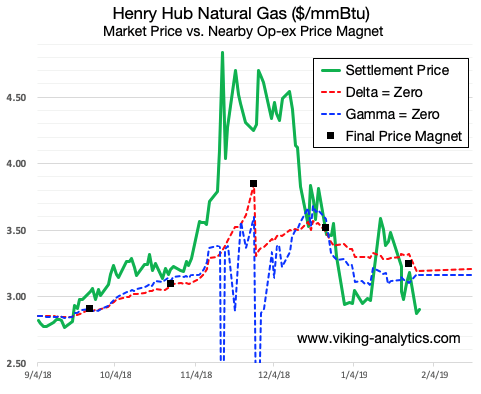
The chart above shows the underlying natural gas futures price in green, the point of neutral delta in red and the point of neutral gamma in blue. For reasons that can be explained by order flow, the red and green line will tend to converge on or before the options expiration date (black box.) The blue and the green line will also tend to converge, but if the blue line moves way out of range in the other direction, then we can see a short or a long squeeze of one kind or another, such as in mid- and late-November.
Final Thoughts
These are advanced topics, and I have learned considerably from interacting with many of my readers and subscribers. If you would like to join in this discussion, please drop me an e-mail at admin@viking-analytics.com, and/or visit my page on Price Magnets at www.viking-analytics.com to learn more.
I have no specific knowledge of anything related to the Optionsellers.com recent demise other than what has been openly published on the internet.