Tag Archives: oil

Where “I Bought It For The Dividend” Went Wrong

In early 2017, I warned investors about the “I bought it for the dividend” investment thesis. To wit:

“Company ABC is priced at $20/share and pays $1/share in a dividend each year. The dividend yield is 5%, which is calculated by dividing the $1 cash dividend into the price of the underlying stock.

Here is the important point. You do NOT receive a ‘yield.’

What you DO receive is the $1/share in cash paid out each year.

Yield is simply a mathematical calculation.

At that time, the article was scoffed at because we were 8-years into an unrelenting bull market where even the most stupid of investments made money.

Unfortunately, the “mean reversion” process has taken hold, which is the point where the investment thesis falls apart.

The Dangers Of “I Bought It For The Dividend”

“I don’t care about the price, I bought it for the yield.”

First of all, let’s clear up something.

In January of 2018, Exxon Mobil, for example, was slated to pay an out an annual dividend of $3.23, and was priced at roughly $80/share setting the yield at 4.03%. With the 10-year Treasury trading at 2.89%, the higher yield was certainly attractive.

Assuming an individual bought 100 shares at $80 in 2018, “income” of $323 annually would be generated.

Not too shabby.

Fast forward to today with Exxon Mobil trading at roughly $40/share with a current dividend of $3.48/share.

Investment Return (-$4000.00 ) + Dividends of $323 (Yr 1) and $343 (Yr 2)  = Net Loss of $3334

That’s not a good investment.

In just a moment, we will come and revisit this example with a better process.

There is another risk, which occurs during “mean reverting” events, that can leave investors stranded, and financially ruined.

Dividend Loss

When things “go wrong,” as they inevitably do, the “dividend” can, and often does, go away.

  • Boeing (BA)
  • Marriott (MAR)
  • Ford (F)
  • Delta (DAL)
  • Freeport-McMoRan (FCX)
  • Darden (DRI)

These companies, and many others, have all recently cut their dividends after a sharp fall in their stock prices.

I previously posted an article discussing the “Fatal Flaws In Your Financial Plan” which, as you can imagine, generated much debate. One of the more interesting rebuttals was the following:

If a retired person has a portfolio of high-quality dividend growth stocks, the dividends will most likely increase every single year. Even during the stock market crashes of 2002 and 2008, my dividends continued to grow. The total value of the portfolio will indeed fluctuate every year, but that is irrelevant since the retired person is living off his dividends and never selling any shares of stock.

Dividends usually go up even when the stock market goes down.

This comment is the basis of the “buy and hold” mentality, and many of the most common investing misconceptions.

Let’s start with the notion that “dividends always increase.”

When a recession/market reversion occurs, the “cash dividends” don’t increase, but the “yield” does as prices collapse. However, your INCOME does NOT increase. There is a risk it will decline as companies cut the dividend or eliminate it.

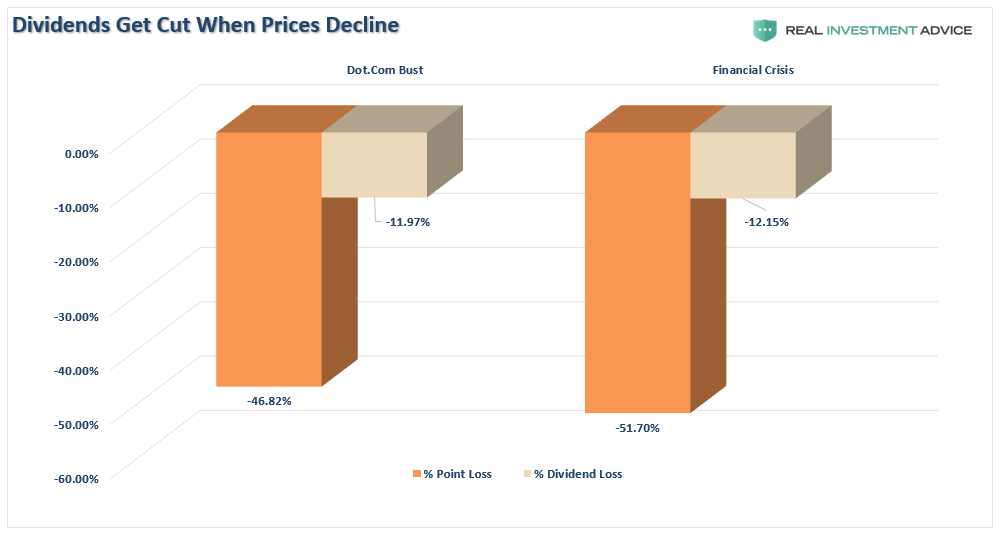
During the 2008 financial crisis, more than 140 companies decreased or eliminated their dividends to shareholders. Yes, many of those companies were major banks; however, leading up to the financial crisis, there were many individuals holding large allocations to banks for the income stream their dividends generated. In hindsight, that was not such a good idea.

But it wasn’t just 2008. It also occurred dot.com bust in 2000. In both periods, while investors lost roughly 50% of their capital, dividends were also cut on average of 12%.

While the current market correction fell almost 30% from its recent peak, what we haven’t seen just yet is the majority of dividend cuts still to come.

Naturally, not EVERY company will cut their dividends. But many did, many will, and in quite a few cases, I would expect dividends to be eliminated entirely to protect cash flows and creditors.

As we warned previously:

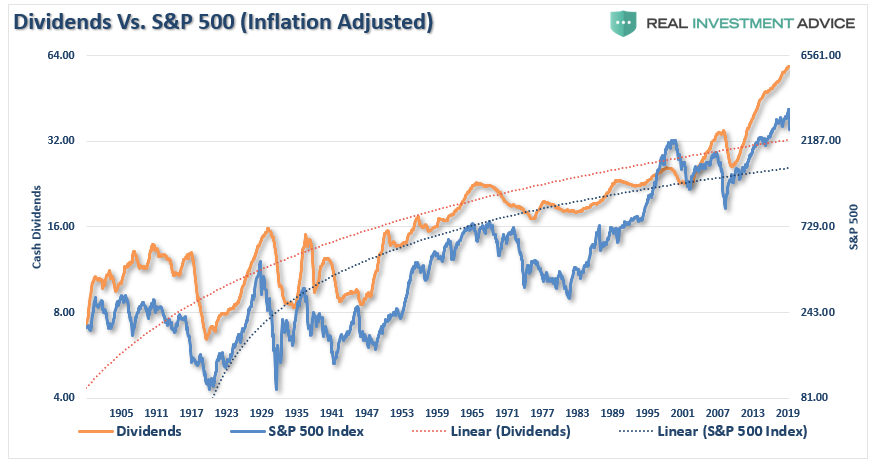
“Due to the Federal Reserve’s suppression of interest rates since 2009, investors have piled into dividend yielding equities, regardless of fundamentals, due to the belief ‘there is no alternative.’ The resulting ‘dividend chase’ has pushed valuations of dividend-yielding companies to excessive levels disregarding underlying fundamental weakness. 

As with the ‘Nifty Fifty’ heading into the 1970s, the resulting outcome for investors was less than favorable. These periods are not isolated events. There is a high correlation between declines in asset prices, and the dividends paid out.”

Love Dividends, Love Capital More

I agree investors should own companies that pay dividends (as it is a significant portion of long-term total returns)it is also crucial to understand that companies can, and will, cut dividends during periods of financial stress.

It is a good indicator of the strength of the underlying economy. As noted by Political Calculations recently:

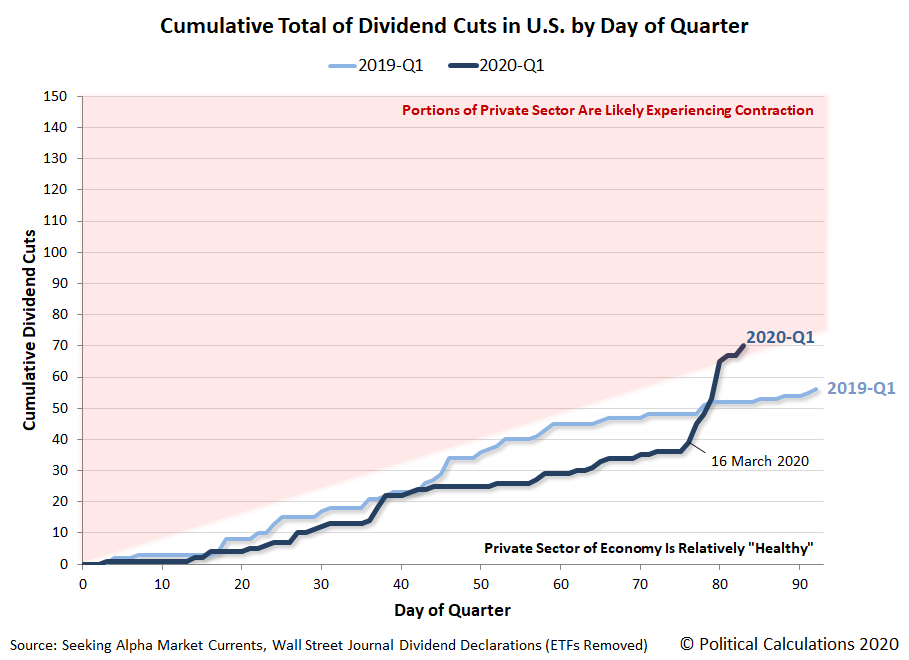
Dividend cuts are one of the better near-real-time indicators of the relative health of the U.S. economy. While they slightly lag behind the actual state of the economy, dividend cuts represent one of the simplest indicators to track.

In just one week, beginning 16 March 2020, the number of dividend cuts being announced by U.S. firms spiked sharply upward, transforming 2020-Q1 from a quarter where U.S. firms were apparently performing more strongly than they had in the year-ago quarter of 2019-Q1 into one that all-but-confirms that the U.S. has swung into economic contraction.

Not surprisingly, the economic collapse, which will occur over the next couple of quarters, will lead to a massive round of dividend cuts. While investors lost 30%, or more in many cases, of their capital, they will lose the reason they were clinging on to these companies in the first place.

You Can’t Handle It

EVERY investor has a point, when prices fall far enough, regardless of the dividend being paid, they WILL capitulate, and sell the position. This point generally comes when dividends have been cut, and capital destruction has been maximized.

While individuals suggest they will remain steadfast to their discipline over the long-term, repeated studies show that few individuals actually do. As noted just recently is “Missing The 10-Best Days:”

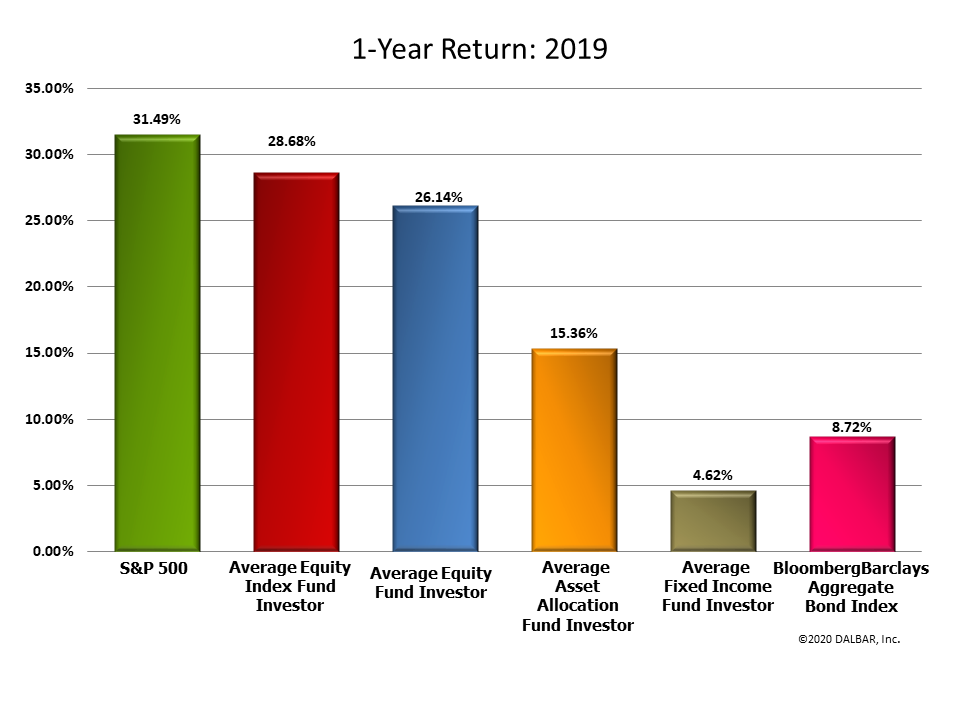
“As Dalbar regularly points out, individuals always underperform the benchmark index over time by allowing “behaviors” to interfere with their investment discipline. In other words, investors regularly suffer from the ‘buy high/sell low’ syndrome.”

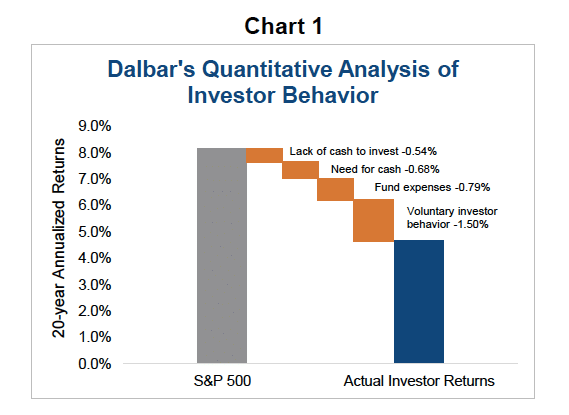
Behavioral biases, specifically the “herding effect” and “loss aversion,” repeatedly leads to poor investment decision-making. In fact, Dalbar is set to release their Investor Report for 2020, and they were kind enough to send me the following graphic for investor performance through 2019. (Pre-Order The Full Report Here)

These differentials in performance can all be directly traced back to two primary factors:

  • Psychology
  • Lack of capital

Understanding this, it should come as no surprise during market declines, as losses mount, so does the pressure to “avert further losses” by selling. While it is generally believed dividend-yielding stocks offer protection during bear market declines, we warned previously this time could be different:

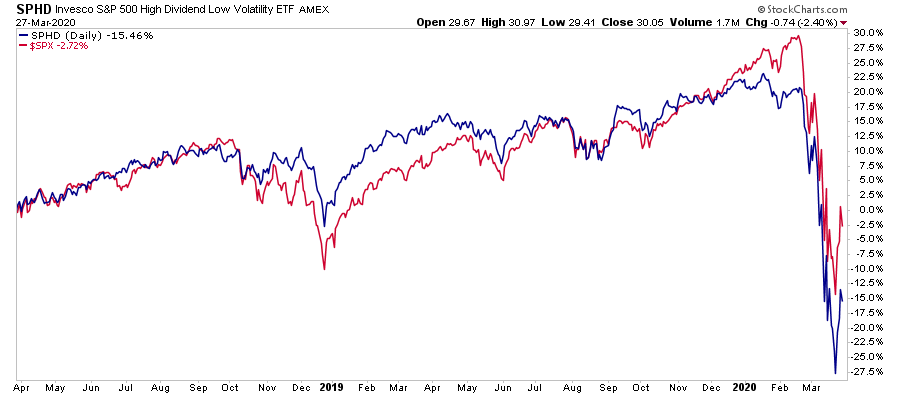
“The yield chase has manifested itself also in a massive outperformance of ‘dividend-yielding stocks’ over the broad market index. Investors are taking on excessive credit risk which is driving down yields in bonds, and pushing up valuations in traditionally mature companies to stratospheric levels. During historic market corrections, money has traditionally hidden in these ‘mature dividend yielding’ companies. This time, such rotation may be the equivalent of jumping from the ‘frying pan into the fire.’” 

The chart below is the S&P 500 High Dividend Low Volatility ETF versus the S&P 500 Index. During the recent decline, dividend stocks were neither “safe,” nor “low volatility.” 

But what about previous “bear markets?” Since most ETF’s didn’t exist before 2000, we can look at the “strategy” with a mutual fund like Fidelity’s Dividend Growth Fund (FDGFX)

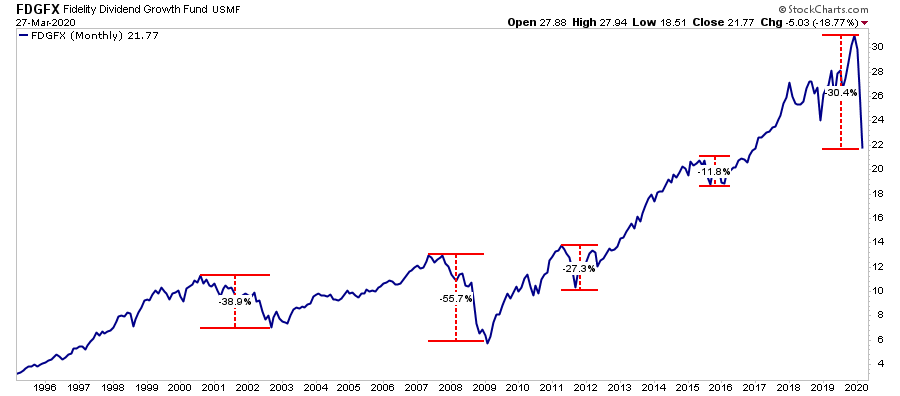
As you can see, there is little relative “safety” during a market reversion. The pain of a 38%, 56%, or 30%, loss, can be devastating particularly when the prevailing market sentiment is one of a “can’t lose” environment. Furthermore, when it comes to dividend-yielding stocks, the psychology is no different; a 3-5% yield, and a 30-50% loss of capital, are two VERY different issues.

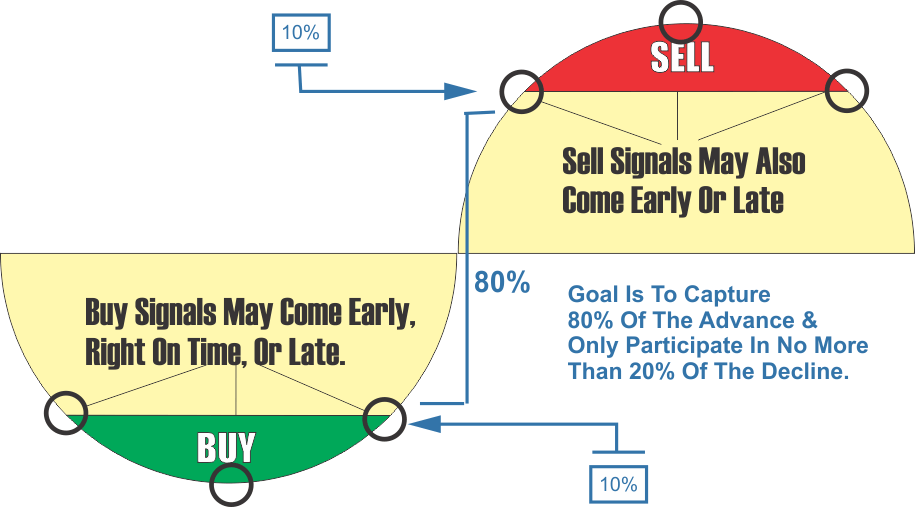
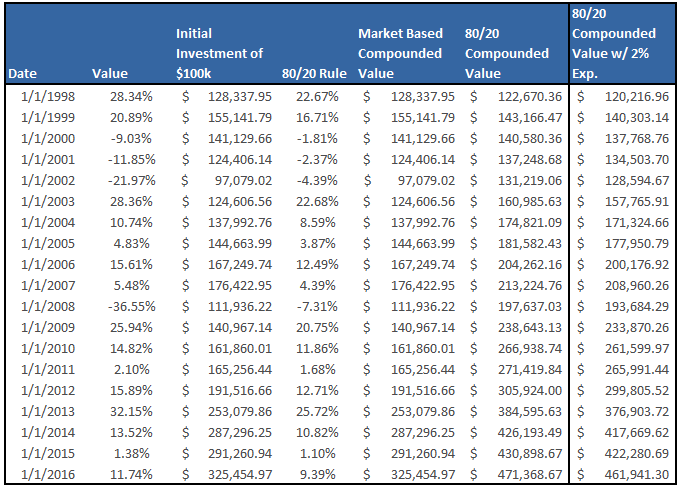
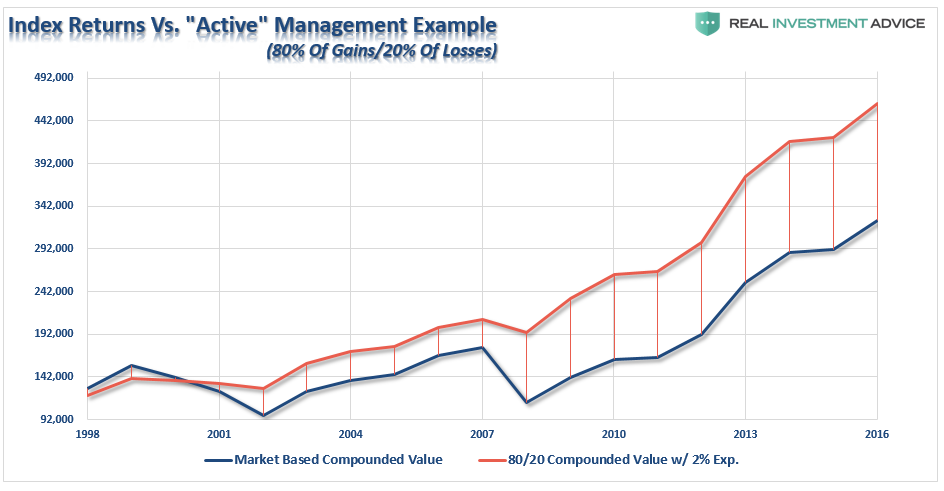
A Better Way To “Invest For The Dividend”

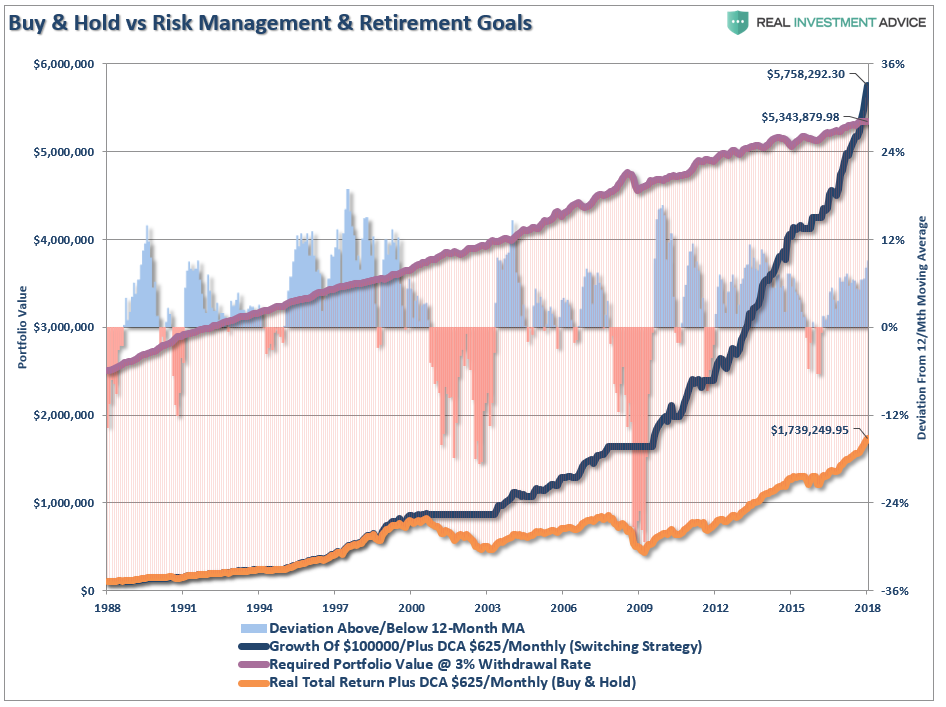
“Buy and hold” investing, even with dividends and dollar-cost-averaging, will not get you to your financial goals. (Click here for a discussion of chart)

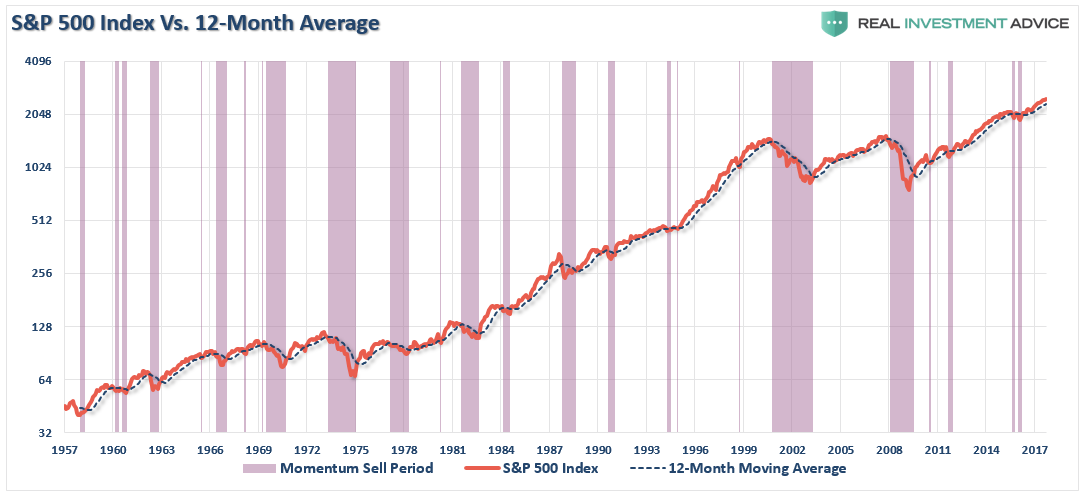
So, what’s the better way to invest for dividends? Let’s go back to our example of Exxon Mobil for a moment. (This is for illustrative purposes only and not a recommendation.)

In 2018, Exxon Mobil broke below its 12-month moving average as the overall market begins to deteriorate.

If you had elected to sell on the break of the moving average, your exit price would have been roughly $70/share. (For argument sake, you stayed out of the position even though XOM traded above and below the average over the next few months.)  

Let’s rerun our math from above.

  • In 2018, an individual bought 100 shares at $80.
  • In 2019, the individual sold 100 shares at $70.

Investment Return (-$1000.00 ) + Dividends of $323 (Yr 1) and $343 (Yr 2)  = Net Loss of $334

Not to bad.

Given the original $8,000 investment has only declined to $7,666, the individual could now buy 200 shares of Exxon Mobil with a dividend of $3.48 and a 9.3% annual yield.

Let’s compare the two strategies.

  • Buy And Hold: 100 shares bought at $80 with a current yield of 4.35% 
  • Risk Managed: 200 shares bought at $40 with a current yield of 9.3%

Which yield would you rather have in your portfolio?

In the end, we are just human. Despite the best of our intentions, emotional biases inevitably lead to poor investment decision-making. This is why all great investors have strict investment disciplines they follow to reduce the impact of emotions.

I am all for “dividend investment strategies,” in fact, dividends are a primary factor in our equity selection process. However, we also run a risk-managed strategy to ensure we have capital available to buy strong companies when the opportunity presents itself.

The majority of the time, when you hear someone say “I bought it for the dividend,” they are trying to rationalize an investment mistake. However, it is in the rationalization that the “mistake” is compounded over time. One of the most important rules of successful investors is to “cut losers short and let winners run.” 

Unfortunately, the rules are REALLY hard to follow. If they were easy, then everyone would be wealthy from investing. They aren’t because investing without a discipline and strategy has horrid consequences.

Falling Oil Prices An Economic Warning Sign

On Tuesday morning, I got engaged in a debate on the recent decline in oil prices following my report on COT Positioning in the space. To wit:

“The inherent problem with this is that if crude oil breaks below $48/bbl, those long contracts will start to get liquidated which will likely push oil back into the low 40’s very quickly. The decline in oil is both deflationary and increases the risk of an economic recession.”

It didn’t take long before the debate started.

“Aren’t low oil prices good for the economy? They are a tax cut for the consumer?”

There is an old axiom which states that if you repeat a falsehood long enough, it will eventually be accepted as fact.

Low oil prices equating to stronger economic growth is one of those falsehoods.

Oil prices are indeed crucial to the overall economic equation, and there is a correlation between the oil prices, inflation, and interest rates.

Given that oil is consumed in virtually every aspect of our lives, from the food we eat to the products and services we buy, the demand side of the equation is a tell-tale sign of economic strength or weakness. We can see this clearly in the chart below which combines rates, inflation, and GDP into one composite indicator. One important note is that oil tends to trade along pretty defined trends (black trend lines) until it doesn’t. Importantly, since the oil industry is very manufacturing and production intensive, breaks of price trends tend to be liquidation events which has a negative impact on manufacturing and CapEx spending and feeds into the GDP calculation.

“It should not be surprising that sharp declines in oil prices have been coincident with downturns in economic activity, a drop in inflation, and a subsequent decline in interest rates.

We can also view the impact of oil prices on inflation by looking at breakeven inflation rates as well.

The short version is that oil prices are a reflection of supply and demand. Global demand has already been falling for the last several months, and oil prices are sending warnings that “market hopes” for a “global reflation” are likely not a reality. More importantly, falling oil prices are going to put the Fed in a very tough position in the next couple of months as deflationary pressures rise. The chart below shows breakeven 5-year and 10-year inflation rates versus oil prices.

Zero Sum

The argument that lower oil prices give consumers more money to spend certainly seems entirely logical. Since we know that roughly 80% of households in America effectively live paycheck-to-paycheck, they will spend, rather than save, any extra disposable income.

However, here is the most important part of the fallacy:

“Spending in the economy is a ZERO-SUM game.”

Falling oil prices are an excellent example since gasoline sales are part of the retail sales calculation.

Let’s take a look at the following example:

  • Oil Prices Decline By $10 Per Barrel
  • Gasoline Prices Fall By $1.00 Per Gallon
  • Consumer Fills Up A 16 Gallon Tank Saving $16 (+16)
  • Gas Station Revenue Falls By $16 For The Transaction (-16)
  • End Economic Result = $0

Now, the argument is that the $16 saved by the consumer will be spent elsewhere, which is true. However, this is the equivalent of “rearranging deck chairs on the Titanic.”

So, let’s now extend our example from above.

Oil and gasoline prices have dropped, so Elaine, who has budgeted $100 to spend each week on retail-related purchases, goes to the gas station to fill up.

  • Elaine fills up her car for $60, which previously cost $80. (Savings +$20)
  • Elaine then spends her normal $20 on lunch with her friends. 
  • She then spends her additional $20 (saved from her gas bill) on some flowers for the dining room.

————————————————-
Total Spending For The Week = $100

Now, economists quickly jump on the idea that because she spent $20 on flowers, there has been an additional boost to the economy.

However, this is not the case. Elaine may have spent her money differently this past week, but she still spent the same amount. Here is the net effect on the economy.

Gasoline Station Revenue = (-$20)
Flower Store Revenue = +$20
—————————————————-
Net Effect To Economy = $0

Graphically, we can show this by analyzing real (inflation-adjusted) gasoline prices compared to total Personal Consumption Expenditures (PCE). I am using “PCE” as it is the broadest measure of consumer spending and comprises almost 70% of the entire GDP calculation.

As shown, falling gasoline prices have historically equated to lower personal consumption expenditures, and not vice-versa. In fact higher oil and gasoline prices have actually been coincident with higher rates of PCE previously. The chart below show inflation-adjusted oil prices as compared to PCE.

While the argument that declines in energy and gasoline prices should lead to stronger consumption sounds logical, the data suggests this is not the case.

What we find is there is a parity between oil price and the economy. Like “Goldilocks,” prices which are too hot, or too cold, has a negative impact on consumption and economic growth.

Importantly, regardless of the level of oil prices, the only thing which increases consumer spending are increases in INCOME, not SAVINGS. Consumers only have a finite amount of money to spend. They can choose to “save more” which is a drag on economic growth in the short-term (called the “paradox of thrift”), or they can spend what they have. But they can’t spend more, unless they take on more debt. 

Which is what has been occurring as individuals struggle to fill the gap between the cost of living and incomes. (Read more on this chart)

A Bigger Drag Than The Savings

Importantly, falling oil prices are a bigger drag on economic growth than the incremental “savings” received by the consumer.

The obvious ramification of the plunge in oil prices is to the energy sector itself. As oil prices decline, the loss of revenue eventually leads to cuts in production, declines in capital expenditure plans (which comprises almost 1/4th of all CapEx expenditures in the S&P 500), freezes and/or reductions in employment, not to mention the declines in revenue and profitability.

Let’s walk through the impact of lower oil prices on the economy.

Declining oil prices lead to declining revenue for oil and gas companies. Given that drilling for oil is a very capital intensive process requiring a lot of manufactured goods, equipment, supplies, transportation, and support, the decrease in prices leads to a reduction in activity as represented by Capital Expenditures (CapEx.) The chart below shows the 6-month average of the 6-month rate of change in oil prices as compared to CapEx spending in the economy.

Of course, once CapEx is reduced the need for employment declines. However, since drilling for oil is a very intensive process, losses in employment may start with the energy companies, but eventually, all of the downstream suppliers are impacted by slower activity. As job losses rise, and incomes decline, it filters into the economy.

Importantly, when it comes to employment, the majority of the jobs “created” since the financial crisis has been lower wage-paying jobs in retail, healthcare and other service sectors of the economy. Conversely, the jobs created within the energy space are some of the highest wage paying opportunities available in engineering, technology, accounting, legal, etc.

In fact, each job created in energy-related areas has had a “ripple effect” of creating 2.8 jobs elsewhere in the economy from piping to coatings, trucking and transportation, restaurants and retail.

Given that oil prices are a reflection of global economic demand, falling oil prices have a negative feedback loop in the economy as a whole. The longer oil prices remain suppressed, the negative impacts of loss of employment, reductions in capital expenditures, and declines in corporate profitability will begin to outstrip any small economic benefit gained through consumption.

Simply put, lower oil and gasoline prices may actually have a bigger detraction on the economy than the “savings” provided to consumers.

Newton’s third law of motion states:

“For every action, there is an equal and opposite reaction.”

In any economy, nothing works in isolation. For every dollar increase that occurs in one part of the economy, there is a dollars’ worth of reduction somewhere else.

Looking Beyond Apple and Microsoft

As the 1970s came to a close, six of the world’s ten largest companies were in the oil exploration, drilling, and services business. Just a few years earlier, on April 1, 1976, Steven Jobs and Steven Wozniak, two college dropouts working out of a garage, formed Apple Computers, Inc. In April 1975, Bill Gates and Paul Allen formed a company called Micro-Soft.

Four decades later, these two technology startups are the world’s largest companies, far surpassing the largest oil companies of the 1970s. In fact, the combined market capitalization of Microsoft and Apple is larger than the aggregate market cap of the domestic oil industry. Even more astounding, the combined market cap of Microsoft and Apple just surpassed the total market cap of the entire German stock market.

The table below shows the rotation of the world’s largest publically traded companies over the last fifty years. Of the companies shown below only five have been in the top ten for more than one decade.

Throughout history, most of the world’s largest companies are routinely supplanted by new and different companies from decade to decade. Furthermore, different industries tend to dominate each decade and then fade into the next decade as new industries dominate. For instance, in the 1970’s big oil accounted for six of the top ten largest companies. In the 1980’s, Japanese companies held eight of the top ten spots. In the 1990s it was telecom, the 2000s were controlled by banks and commodities, and this past decade was dominated by technology and social media companies.  

Throughout history, most of the world’s largest companies are routinely supplanted by new and different companies from decade to decade. Furthermore, different industries tend to dominate each decade and then fade into the next decade as new industries dominate. For instance, in the 1970’s big oil accounted for six of the top ten largest companies. In the 1980’s, Japanese companies held eight of the top ten spots. In the 1990s it was telecom, the 2000s were controlled by banks and commodities, and this past decade was dominated by technology and social media companies.  

While table offers several insights, we believe the most important lesson is that our investment strategies must focus on the future and our dependence on past strategies must be carefully considered. Today, two college dropouts in their parent’s basement fooling around with artificial intelligence, block chain, or robotics may prove to be worth more than Apple, Microsoft, or Amazon in just a few decades. The table also emphasizes the importance of selling high and rotating to that which has “value”.

To emphasize that point, we constructed the following graph. Although simple, it effectively illustrates the theme by comparing one stock looking backward and one stock looking forward as an investment strategy. The backward-looking strategy (blue line) buys the largest company at the end of each decade and holds it through the following decade. The forward-looking strategy (orange line), with the gift of 20/20 foresight, buys the company that will be the largest company at the end of the new decade and holds it for that decade.  For example, on January 1, 2010, the forward-looking strategy bought Microsoft and held it until December 31, 2019, while the backward-looking strategy bought Exxon and held it over the same period.

Due to the split-up of AT&T and poor price data, we used GM data which had the second largest market capitalization in 1969. For similar reasons, we also replaced Nippon Telephone and Telegraph (NTT) with The Bank of Tokyo. The graph is based on share price returns and is not inclusive of dividends.

The forward strategy beat the S&P 500 by over 12% a year, while the backward-looking strategy grossly underperformed with a negative cumulative annualized price return over the last 50 years. As startling as the differences are, they fail to provide proper context for the value of 50 years of compounding at the annualized rates of return as shown. If all three portfolios started with $100,000, the backward-looking portfolio would be worth $59,000 today, the S&P 500 worth $3,500,000 today, and the forward-looking portfolio would be worth $791,000,000 today.

Summary

Although no one knows what the top ten list will look like on December 31, 2029, we do know that the next ten years will not be like the last ten. The 2000’s brought two recessions and for the first time in recorded history, the 2010s brought NO recessions. Investors need to be opportunistic, flexible, creative and forward-looking in choosing investments. Investing in today’s winners is not likely to yield us the results of yesterday. It is difficult to fathom as Apple and Microsoft drive the entire market higher, but history warns that their breath-taking returns of the last decade should not be expected in the 2020’s. In fact, history and prudence argue one should sell high.

Technically Speaking: The 80/20 Rule Of Investing

Over the weekend, I discussed the market’s breakout to the upside and the increase in equity exposure in client’s portfolios. As I stated:

The short-term analysis of the market remains broadly positive with both the ongoing bullish trend and recent break above 2500 remaining intact through the close on Friday. 

As shown below, the market is pushing a short-term ‘buy’ signal. However, now at 2-standard deviations above the 75-dma, as seen previously, the market likely has limited upside from here.”

“The breakout, of course, was driven by continued hopes of tax cuts/reforms from the White House as details of the latest proposal from the House Ways and Means Committee were released this week.

More importantly, since the March 9th, 2009 lows, the bull market has surged more than 268% with no decline greater than 20% along the way. Importantly, the correction in early 2016, did not violate the trend line from the 2011 lows which keeps the current market defined to a singular bull market.”


Buying Because I Have To. You Don’t.

After discussing that we had increased exposure to portfolios last week due to the breakout, and added new money, I received several emails questioning the move. To wit:

“With the markets clearly overvalued, and as you say, excessively extended and bullish, why are you buying? As you have often stated, the risk of loss outweighs potential return.” 

That is absolutely correct.

However, there is a difference between views of long-term fundamentally driven potential outcomes and short-term emotionally driven realities.

Importantly, as a portfolio manager, I am buying the breakout because I have to. If I don’t, I suffer career risk, plain and simple.

However, you don’t have to. If you are truly a long-term investor, you have to question the risk being undertaken to achieve further returns in the market.

Think about it this way.

As noted in the chart above, the markets have returned more than 260% since the 2009 lows in the second-longest bull market on record. Yes, it is still just one bull market.

Assuming that you were astute enough to buy the “cherry picked” low, and didn’t spend the bulk of the bull market rally simply getting back to even, you would have accumulated years of excess returns towards meeting your retirement goals. 

If you went to cash now, the odds are EXTREMELY high that in the years ahead you will far outpace investors who remain invested. Sure, they may get an edge on you in the short-term, and chastise you for “missing out,”  but when the next “mean reverting event” occurs the decline will destroy most, if not all, of the returns accumulated over the last 9-years.

So, if you buy the “breakout,” do so carefully. Keep stop losses in place and be prepared to sell if things go wrong.

For now, things are certainly weighted towards the bullish camp, however, such will not always be the case.


How To Add Exposure

I have also received quite a few emails asking how to add exposure to the market, particularly if in a large cash position currently. The answer is more in line with the age-old question:

“How do you pick up a porcupine? Carefully.”

Here are some guidelines to follow:

  1. Move slowly. There is no rush in adding equity exposure to your portfolio. Use pullbacks to previous support levels to make adjustments.
  1. If you are heavily UNDER-weight equities, DO NOT try and fully adjust your portfolio to your target allocation in one move.This could be disastrous if the market reverses sharply in the short term. Again, move slowly.
  1. Begin by selling laggards and losers. These positions are dragging on performance as the market rises and tend to lead when markets fall. Like “weeds choking a garden,” pull them.
  1. Add to sectors, or positions, that are performing with, or outperforming, the broader market. (See last week’s analysis for suggestions.)
  1. Move “stop loss” levels up to current breakout levels for each position. Managing a portfolio without “stop loss” levels is like driving with your eyes closed.
  1. While the technical trends are intact, risk considerably outweighs the reward. If you are not comfortable with potentially having to sell at a LOSS what you just bought, then wait for a larger correction to add exposure more safely. There is no harm in waiting for the “fat pitch” as the current market setup is not one.
  1. If none of this makes any sense to you – please consider hiring someone to manage your portfolio for you. It will be worth the additional expense over the long term.

The “Rothschild 80/20” Rule

When discussing portfolio management, it is often suggested that you can’t “time the market.”

That statement is correct.

You can not effectively, and repetitively, get “in” and “out” of the market on a timely fashion. I have never suggested that an investor should try and do this. However, I HAVE discussed managing risk by adjusting market exposure at times when “risk” outweighs the potential for further “reward.”

While I am often tagged as ‘bearish’ due to my analysis of economic and fundamental data for ‘what it is’ rather than ‘what I hope it to be,’ I am actually neither bullish or bearish. I follow a very simple set of rules which are the core of my portfolio management philosophy which focuses on capital preservation and long-term ‘risk-adjusted’ return.”

Here is my point. As a long-term investor, I don’t need to worry about short-term rallies. I only need to worry about the direction of the overall market trends and focus on capturing the positive and avoiding the negative.

As Baron Nathan Rothschild once quipped:

“You can have the top 20% and the bottom 20%, I will take the 80% in the middle.”

This is the basis of the 80/20 investment philosophy and the driver behind the risk management process.

While you may not beat the market from one year to the next, you will never have to suffer the “time loss” required to “get back to even.” In the long run, you will win.

As shown in the table below, a $100,000 investment in the S&P 500 returns a far lower value than the “Rothschild 80/20 Rule” model. This is even if I include a ridiculous 2% management fee.

Here is a chart to illustrate the deviation more effectively. (Capital appreciation only.)

Yes, it’s only a bit more than a hundred thousand dollars worth of difference, but the reduced levels of volatility allowed investors to emotionally “stick” to their discipline over time. Furthermore, by minimizing the drawdowns, assets are allowed to truly “compound” over the long-term.

An easy way to apply this principle is to use a simple moving average crossover. In the chart below, you are long equities which the S&P 500 index is above the 12-month moving average, and you switch to bonds when the S&P 500 falls below the 12-month average.

No, it’s not perfect every time. But no measure of risk management is.

But having a discipline to manage risk is better than not having one at all. 

Get it. Got it. Good.


Cracks In The Bull Market Armor

While we did increase exposure to the market in portfolio last week, as the bullish trend does currently persist, there is growing evidence of “cracks” appearing.

With the Fed now on track to begin reducing support for the market, and a real possibility that “tax reform” will fail to materialize anytime soon, the possibility of a trap getting sprung on unwitting investors is rising.

The current rally is built on a substantially weaker fundamental and economic backdrop. Thereforeit is extremely important to remember that whatever increase in equity risk you take, could very well be reversed in short order due to the following reasons:

  1. We are moving into the latter stages of the bull market.
  2. Economic data continues to remain weak
  3. Earnings are beating continually reduced estimates
  4. Volume is weak
  5. Longer-term technical underpinnings are weakening and extremely stretched.
  6. Complacency is extremely high
  7. Share buybacks are slowing
  8. The yield curve is flattening

It is worth remembering that markets have a very nasty habit of sucking individuals into them when prices become detached from fundamentals. Such is the case currently and has generally not had a positive outcome.

What you decide to do with this information is entirely up to you. As I stated, I do think there is enough of a bullish case being built to warrant taking some equity risk on a very short-term basis. We will see what happens over the next couple of weeks. 

However, the longer-term dynamics are turning more bearish. When those negative price dynamics are combined with the fundamental and economic backdrop, the “risk” of having excessive exposure to the markets greatly outweighs the potential “reward. “

While it is certainly advisable to be more “bullish” currently, like picking up a “porcupine,” do so carefully.

Investing is not a competition.

It is a game of long-term survival.