Why “Not-QE” is QE: Deciphering Gibberish
“I guess I should warn you, if I turn out to be particularly clear, you’ve probably misunderstood what I’ve said.” – Alan Greenspan
Imagine if Federal Reserve (Fed) Chairman Jerome Powell told the American people they must pay more for the goods and services they consume.
How long would it take for mobs with pitchforks to surround the Mariner Eccles building? However, Jerome Powell and every other member of the Fed routinely and consistently convey pro-inflationary ideals, and there is nary a protest, which seems odd. The reason for the American public’s complacency is that the Fed is not that direct and relies on carefully crafted language and euphemisms to describe the desire for higher inflation.
To wit, the following statements from past and present Fed officials make it all but clear they want more inflation:
- “That is why it is essential that we at the Fed use our tools to make sure that we do not permit an unhealthy downward drift in inflation expectations and inflation,” – Jerome Powell November 2019
- “In order to move rates up, I would want to see inflation that’s persistent and that’s significant,” -Jerome Powell December 2019
- “Been very challenging to get inflation back to 2% target” -Jerome Powell December 2019
- “Ms. Yellen also said that continuing low inflation, regarded as a boon by many, could be “dangerous” – FT – November 2017
- “One way to increase the scope for monetary policy is to retain the Fed’s current focus on hitting a targeted value of inflation, but to raise the target to, say, 3 or 4 percent.” –Ben Bernanke October 2017
- “Further weakness in inflation could prompt the U.S. Federal Reserve to cut interest rates, even if economic growth maintains its momentum” -James Bullard, President of the Federal Reserve Bank of St. Louis May 2019
- “Fed Evans Says Low Inflation Readings Elevating His Concerns” -Bloomberg May 2019
- “I believe an aggressive policy action such as this is required to re-anchor inflation expectations at our target.” Neel Kashkari, President Minneapolis Fed June 2019
As an aside, it cannot be overemphasized the policies touted in the quotes above actually result in deflation, an outcome the Fed desperately fears.
The Fed, and all central banks for that matter, have a long history of using confusing economic terminology. Economics is not as complicated as the Fed makes it seem. What does make economics hard to grasp is the technical language and numerous contradictions the Fed uses to explain economics and justify unorthodox monetary policy. It is made even more difficult when the Fed’s supporting cast – the media, Wall Street and other Fed apologists – regurgitate the Fed’s gibberish.

The Fed’s fourth installment of quantitative easing (“QE4”, also known as “Not-QE QE”) is vehemently denied as QE by the Fed and Fed apologists. These denials, specifically a recent article in the Financial Times (FT), provide us yet another opportunity to show how the Fed and its minions so blatantly deceive the public.
What is QE?
QE is a transaction in which the Fed purchases assets, mainly U.S. Treasury securities and mortgage-backed-securities, via their network of primary dealers. In exchange for the assets, the Fed credits the participating dealers’ reserve account at the Fed, which is a fancy word for a place for dormant money. In this transaction, each dealer receives payment for the assets sold to the Fed in an account that is essentially the equivalent of a depository account with the Fed. Via QE, the Fed has created reserves that sit in accounts maintained by it.
Reserves are the amount of funds required by the Fed to be held by banks (which we are using interchangeably with “primary dealer” for the remainder of this discussion) in their Fed account or in vault cash to back up a percentage of specified deposit liabilities. While QE is not directly money printing, it enables banks to create loans at a multiple of approximately ten times the reserves available, if they so choose.
Notice that “Quantitative Easing” is the preferred terminology for the operations that create additional reserves, not something easier to understand and more direct like money/reserve printing, Fed bond buying program, or liquidity injections. Consider the two words used to describe this policy – Quantitative and Easing. Easing is an accurate descriptor of the Fed’s actions as it refers to an action that makes financial conditions easier, e.g., lower interest rates and more money/liquidity. However, what does quantitative mean? From the Oxford Dictionary, “quantitative” is “relating to, measuring, or measured by the quantity of something rather than its quality.”
So, QE is a measure of the amount of easing in the economy. Does that make sense to you? Would the public be so complacent if QE were called BBMPO (bond buying and money printing operations)? Of course not. The public’s acceptance of QE without much thought is a victory for the Fed marketing and public relations departments.
Is “Not-QE” QE?
The Fed and media are vehemently defending the latest round of repurchase market (“repo”) operations and T-bill purchases as “not QE.” Before the Fed even implemented these new measures, Jerome Powell was quick to qualify their actions accordingly: “My colleagues and I will soon announce measures to add to the supply of reserves over time,” “This is not QE.”
This new round of easing is QE, QE4, to be specific. We dissect a recent article from the FT to debunk the nonsense commonly used to differentiate these recent actions from QE.
On February 5th, 2020, Dominic White, an economist with a research firm in London, wrote an article published by the FT entitled The Fed is not doing QE. Here’s why that matters.
The article presents three factors that must be present for an action to qualify as QE, and then it rationalizes why recent Fed operations are something else. Here are the requirements, per the article:
- “increasing the volume of reserves in the banking system”
- “altering the mix of assets held by investors”
- “influence investors’ expectations about monetary policy”
Simply:
- providing banks the ability to make more money
- forcing investors to take more risk and thereby push asset prices higher
- steer expectations about future Fed policy.
Point 1
In the article, White argues “that the US banking system has not multiplied up the Fed’s injection of reserves.”
That is an objectively false statement. Since September 2019, when repo and Treasury bill purchase operations started, the assets on the Fed’s balance sheet have increased by approximately $397 billion. Since they didn’t pay for those assets with cash, wampum, bitcoin, or physical currency, we know that $397 billion in additional reserves have been created. We also know that excess reserves, those reserves held above the minimum and therefore not required to backstop specified deposit liabilities, have increased by only $124 billion since September 2019. That means $273 billion (397-124) in reserves were employed (“multiplied up”) by banks to support loan growth.
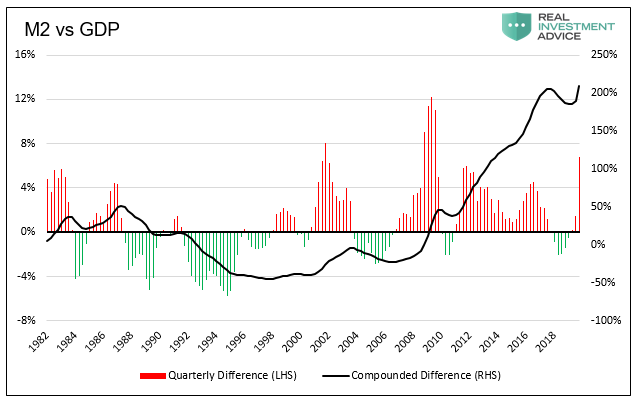
Regardless of whether these reserves were used to back loans to individuals, corporations, hedge funds, or the U.S. government, banks increased the amount of debt outstanding and therefore the supply of money. In the first half of 2019, the M2 money supply rose at a 4.0% to 4.5% annualized rate. Since September, M2 has grown at a 7% annualized rate.

Point 2
White’s second argument against the recent Fed action’s qualifying as QE is that, because the Fed is buying Treasury Bills and offering short term repo for this round of operations, they are not removing riskier assets like longer term Treasury notes and mortgage-backed securities from the market. As such, they are not causing investors to replace safe investments with riskier ones. Ergo, not QE.
This too is false. Although by purchasing T-bills and offering repo the Fed has focused on the part of the bond market with little to no price risk, the Fed has removed a vast amount of assets in a short period. Out of necessity, investors need to replace those assets with other assets. There are now fewer non-risky assets available due to the Fed’s actions, thus replacement assets in aggregate must be riskier than those they replace.
Additionally, the Fed is offering repo funding to the market. Repo is largely used by banks, hedge funds, and other investors to deploy leverage when buying financial assets. By cheapening the cost of this funding source and making it more readily available, institutional investors are incented to expand their use of leverage. As we know, this alters the pricing of all assets, be they stocks, bonds, or commodities.
By way of example, we know that two large mortgage REITs, AGNC and NLY, have dramatically increased the leverage they utilize to acquire mortgage related assets over the last few months. They fund and lever their portfolios in part with repo.
Point 3
White’s third point states, “the Fed is not using its balance sheet to guide expectations for interest rates.”
Again, patently false. One would have to be dangerously naïve to subscribe to White’s logic. As described below, recent measures by the Fed are gargantuan relative to steps they had taken over the prior 50 years. Are we to believe that more money, more leverage, and fewer assets in the fixed income universe is anything other than a signal that the Fed wants lower interest rates? Is the Fed taking these steps for more altruistic reasons?

Bad Advice
After pulling the wool over his reader’s eyes, the author of the FT article ends with a little advice to investors: “Rather than obsessing about fluctuations in the size of the Fed’s balance sheet, then, investors might be better off focusing on those things that have changed more fundamentally in recent months.”
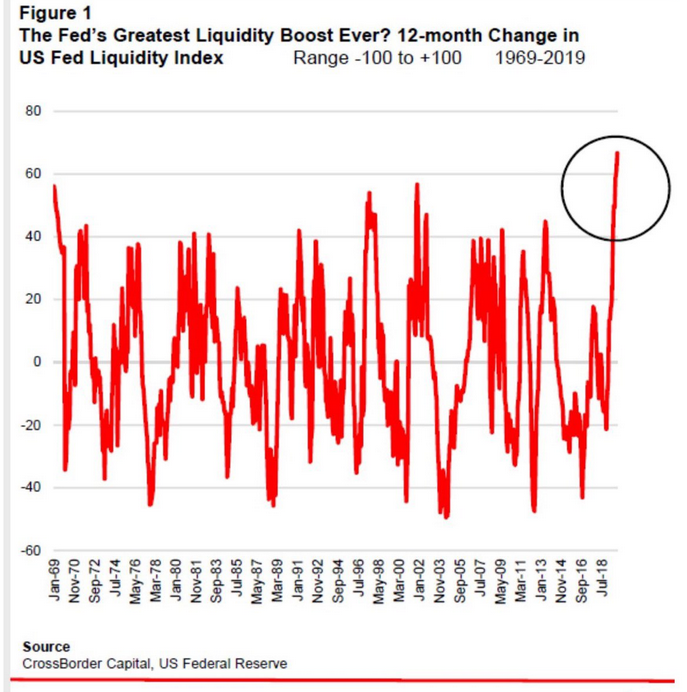
After a riddled and generally incoherent explanation about why QE is not QE, White has the chutzpah to follow up with advice to disregard the actions of the world’s largest central bank and the crisis-type operations they are conducting. QE 4 and repo operations were a sudden and major reversal of policy. On a relative basis using a 6-month rate of change, it was the third largest liquidity injection to the U.S. financial system, exceeded only by actions taken following the 9/11 terror attacks and the 2008 financial crisis. As shown below, using a 12-month rate of change, recent Fed actions constitute the single biggest liquidity injection in 50 years of data.
Are we to believe that the latest round of Fed policy is not worth following? In what is the biggest “tell” that White is not qualified on this topic, every investment manager knows that money moves the markets and changes in liquidity, especially those driven by the central banks, are critically important to follow.
The graph below compares prior balance sheet actions to the latest round.
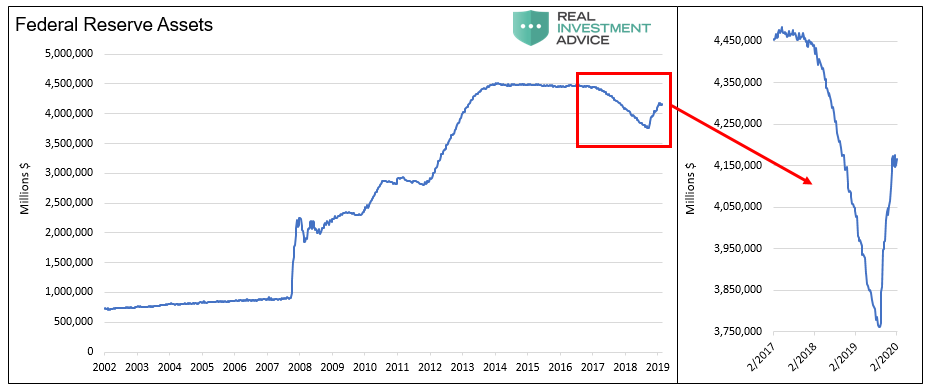
Data Courtesy St. Louis Federal Reserve
This next graph is a not so subtle reminder that the current use of repo is simply unprecedented.
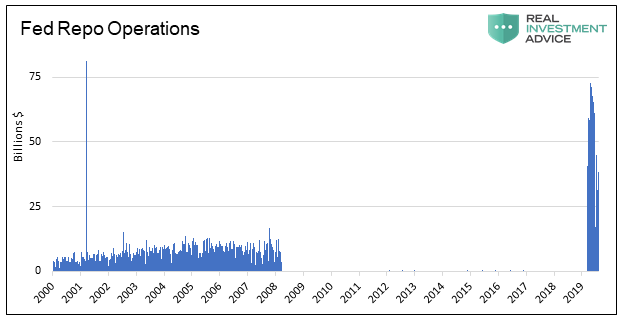
Data Courtesy St. Louis Federal Reserve

Summary
This is a rebuttal to the FT article and comments from the Fed, others on Wall Street and those employed by the financial media. The wrong-headed views in the FT article largely parrot those of Ben Bernanke. This past January he stated the following:
“Quantitative easing works through two principal channels: by reducing the net supply of longer-term assets, which increases their prices and lower their yields; and by signaling policymakers’ intention to keep short rates low for an extended period. Both channels helped ease financial conditions in the post-crisis era.” -LINK
Bourbon, tequila, and beer offer drinkers’ very different flavors of alcohol, but they all have the same effect. This round of QE may be a slightly different cocktail of policy action, but it is just as potent as QE 1, 2, and 3 and will equally intoxicate the market as much, if not more.
Keep in mind that QE 1, 2, and 3 were described as emergency policy actions designed to foster recovery from an economic crisis. Might that fact be the rationale for claiming this round of liquidity is far different from prior ones? Altering words to describe clear emergency policy actions is a calculated effort to normalize those actions. Normalizing them gives the Fed greater latitude to use them at will, which appears to be the true objective. Pathetic though it may be, it is the only rationale that helps us understand their obfuscation.