Major Market Buy/Sell Review: 04-27-20
HOW TO READ THE CHARTS
There are three primary components to each chart:
- The price chart is in orange
- The Over Bought/Over Sold indicator is in gray
- The Buy / Sell indicator is in blue.
When the gray indicator is at the TOP of the chart, there is typically more risk and less reward available at the current time. In other words, the best time to BUY is when the short-term condition is over-sold. Likewise when the buy/sell indicator is above the ZERO line investments have a tendency of working better than when below the zero line.
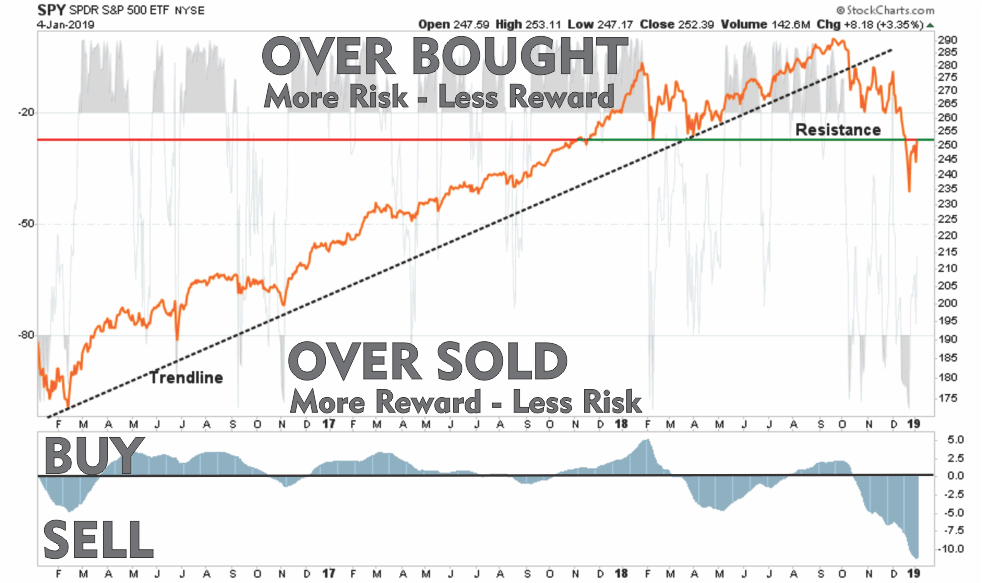
With this basic tutorial let’s review the major markets.
NOTE: I have added relative performance information to each graph. Most every graph shows relative performance to the S&P 500 index except for the S&P 500 itself which compares value to growth, and oil to the energy sector.
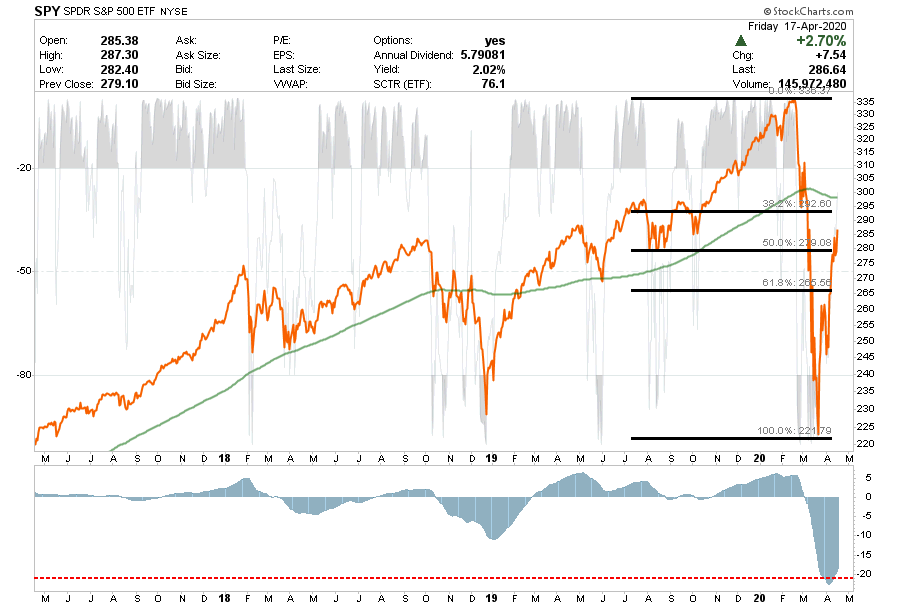
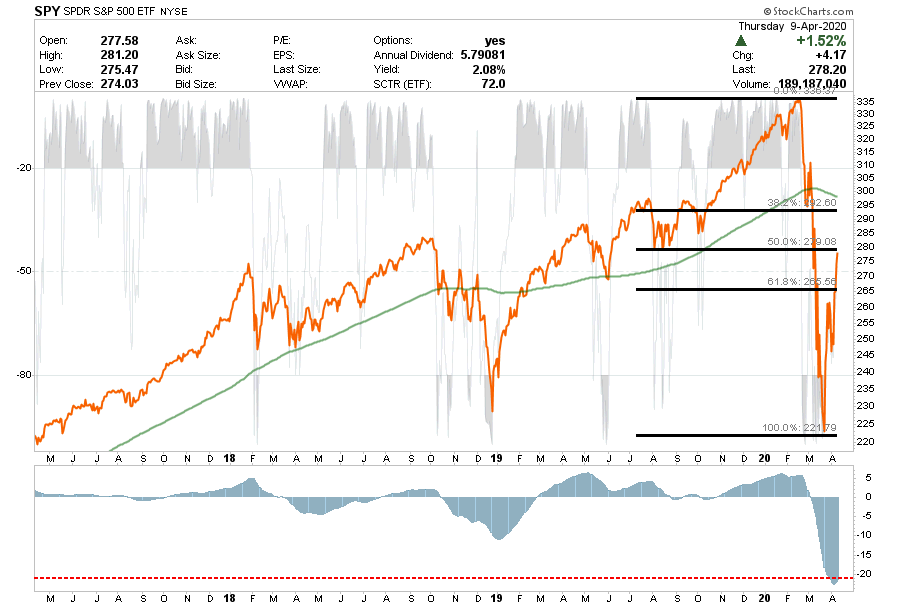
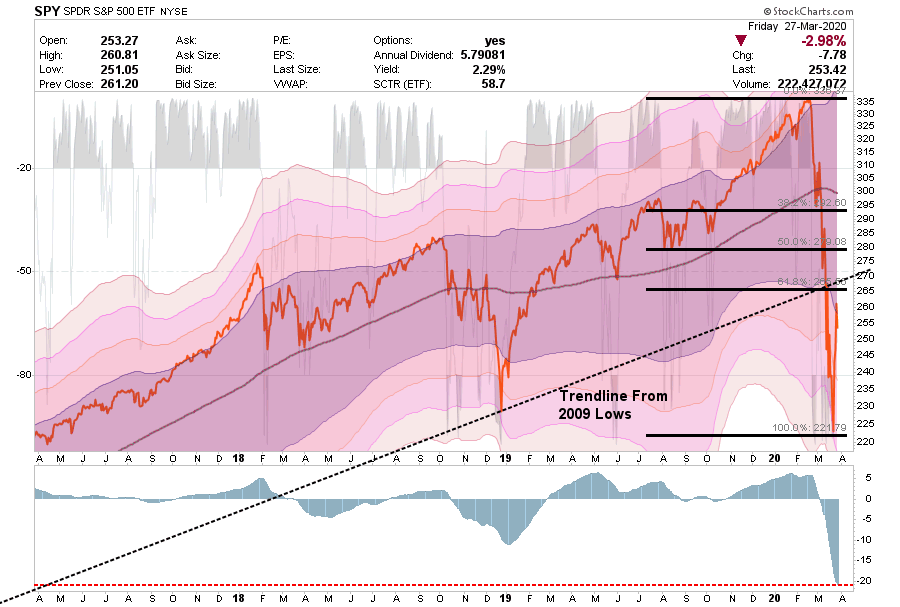
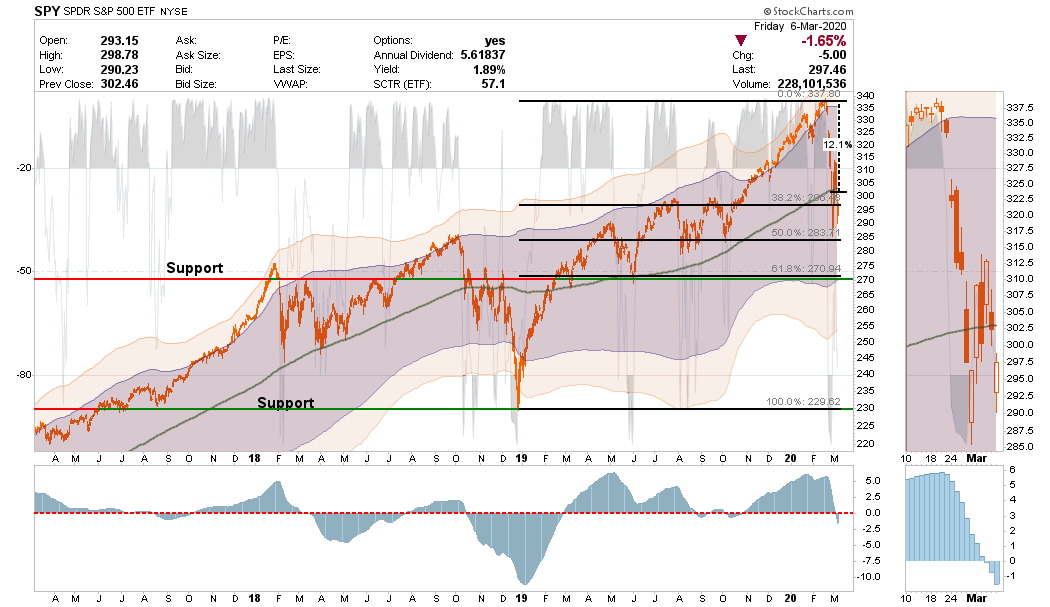
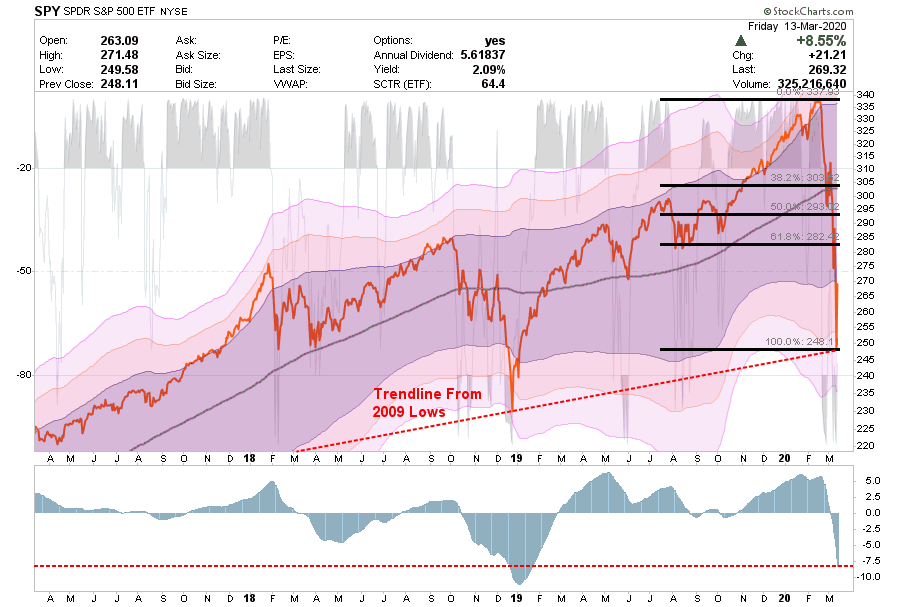
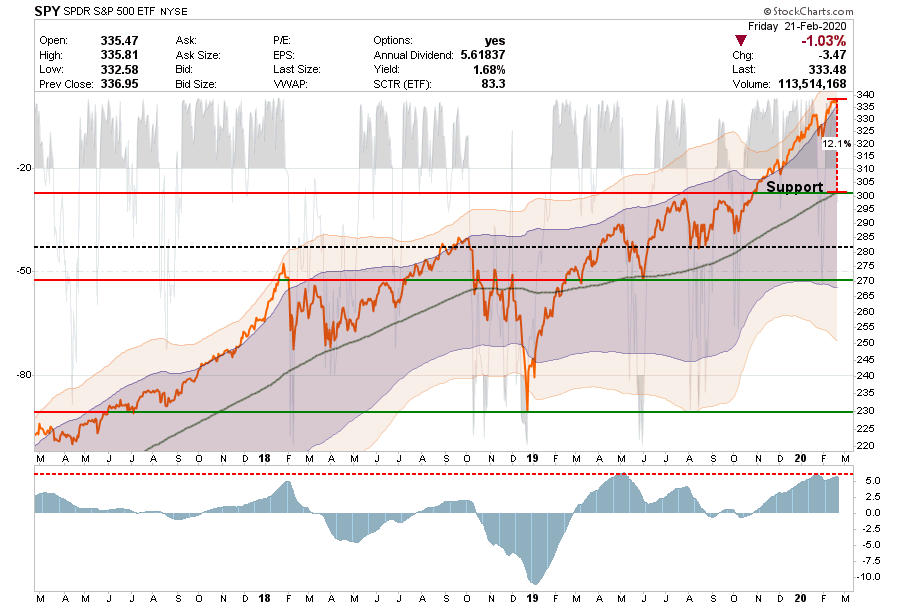
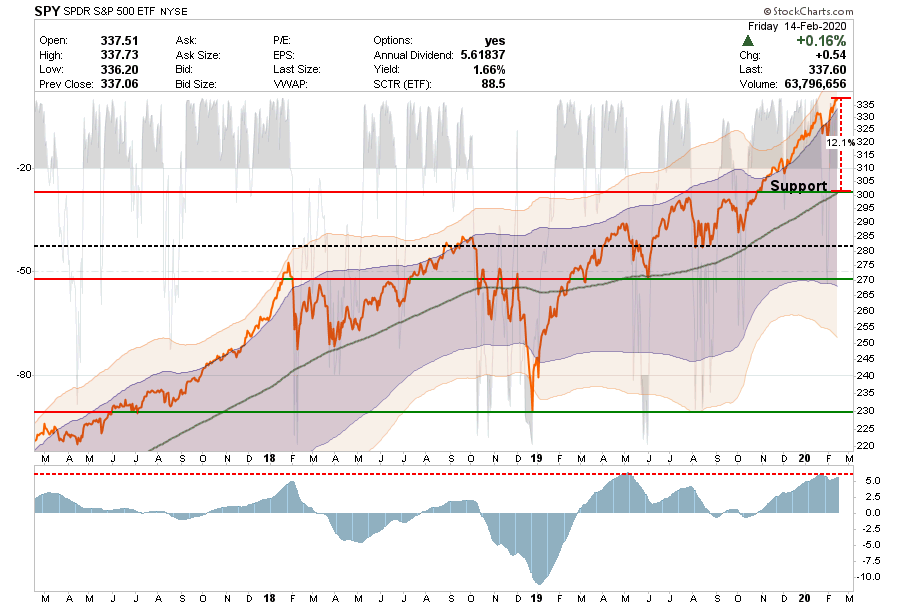
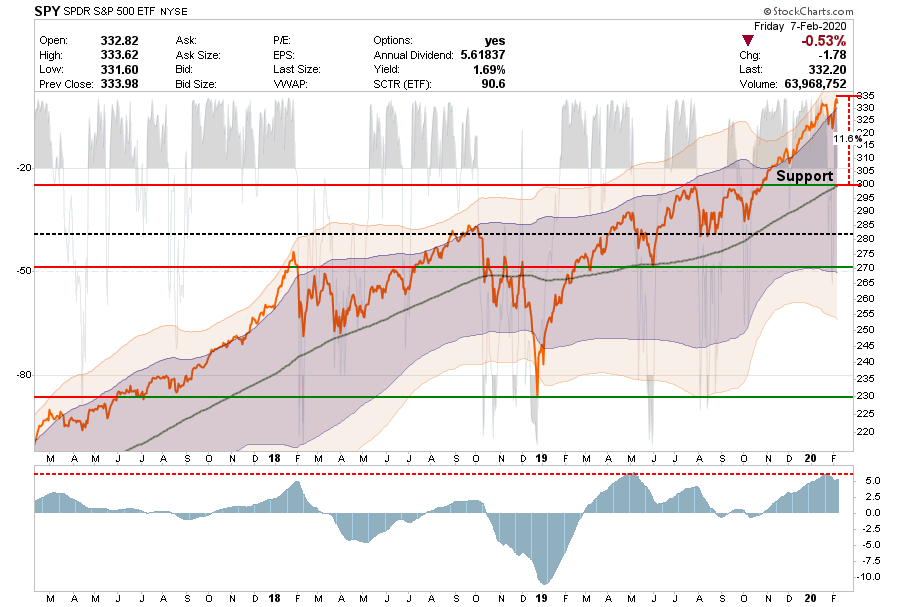
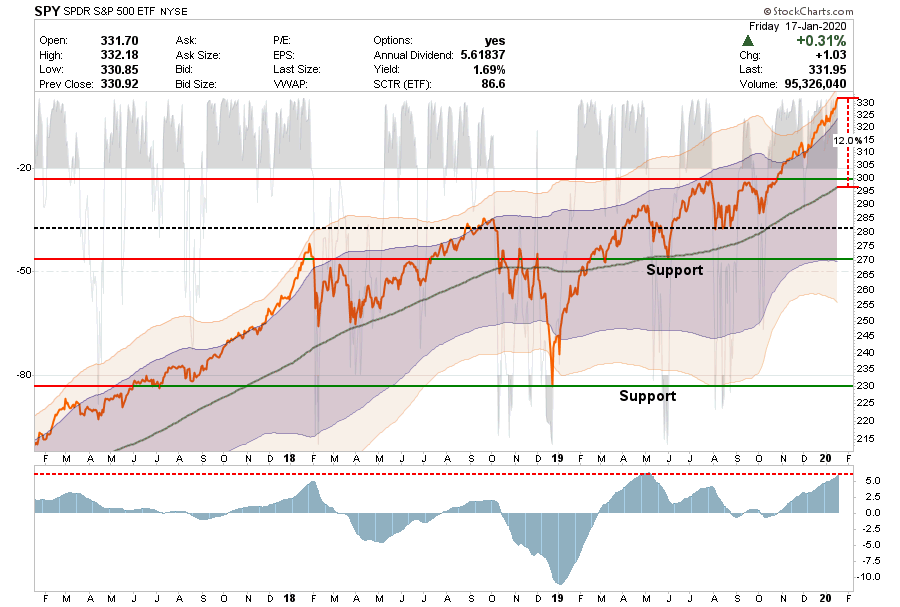
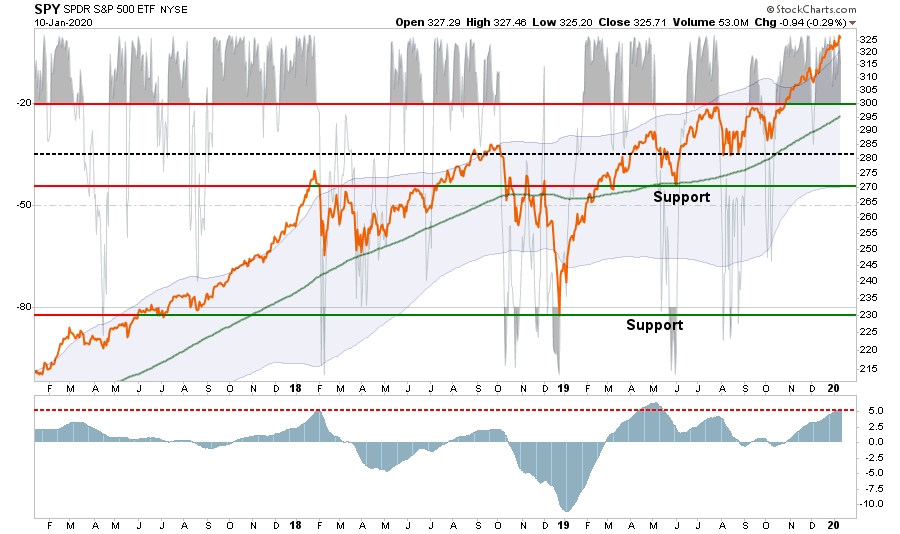
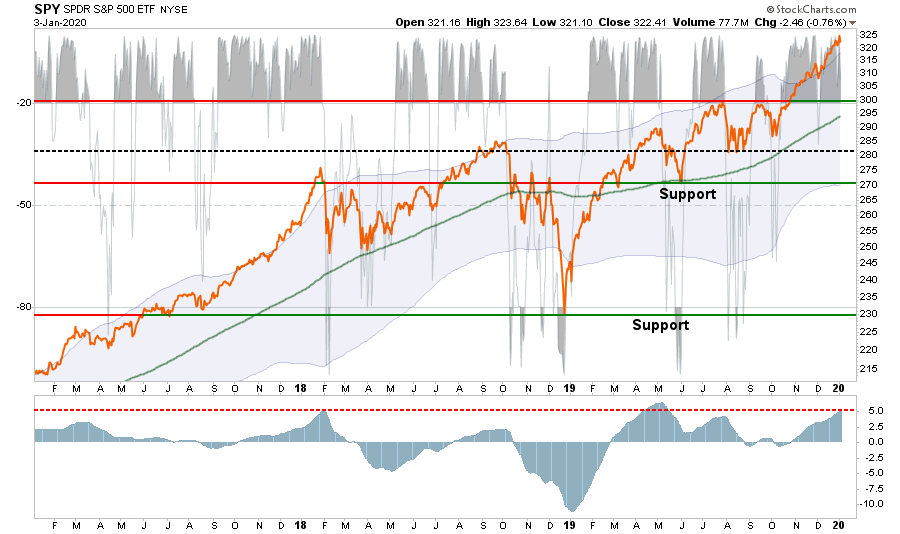
S&P 500 Index
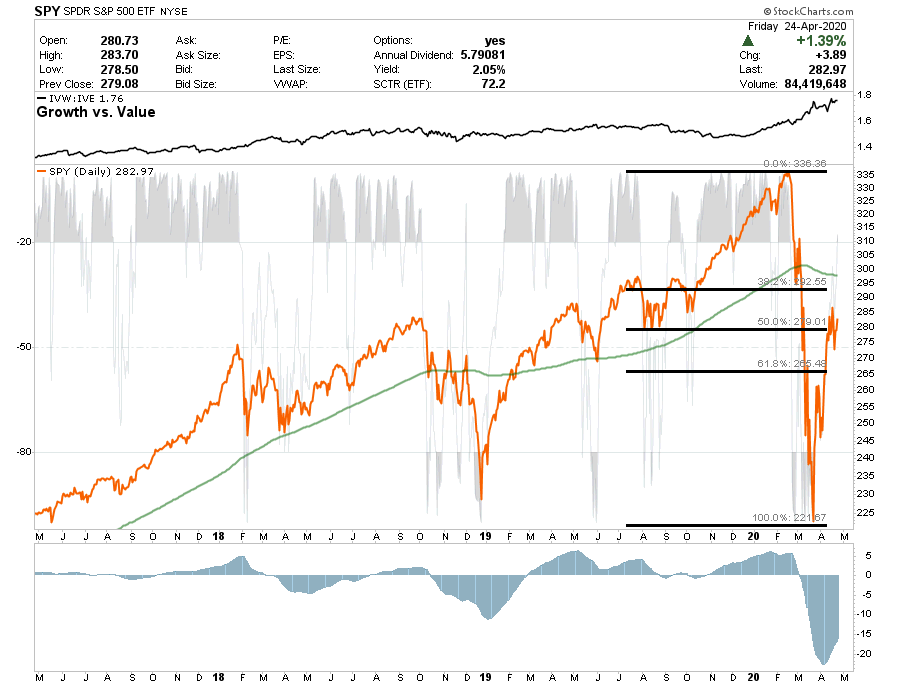
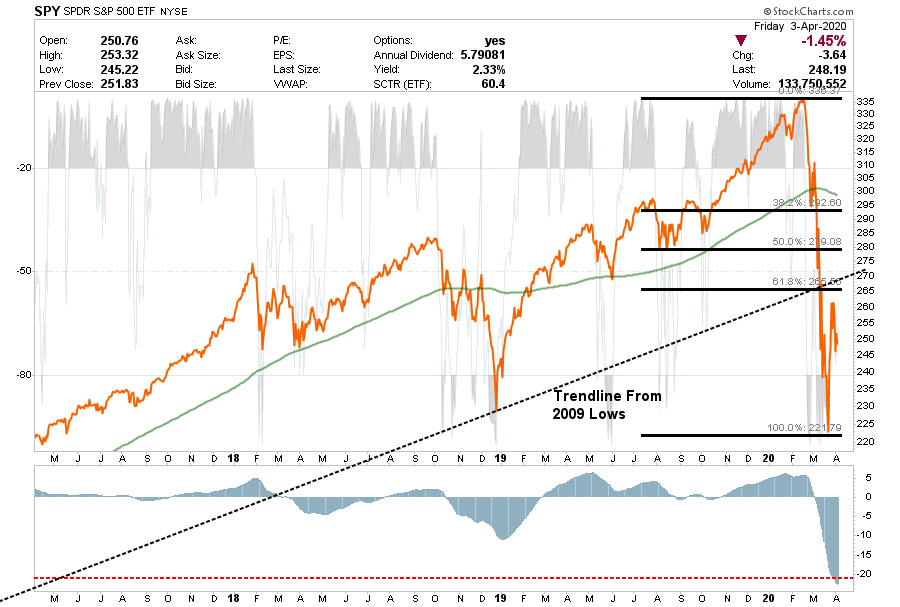
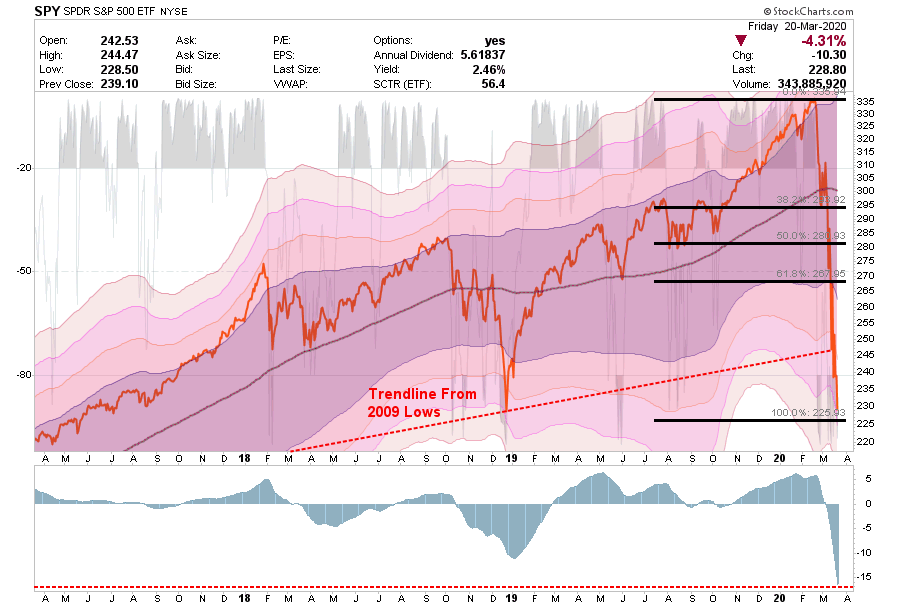
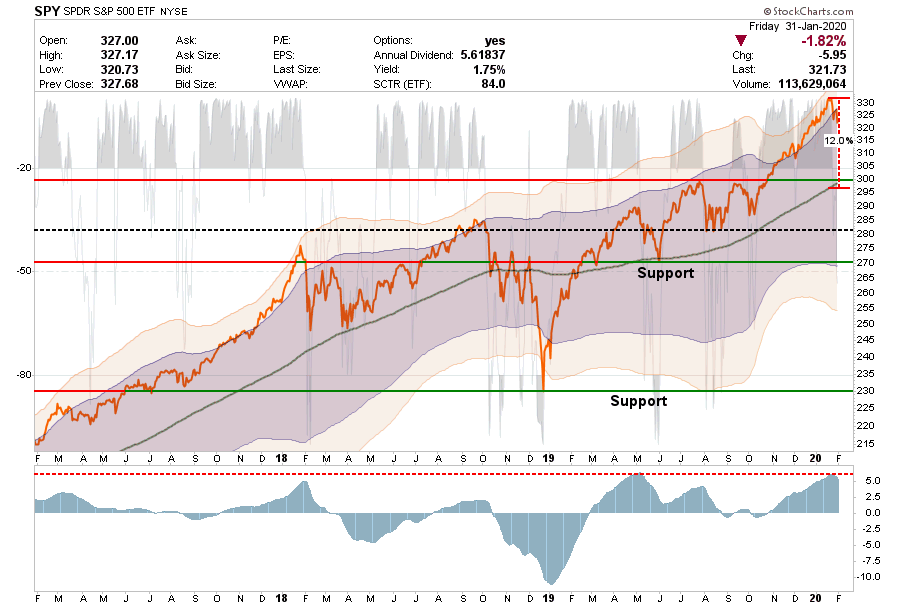
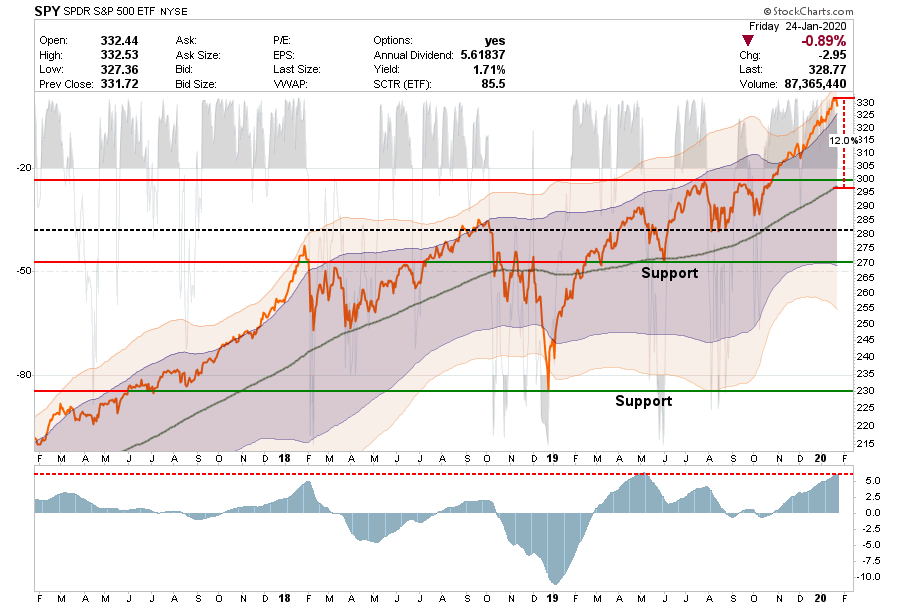
- Last week I wrote: “The break of the 50% retracement this past week, is bullish and suggests a run to the 200-dma is likely. However, the risk/reward is not in the favor of longer-term positions, so trading positions only for now.”
- This past week, SPY retested, and held above, the 50% retracement keeping a run to the 61.8% retracement still viable. However, the market does appear to be struggling and is overbought short-term.
- This analysis still doesn’t negate the risk of more volatility ahead, so be prepared for sharp declines which means keeping trading stops tight.
- Short-Term Positioning: Bearish – Market Risk Is High
- Last Week: No core position
- This Week: Trading “Rentals” Only
- Stop-loss moved up to $265
- Long-Term Positioning: Bearish
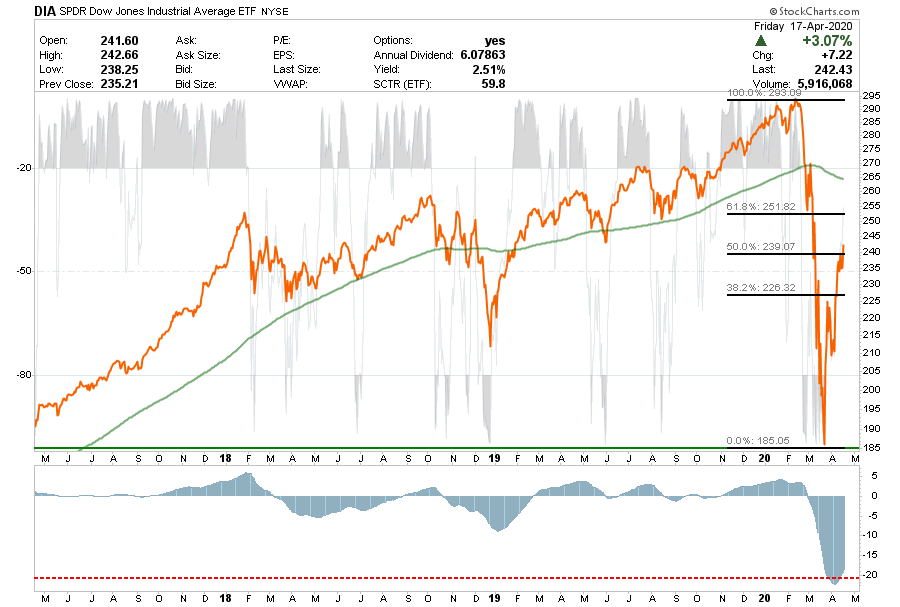
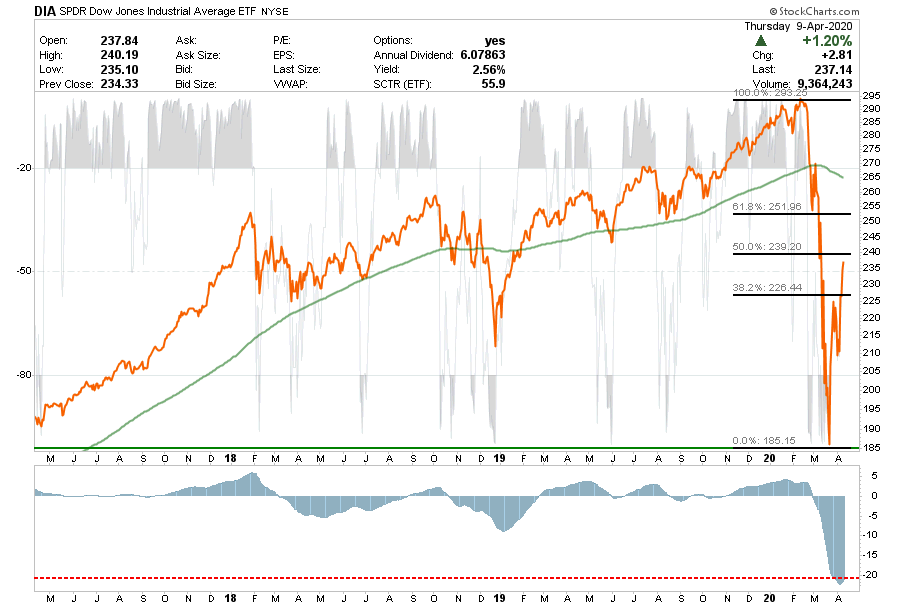
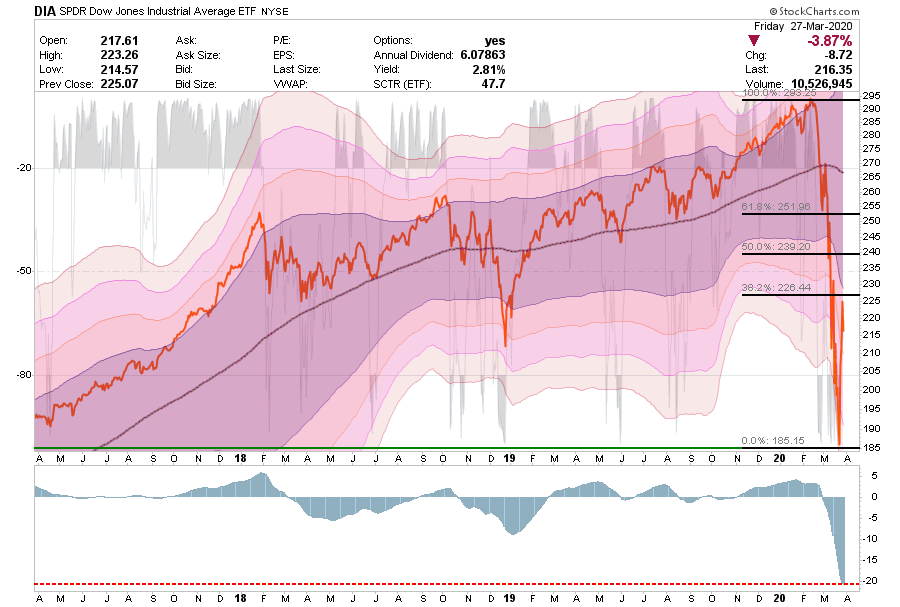
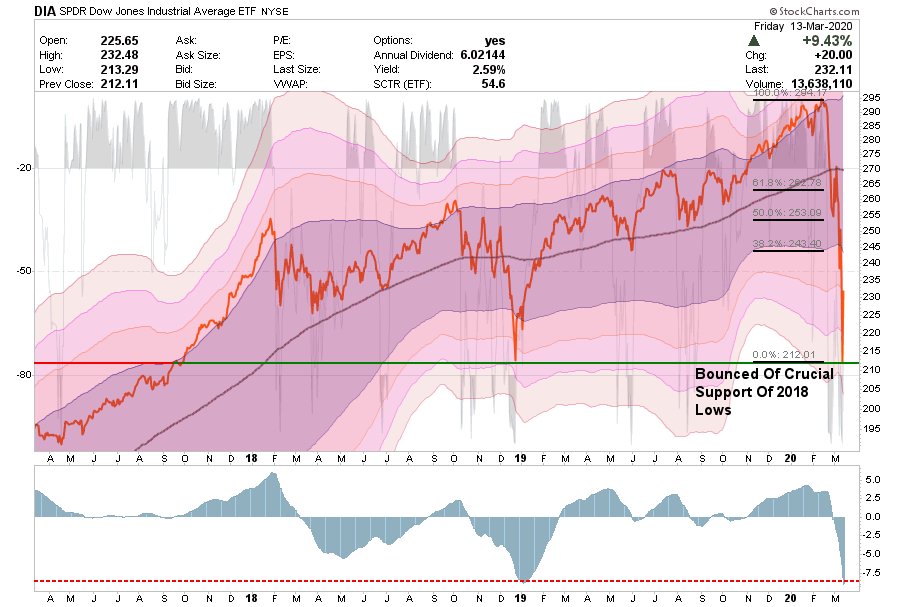
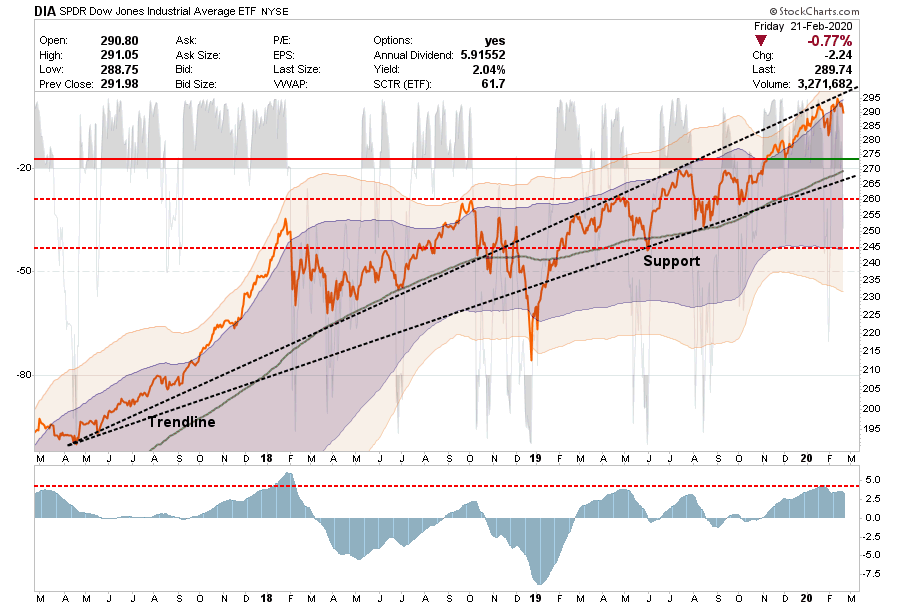
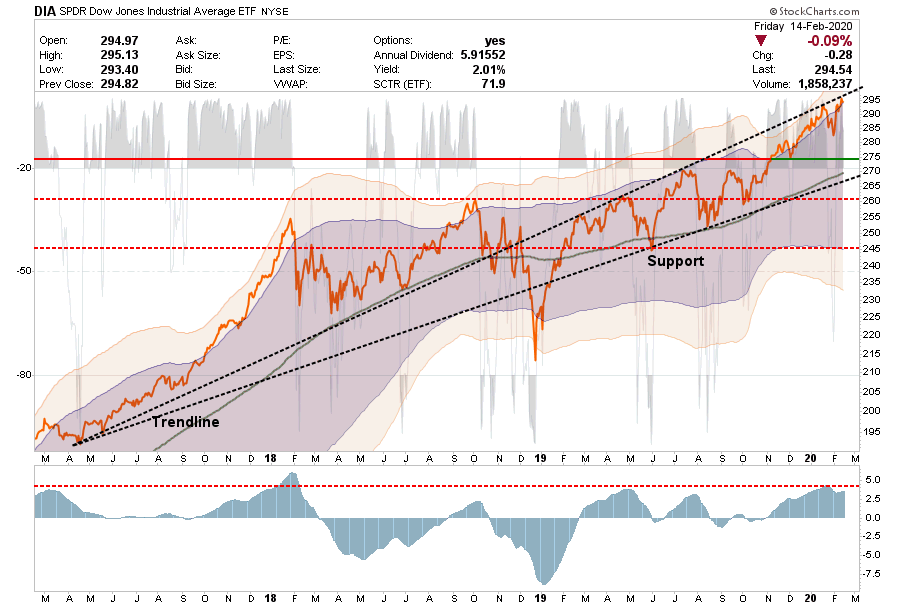
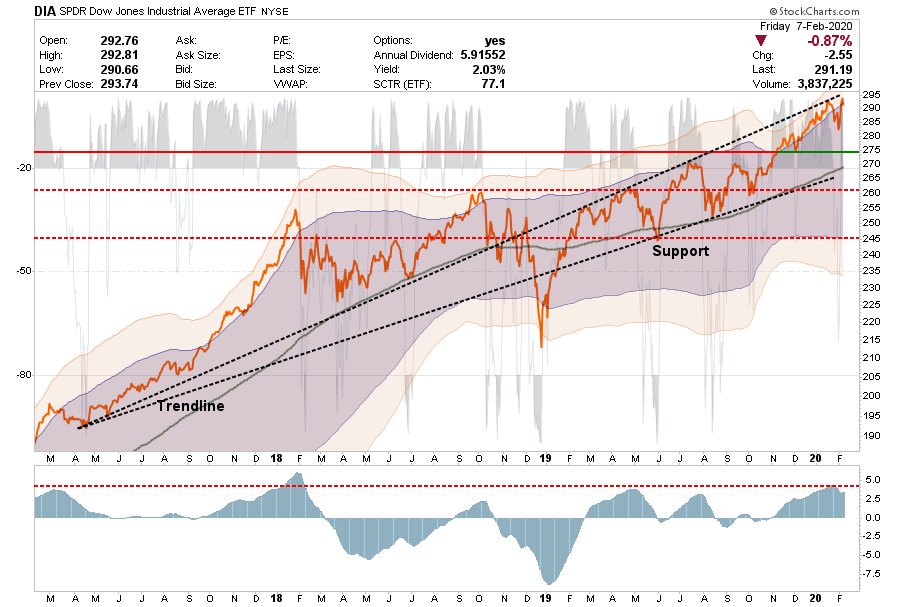
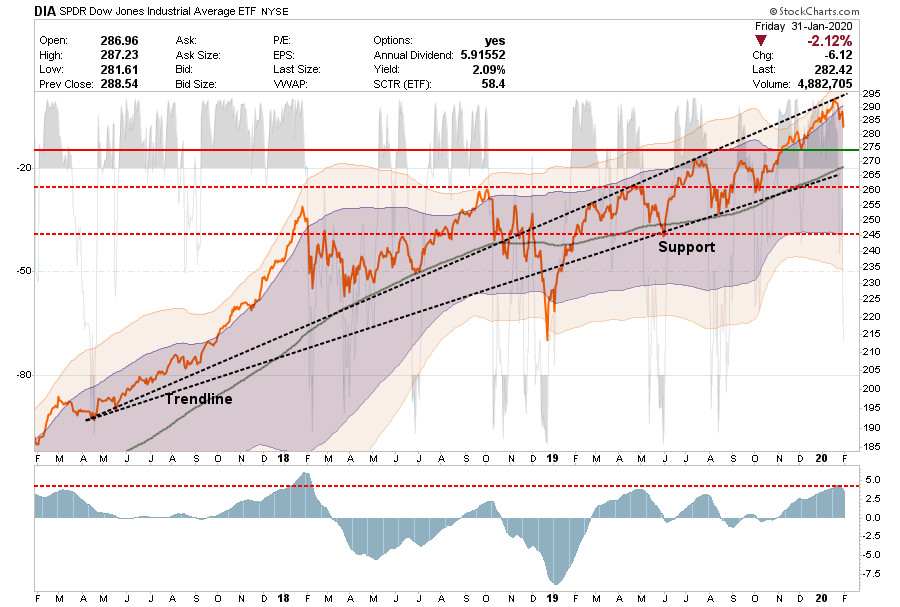
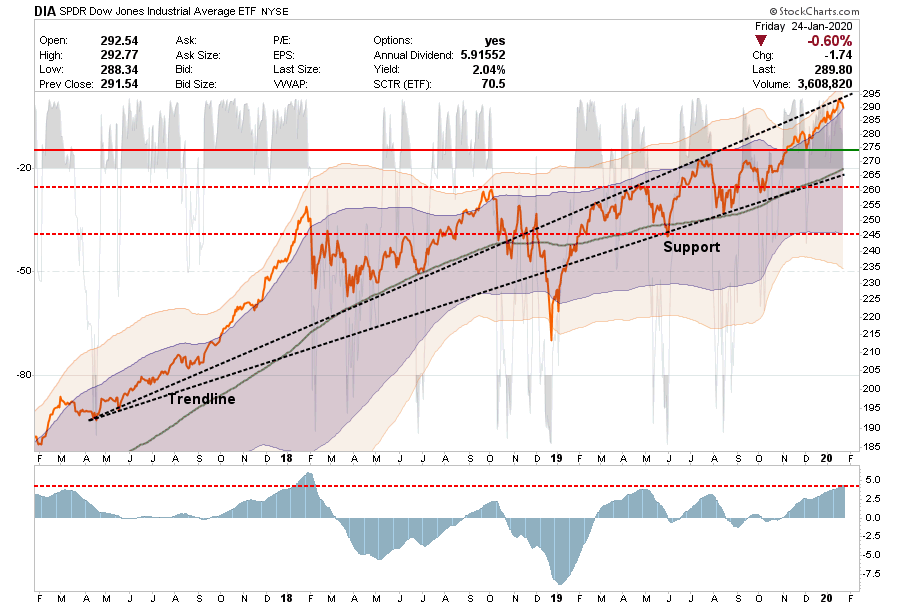
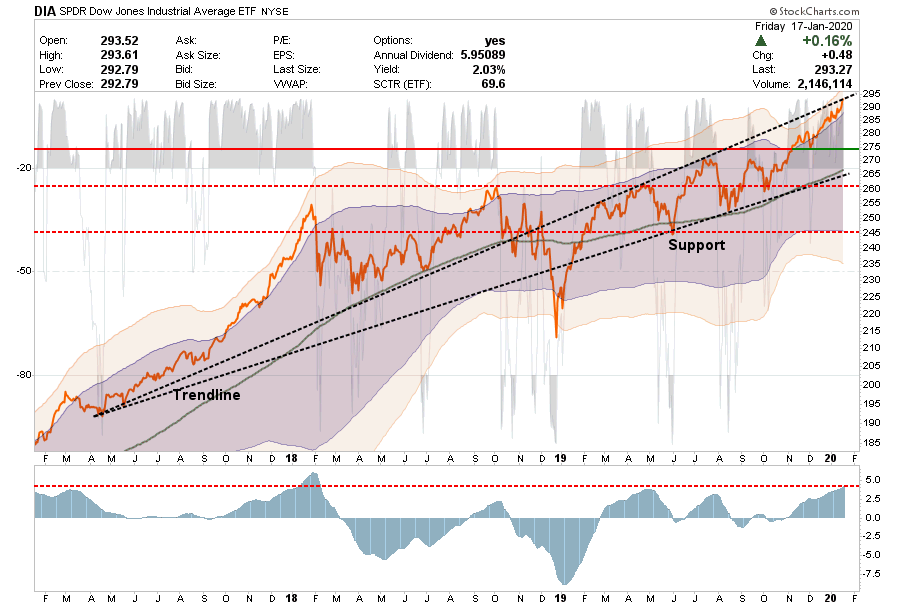
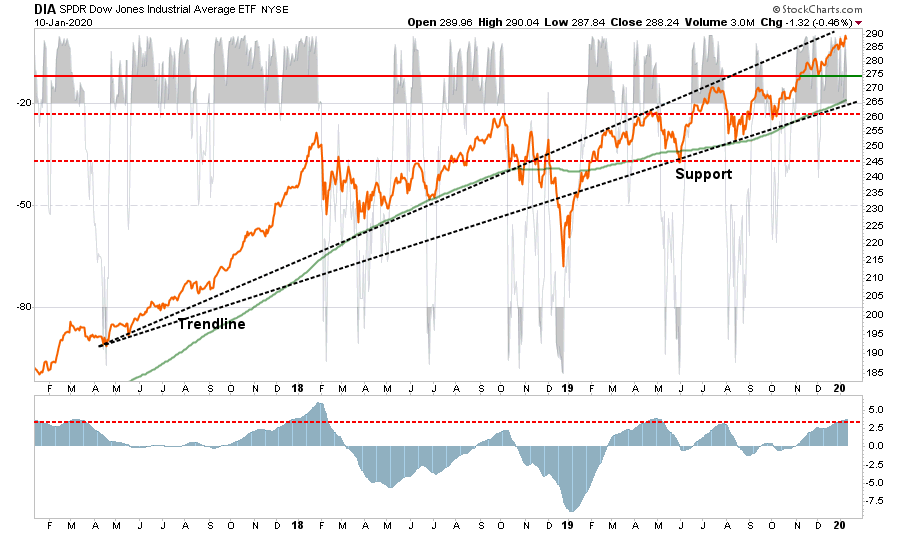
Dow Jones Industrial Average
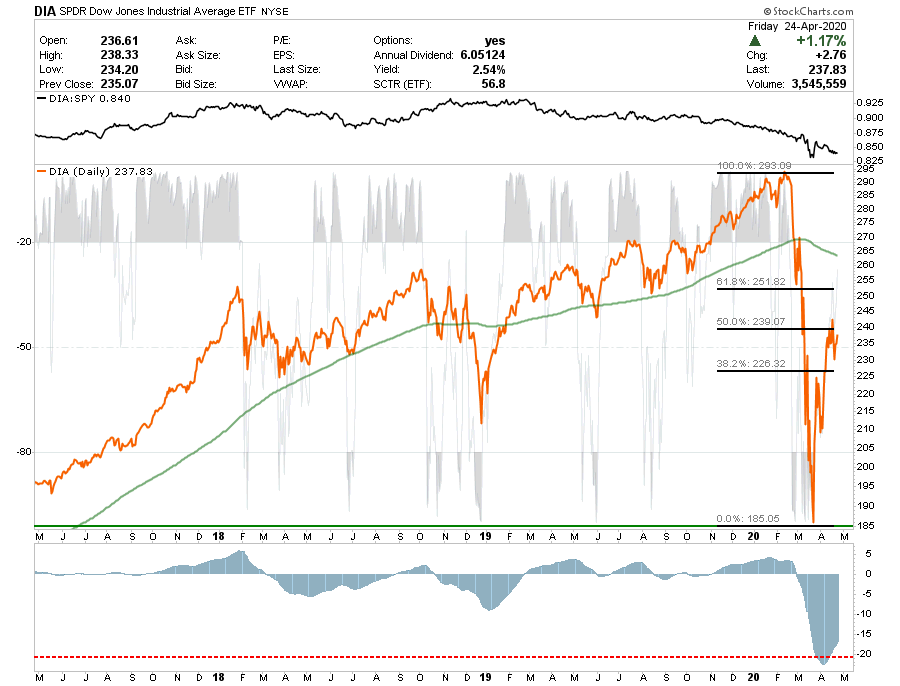
- DIA is a little different story as it failed at the 50% retracement and closed below it.
- Also, on a relative basis, SPY continues to smartly outperform DIA.
- If DIA fails to gain traction next week, we will likely see a failure of support. Trading “rentals” only for now with a tight stop at $226
- Short-Term Positioning: Bearish – Market Risk Is High
- Last Week: No positions
- This Week: Trading “Rentals” Only
- Stop-loss moved up to $226
- Long-Term Positioning: Bearish
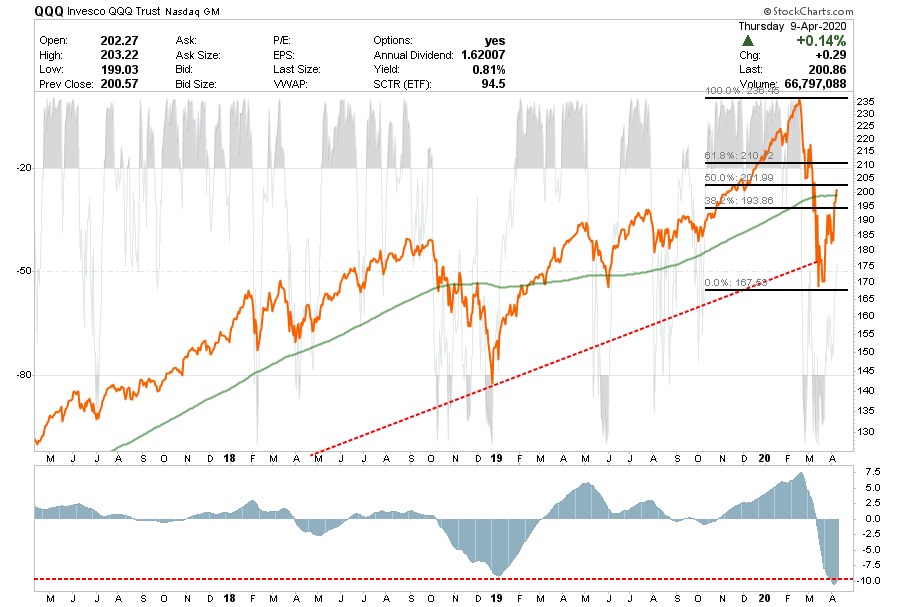
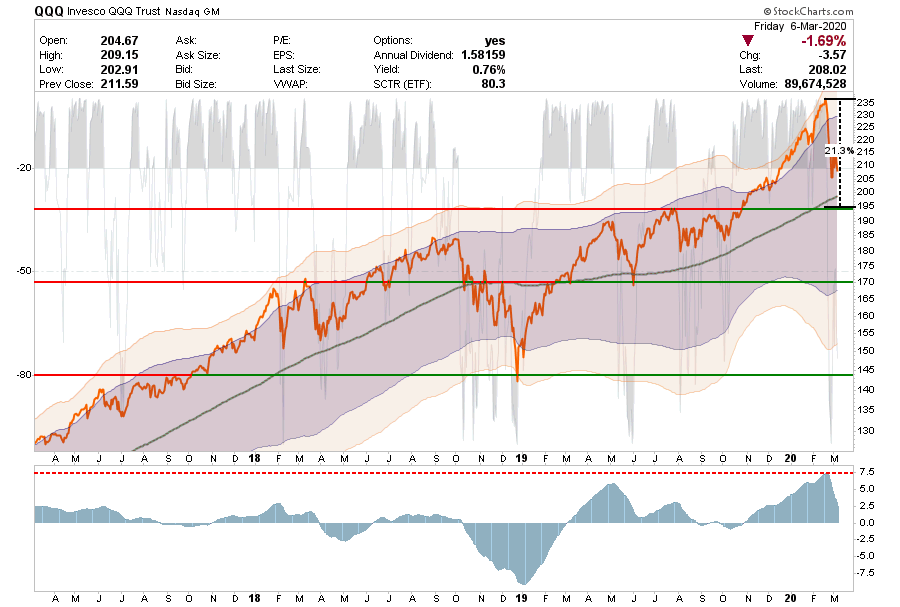
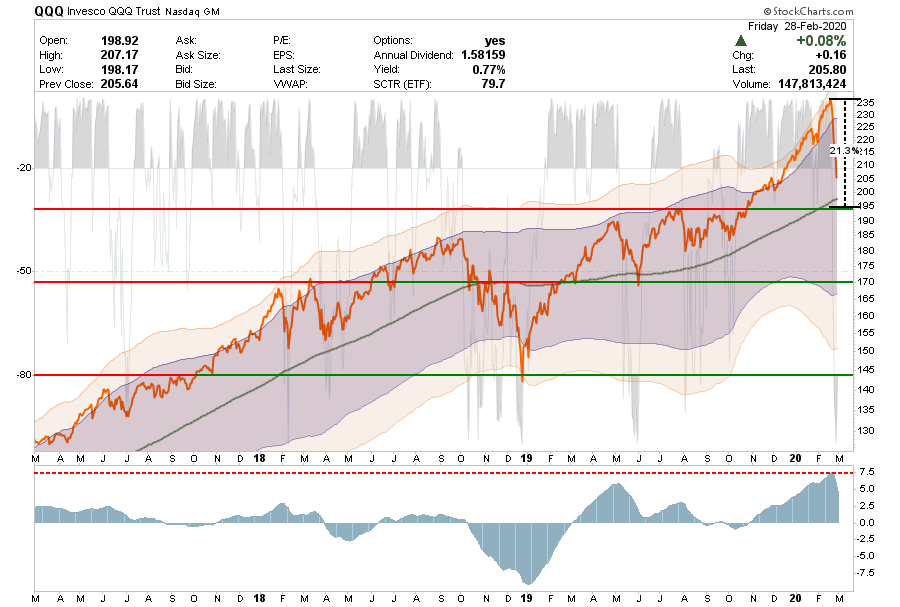
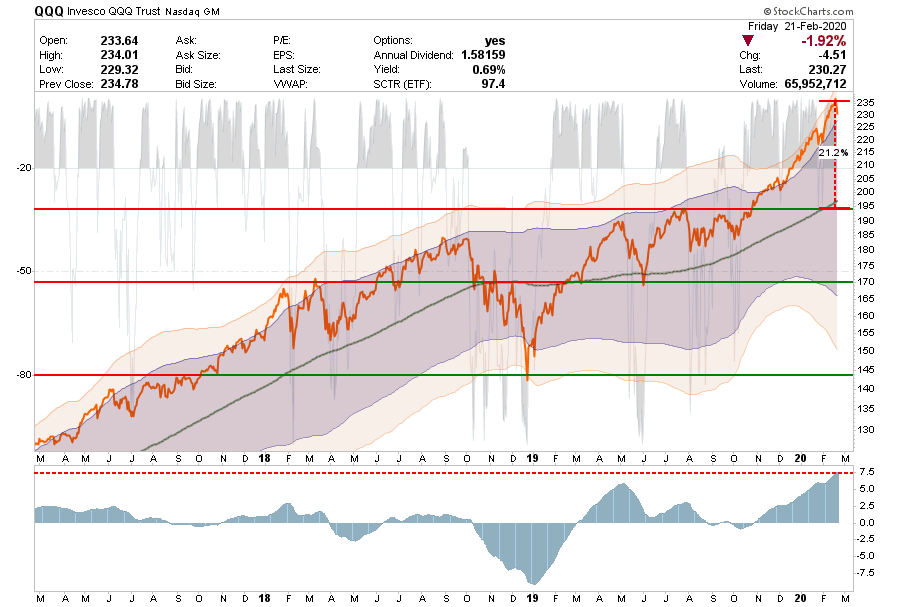
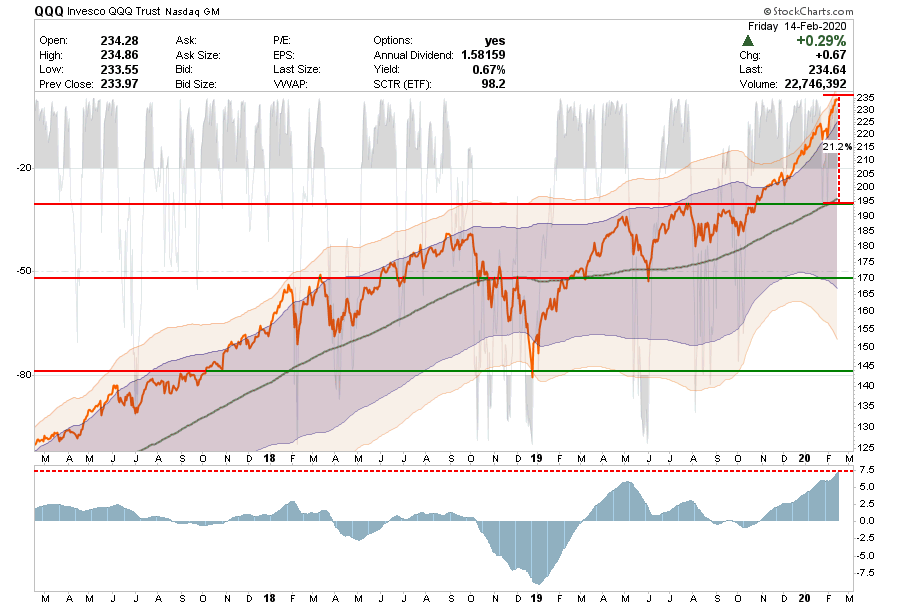
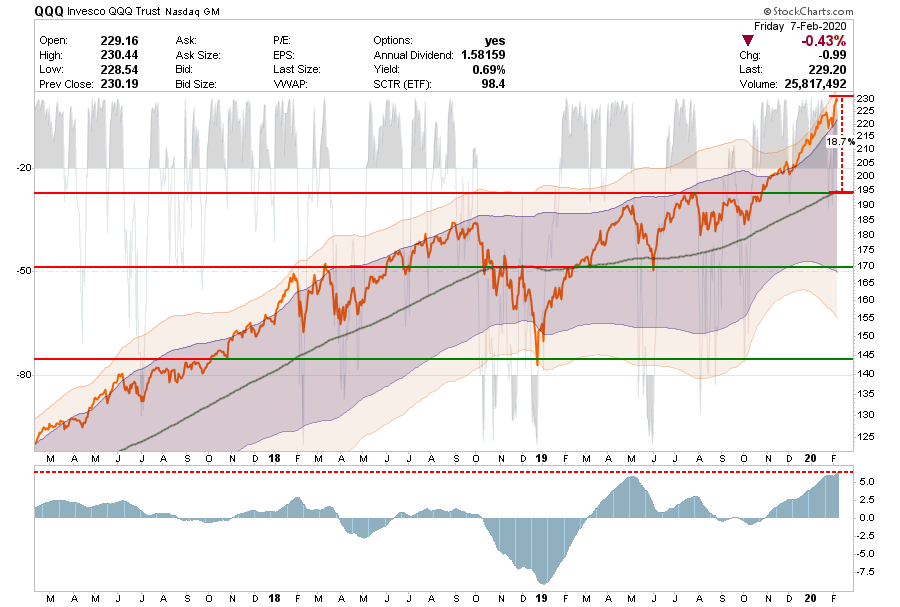
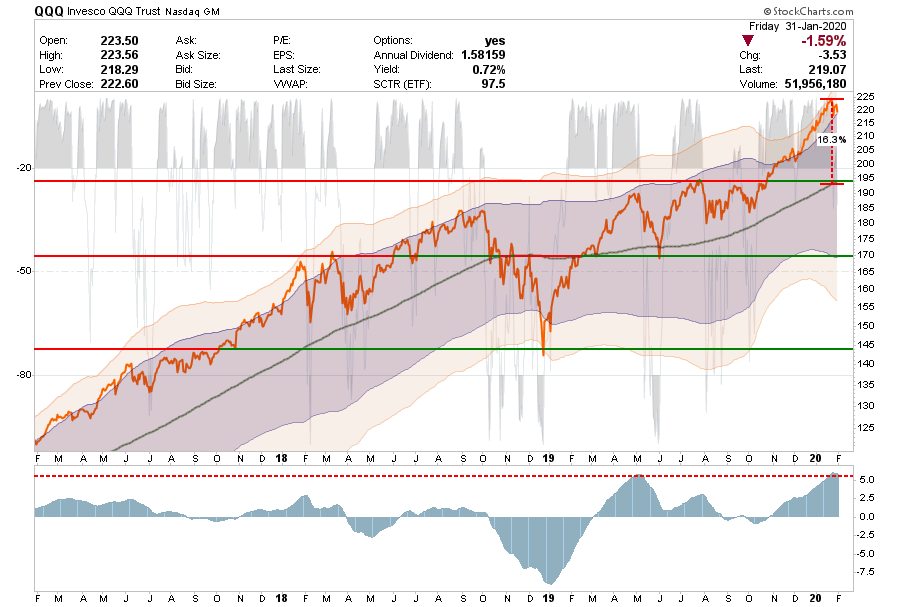
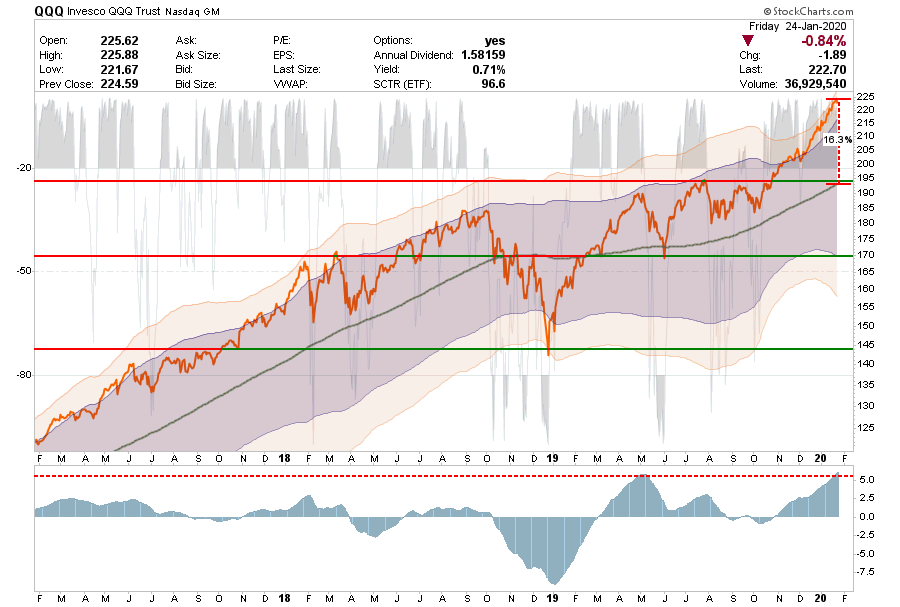
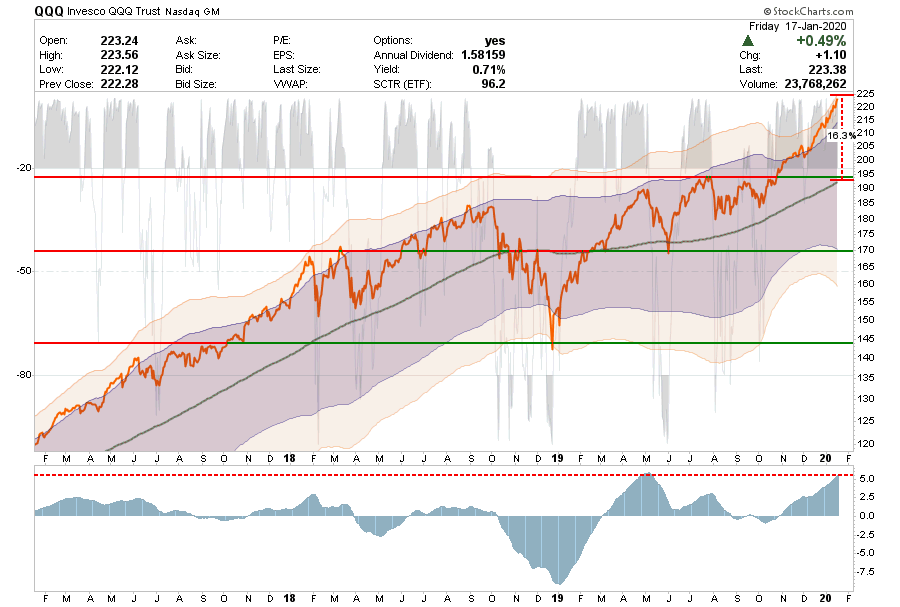
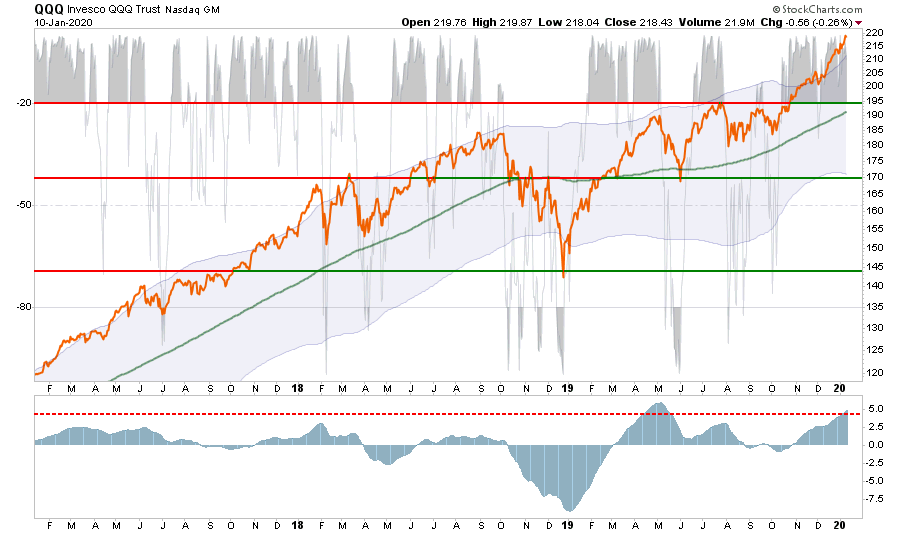
Nasdaq Composite
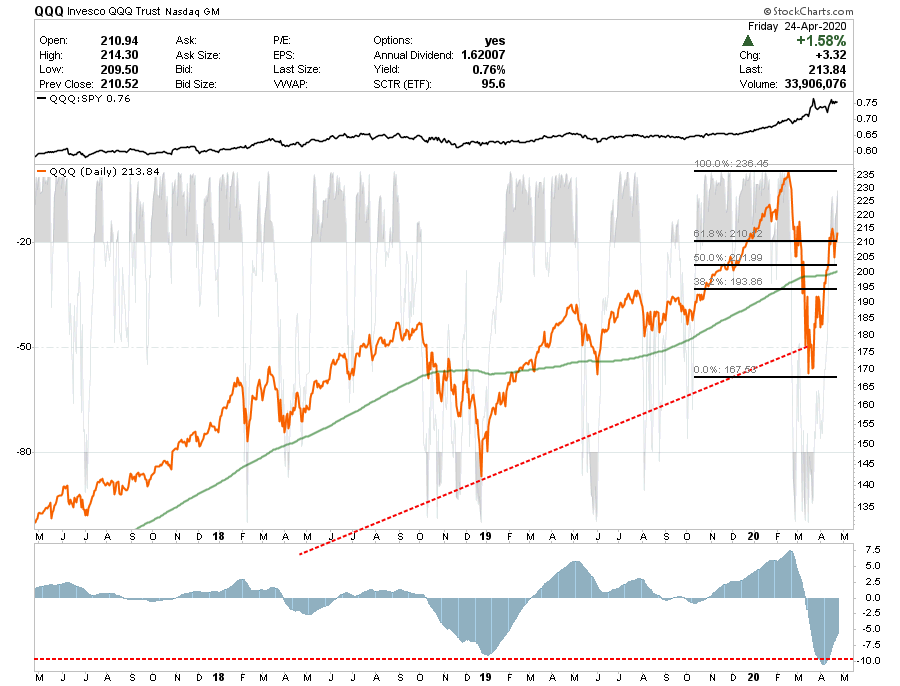
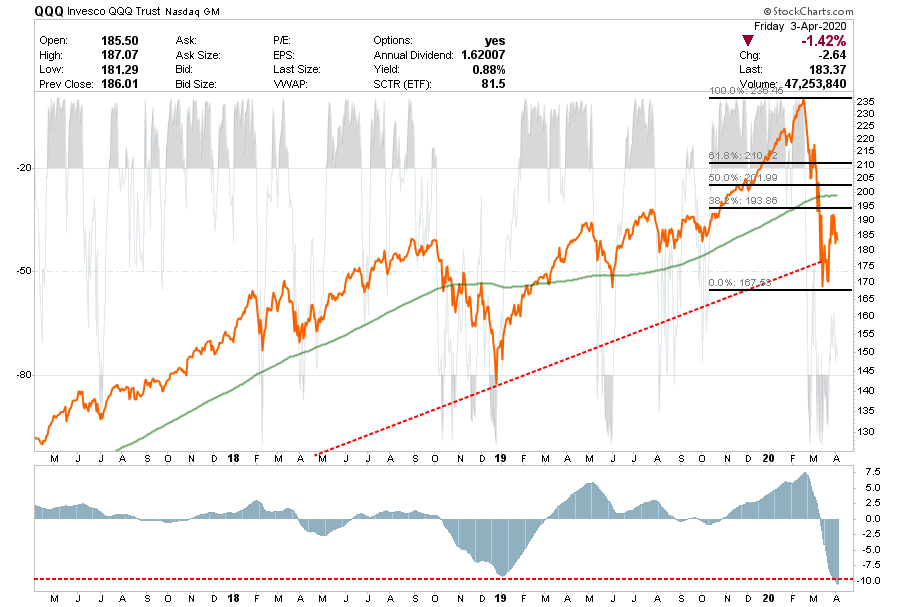
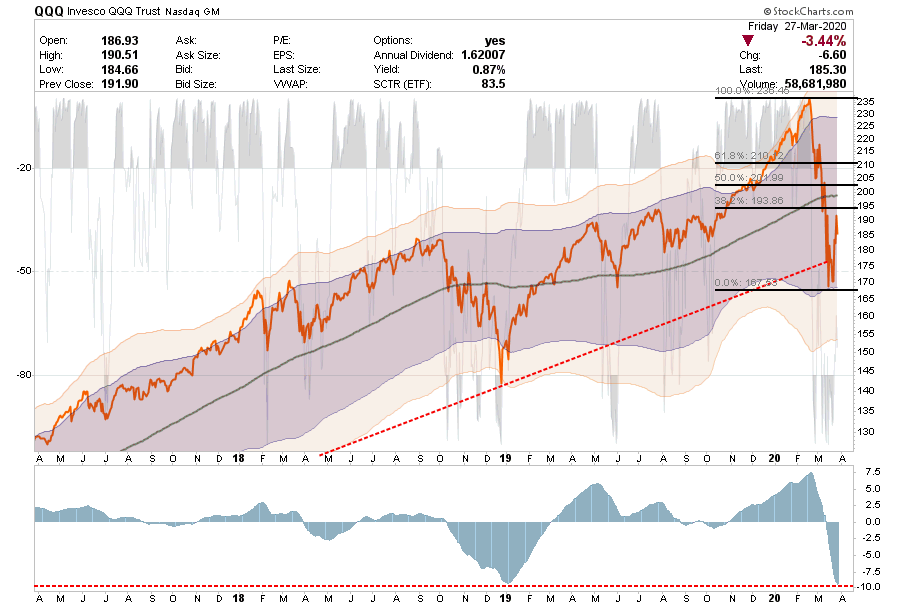
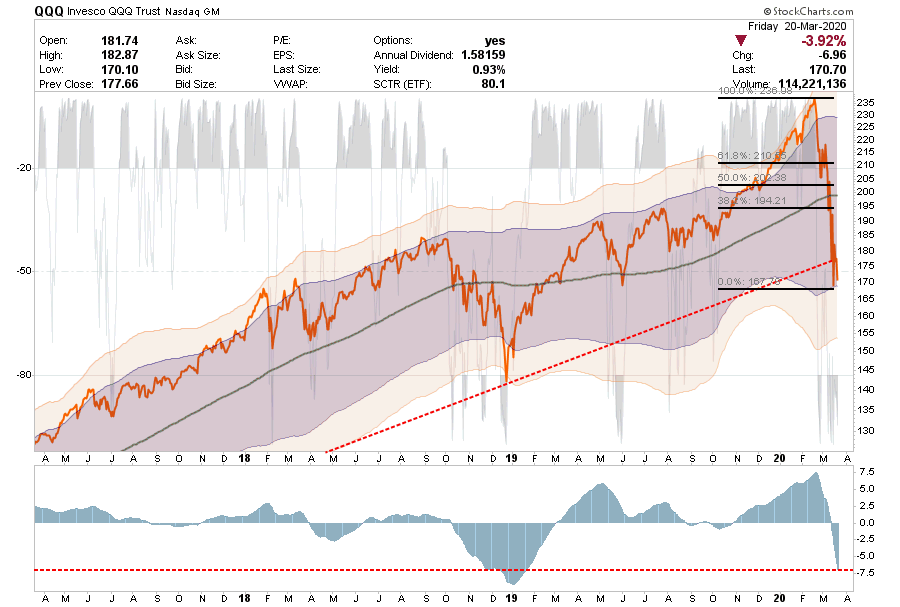
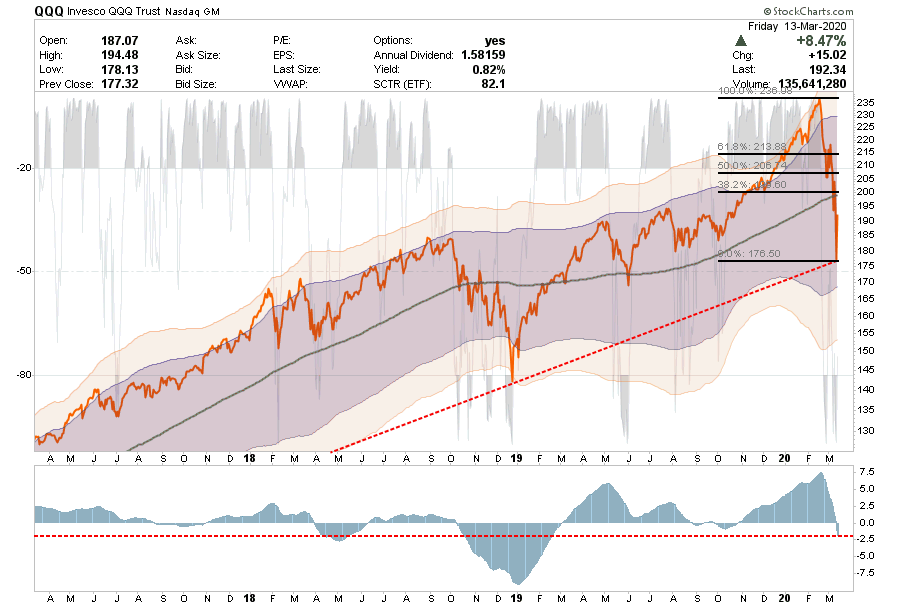
- As we have noted previously, QQQ is by far “the best index” to own currently from a technical basis.
- QQQ is outperforming the SPY by a wide margin, but not surprising given the top-5 stocks in the SPY are also the top-5 in the QQQ and are most technology related shares.
- Last week’s break above the 200-dma and the 61.8% sets up a test of “all-time” highs. (Pretty incredible when you think about the amount of economic devastation that is coming.)
- But, from a trading perspective, “What is…is.”
- Short-Term Positioning: Bearish – Market Risk Is High
- Last Week: No positions
- This Week: Trading “Rentals” Only
- Stop-loss moved up to $200
- Long-Term Positioning: Bearish due to valuations
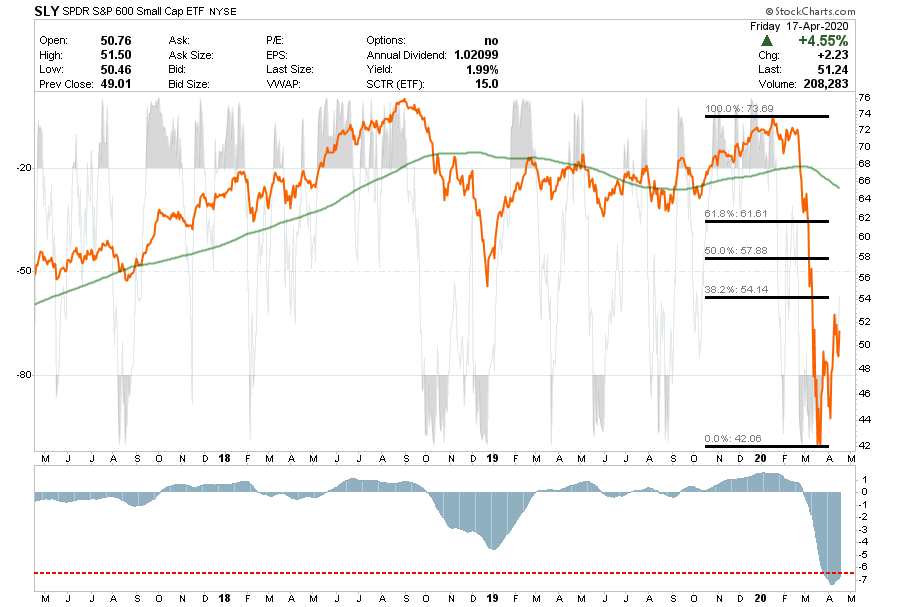
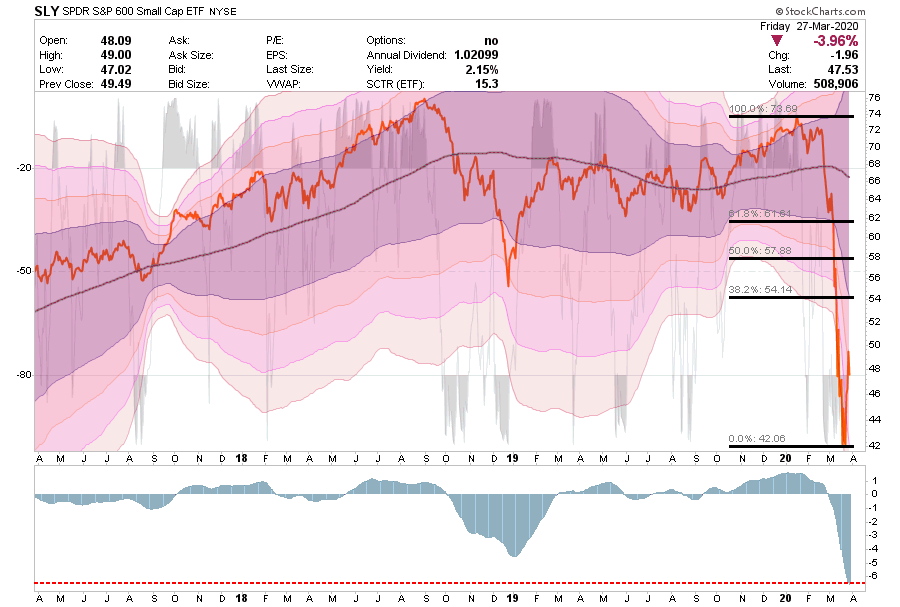
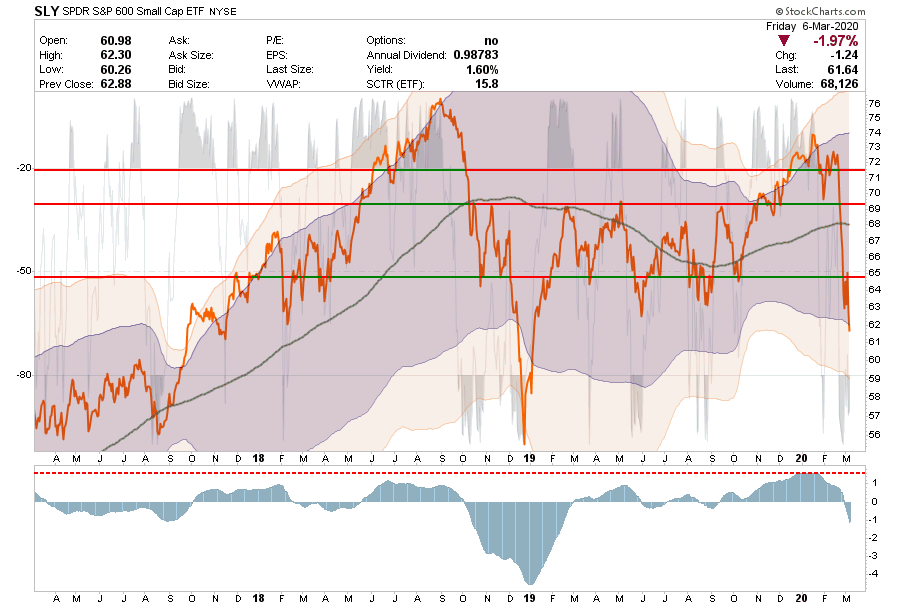
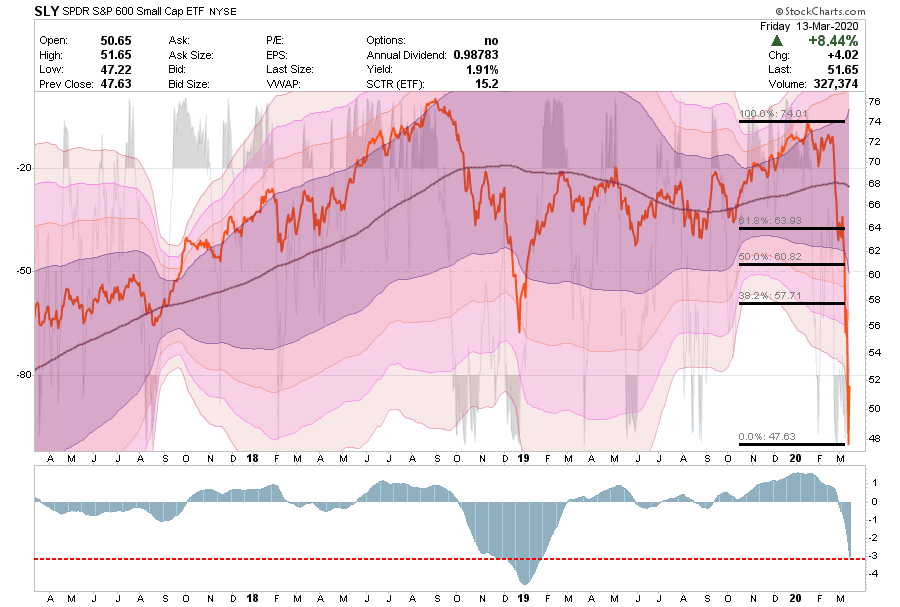
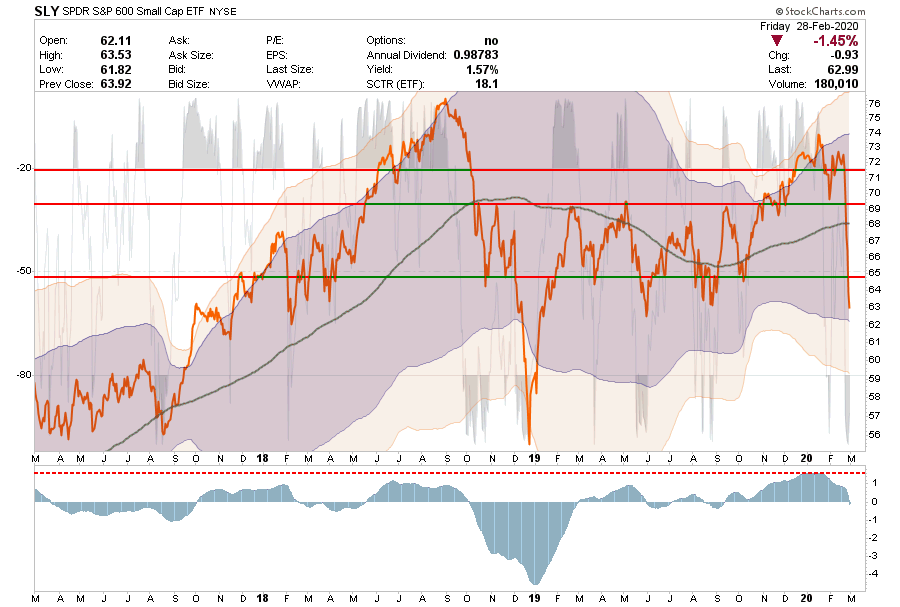
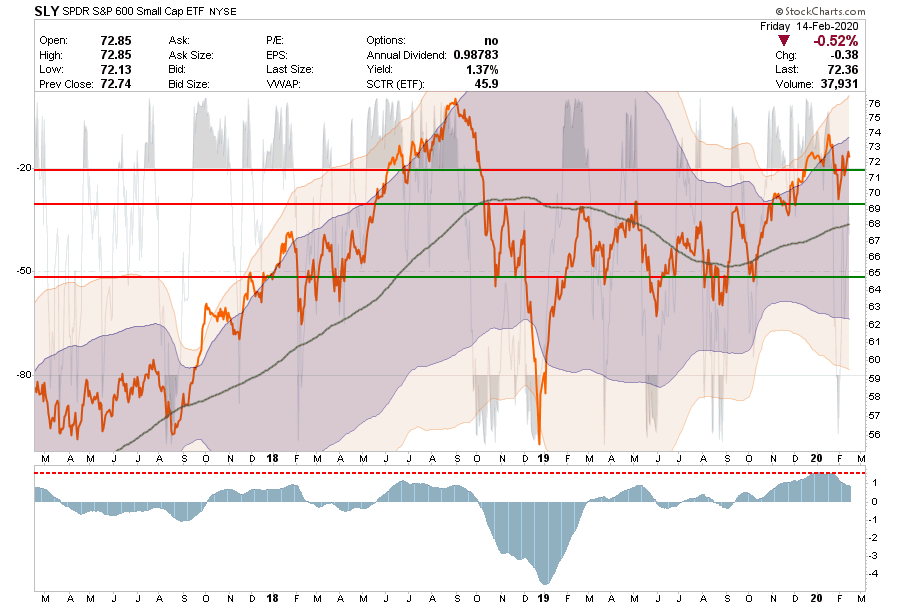
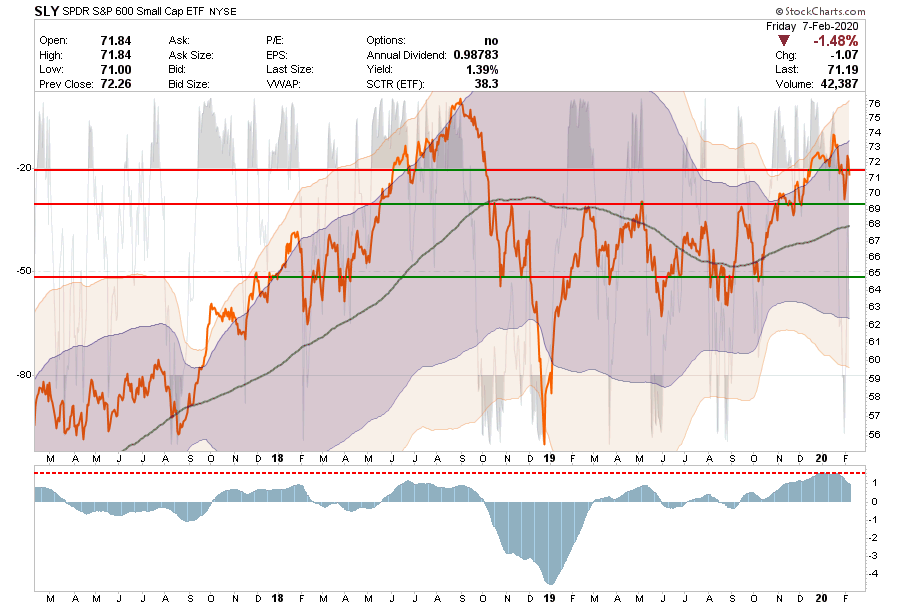
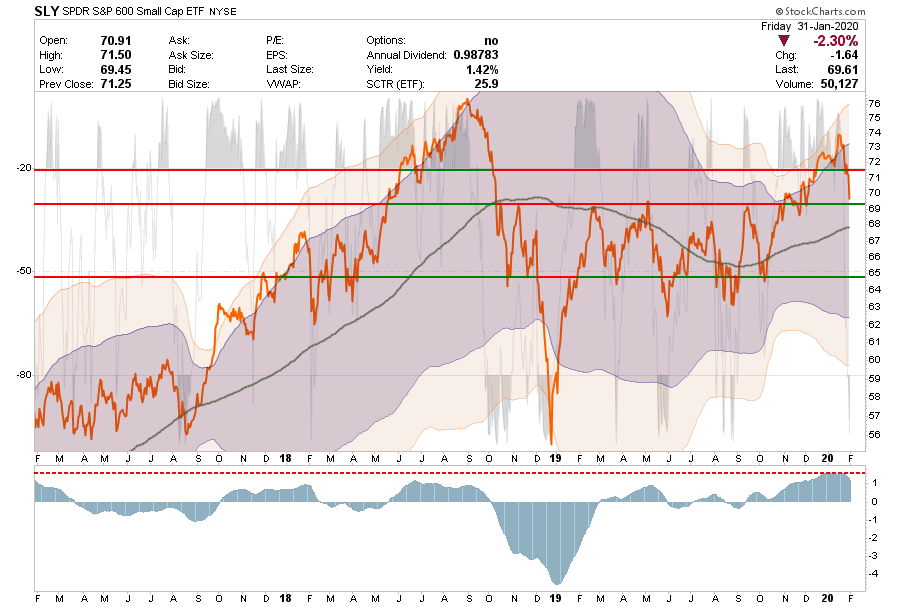
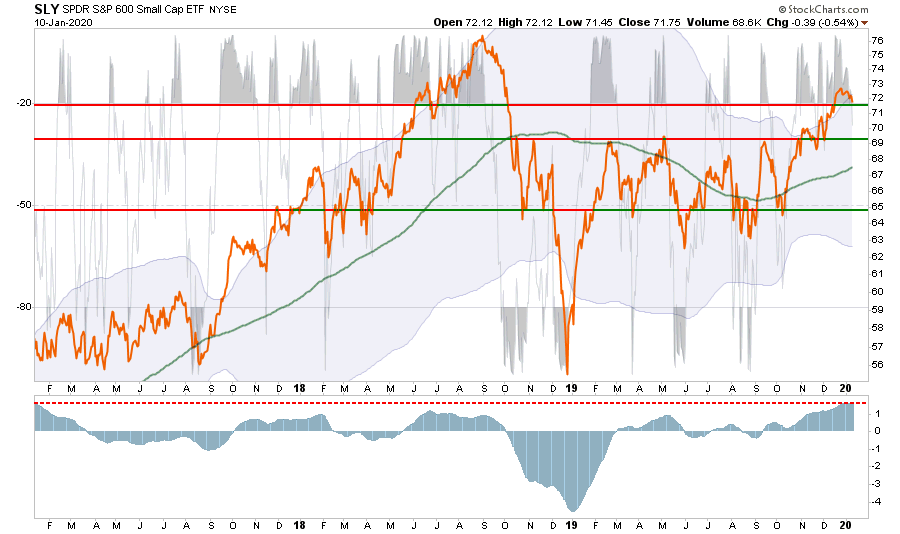
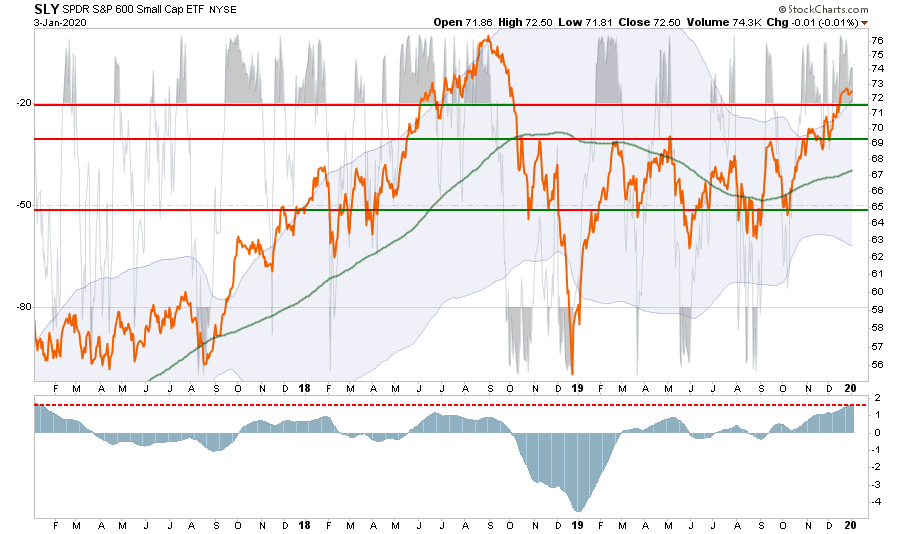
S&P 600 Index (Small-Cap)
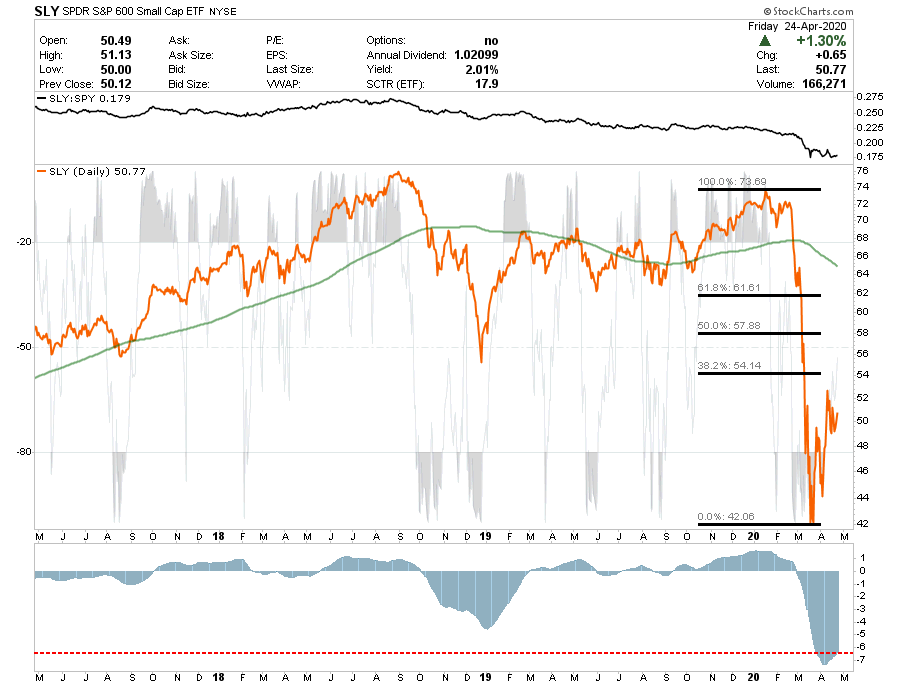
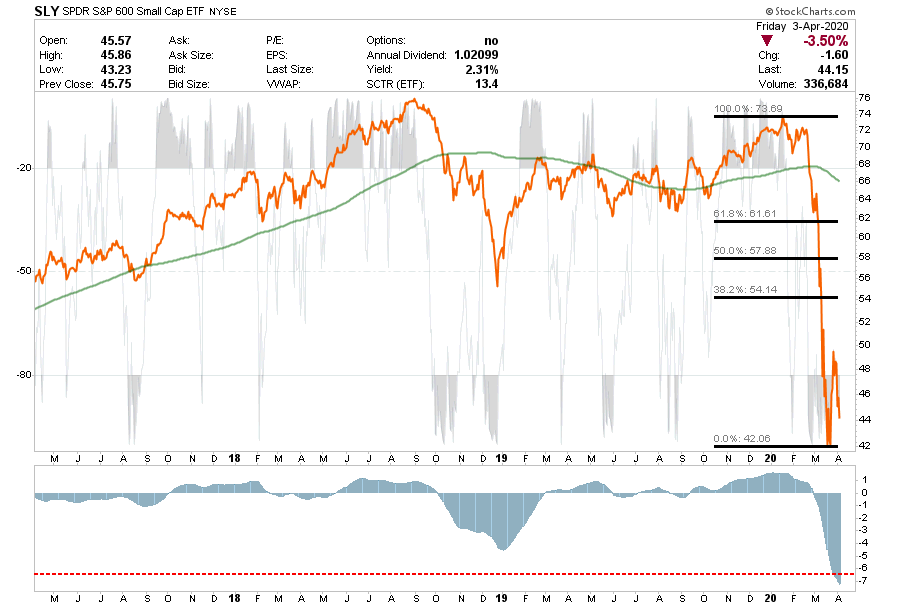
- Small caps continue to sorely underperform large caps in the current environment which also suggests the broader market remains at risk as well.
- No change to our positioning on Small-caps which are still “no place to be as both small and mid-cap companies are going to be hardest hit by the virus.”
- Be careful what you own.
- Avoid small-caps.
- Short-Term Positioning: Bearish – Market Risk Is High
- Last Week: No positions
- This Week: No positions.
- Stop loss adjusted to $44 on trading positions.
- Long-Term Positioning: Bearish
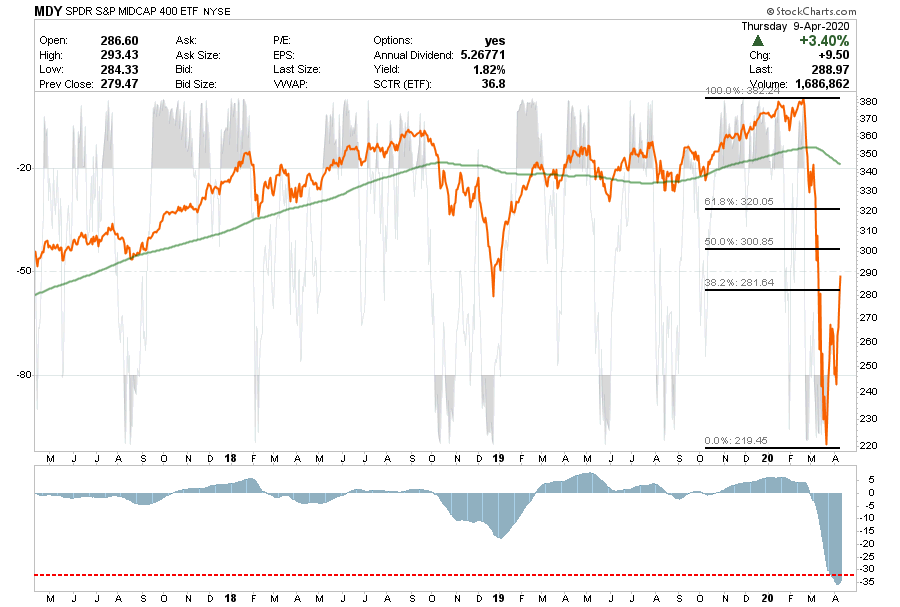
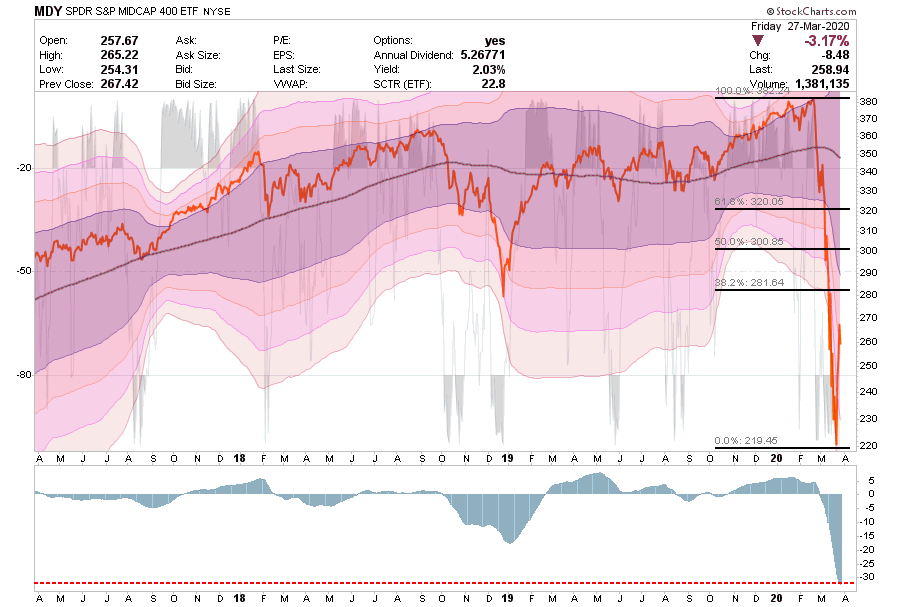
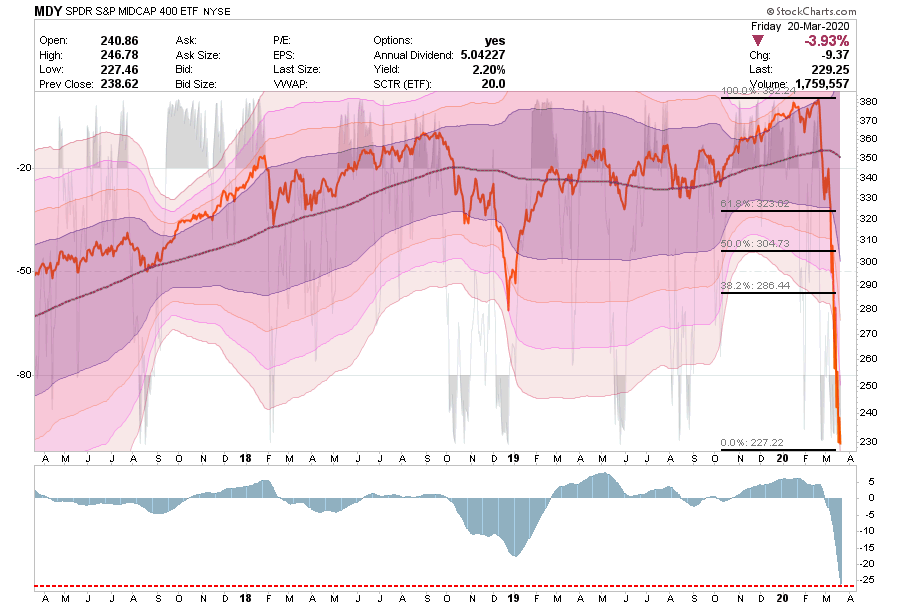
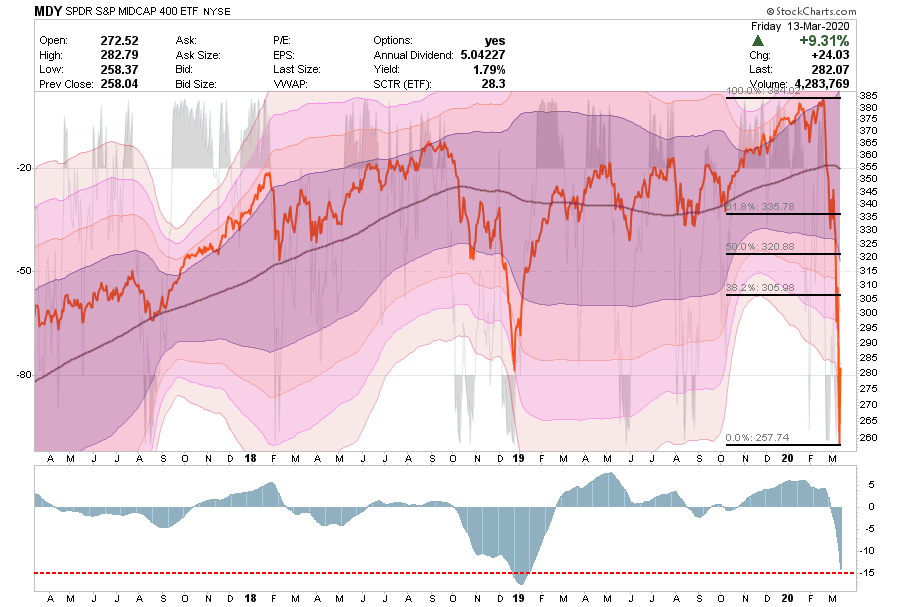
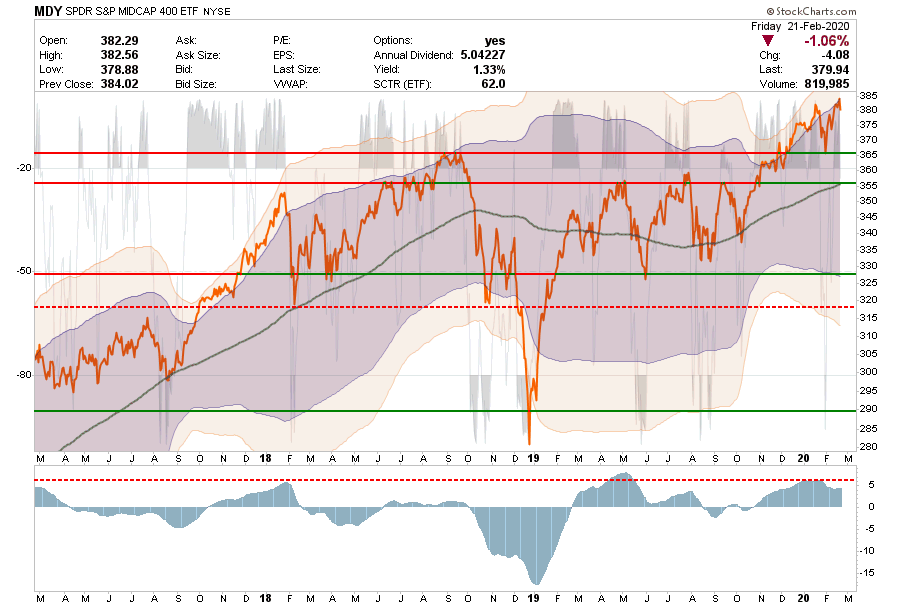
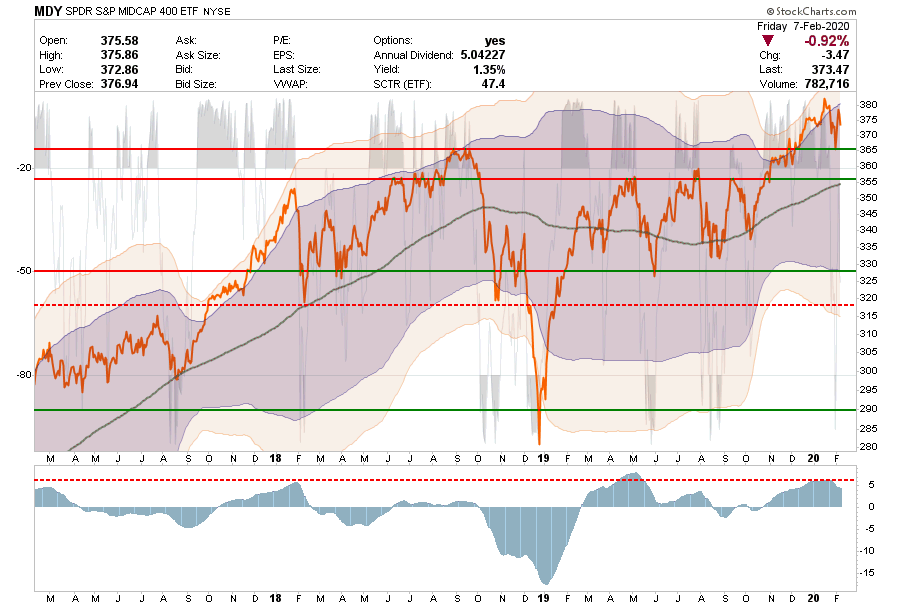
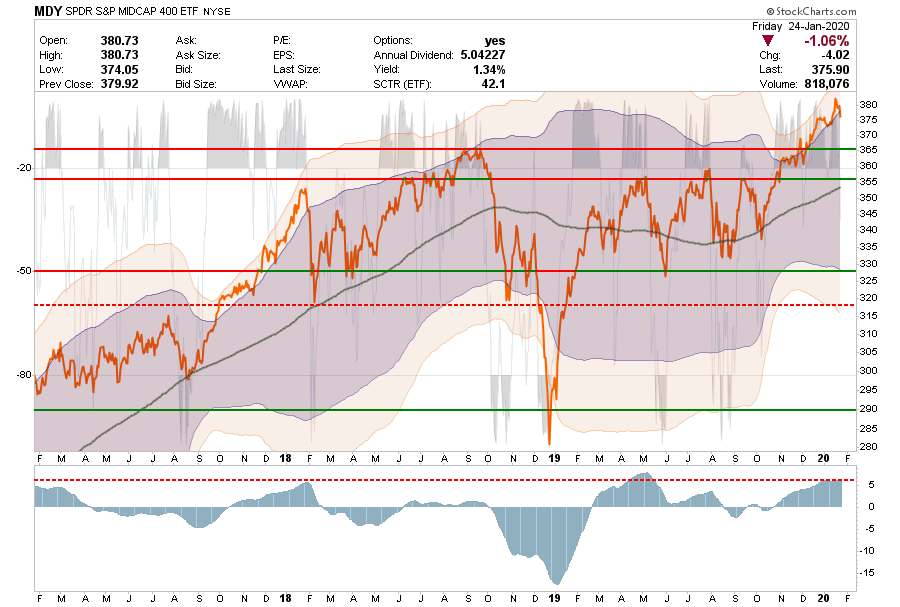
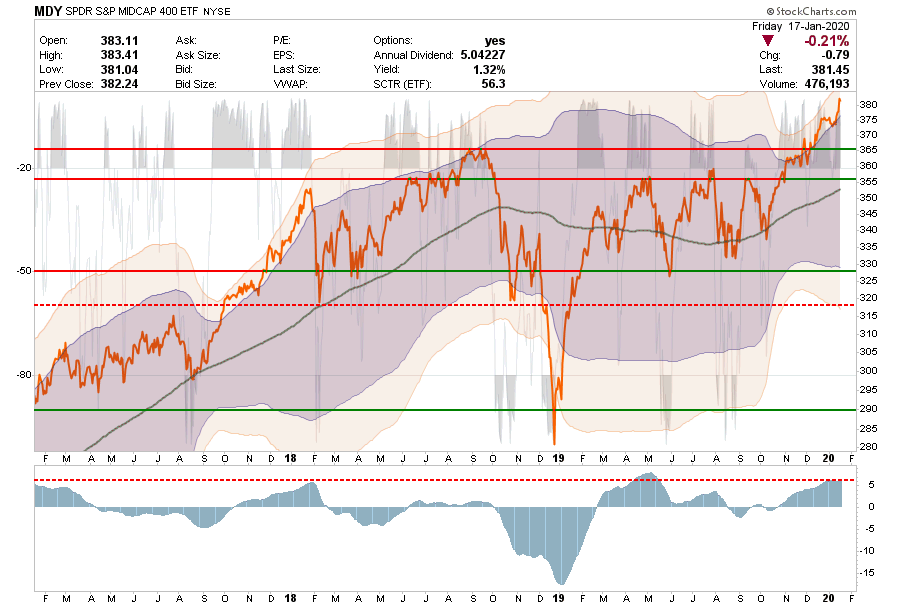
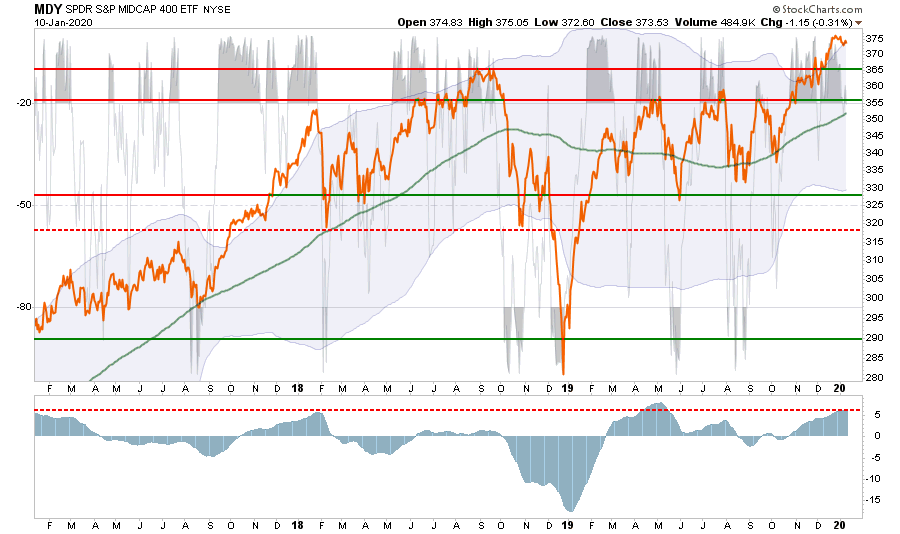
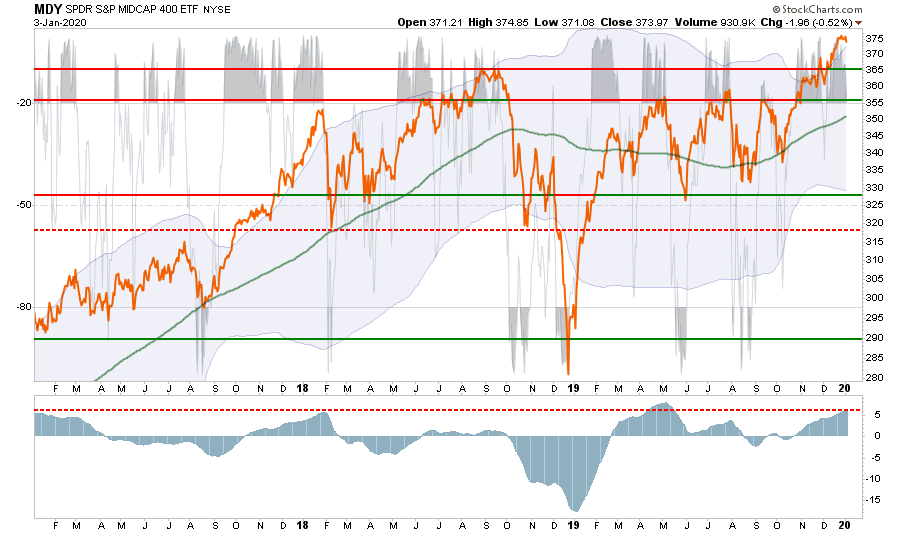
S&P 400 Index (Mid-Cap)
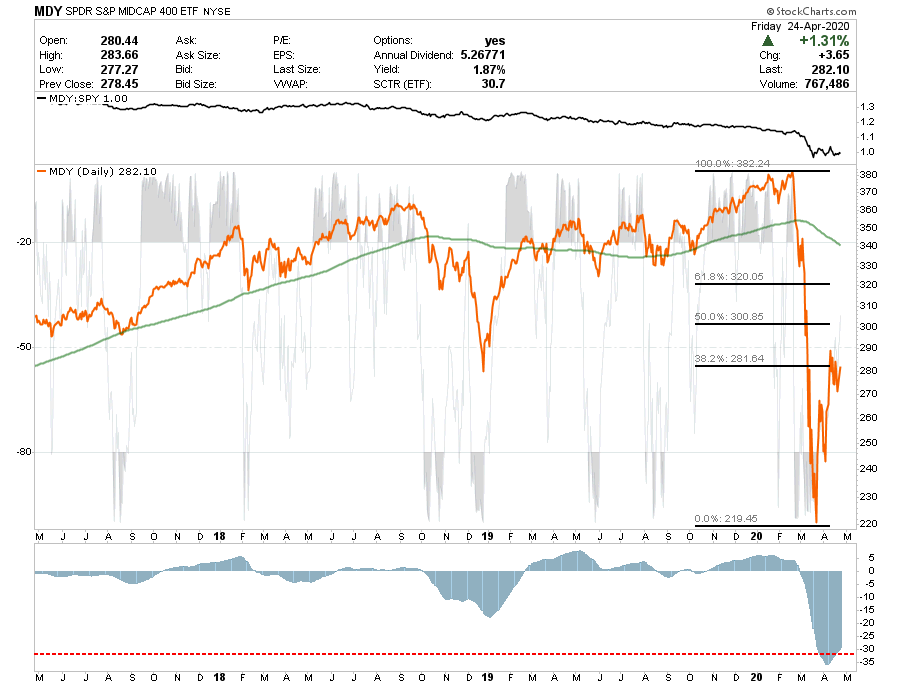
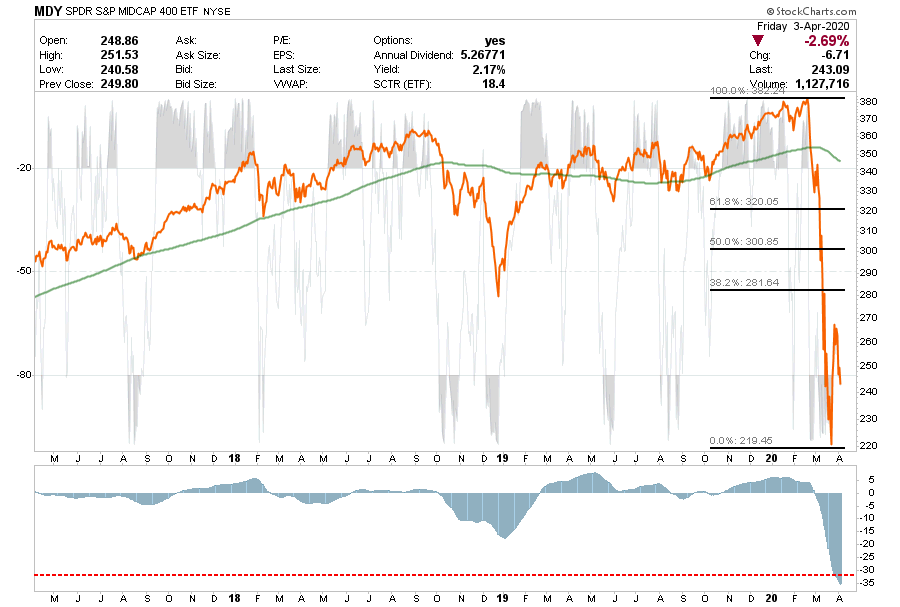
- As with Small-caps, we have no holdings.
- Relative performance continues to remain exceedingly poor. MDY failed at the 28.2% retracement level and is at risk of a much slower economic environment.
- Short-Term Positioning: Bearish – Market Risk Is High
- Last Week: No holding
- This Week: No holding
- Stop Loss moved up to $245 for trading positions.
- Long-Term Positioning: Bearish
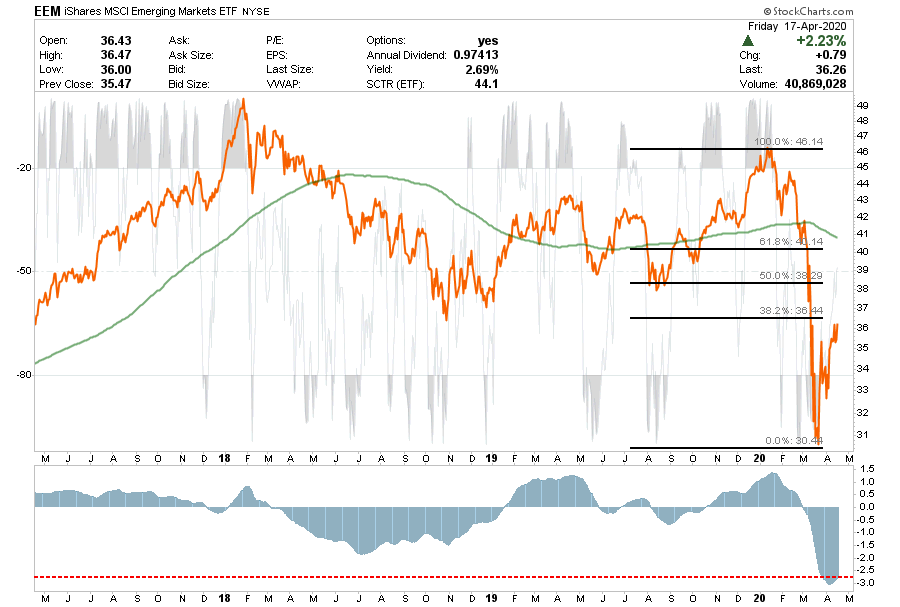
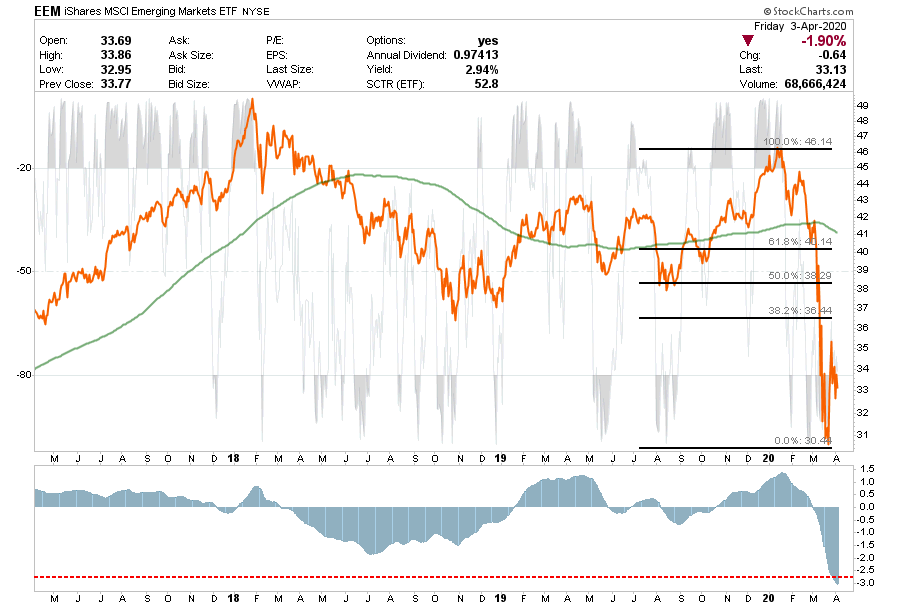
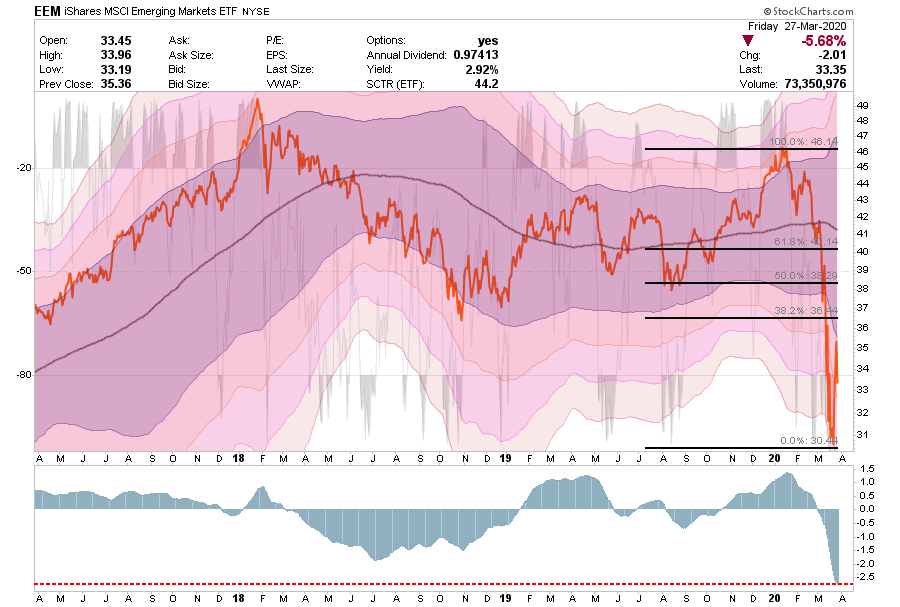
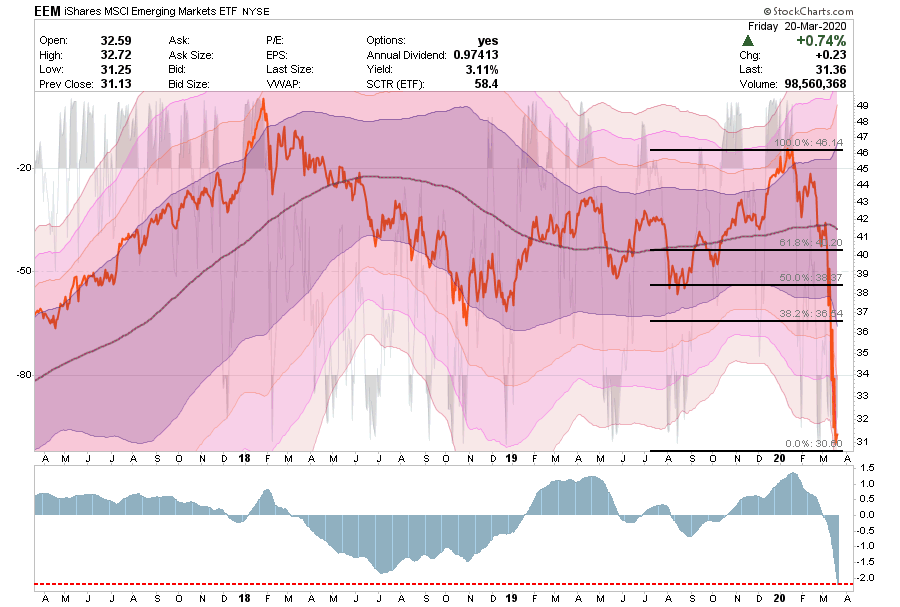
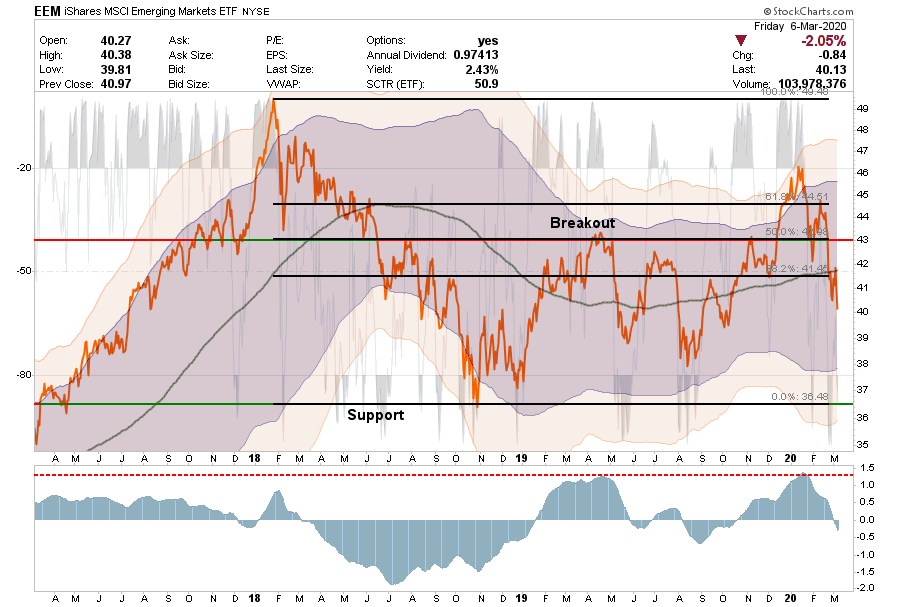
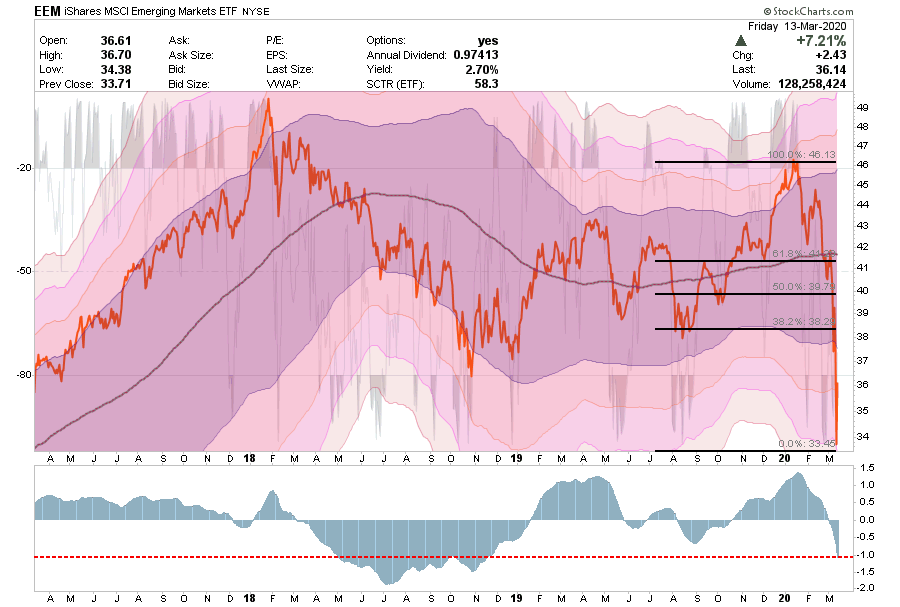
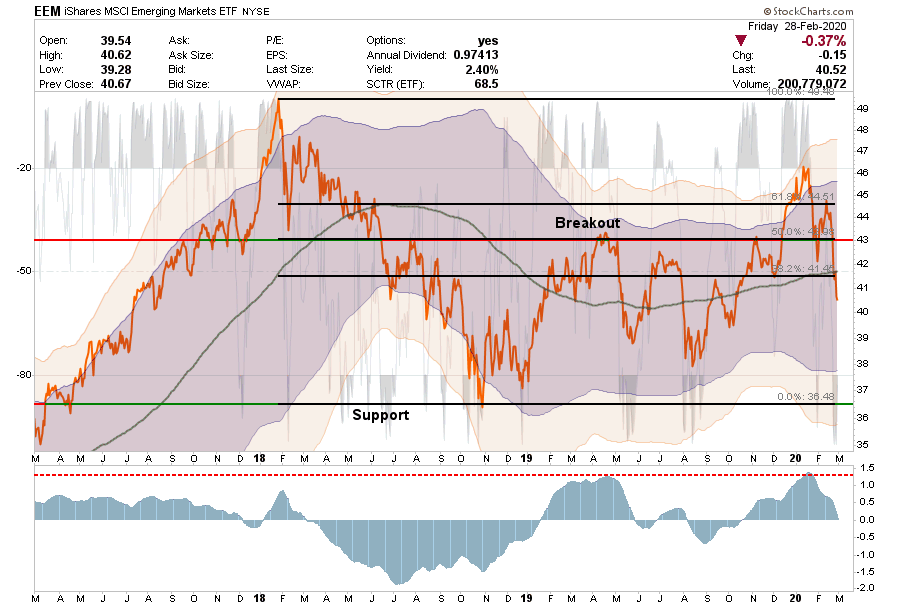
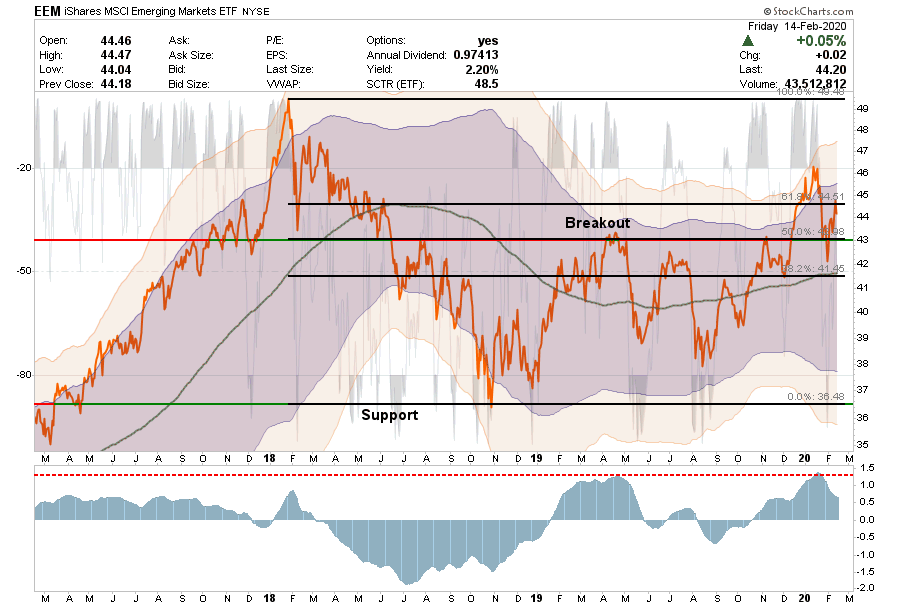
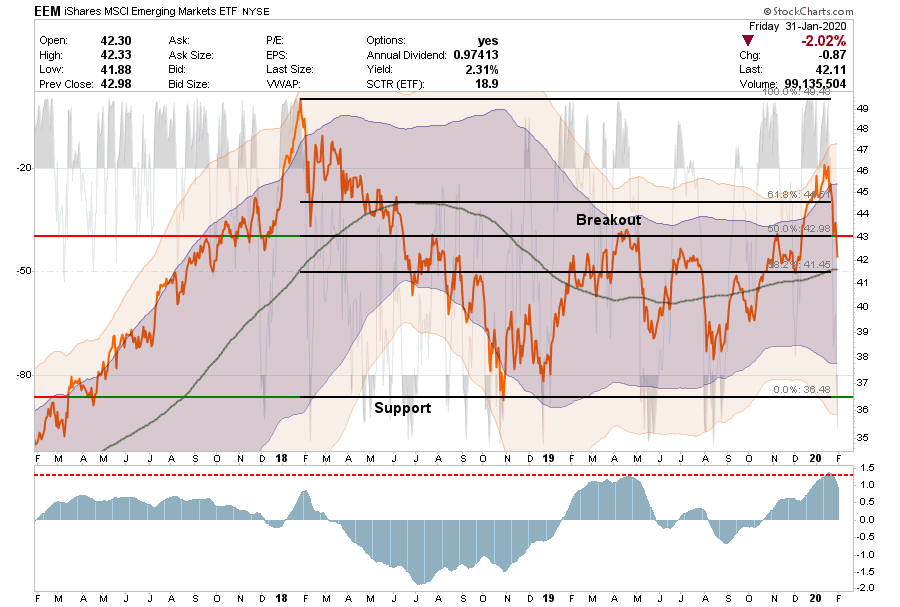
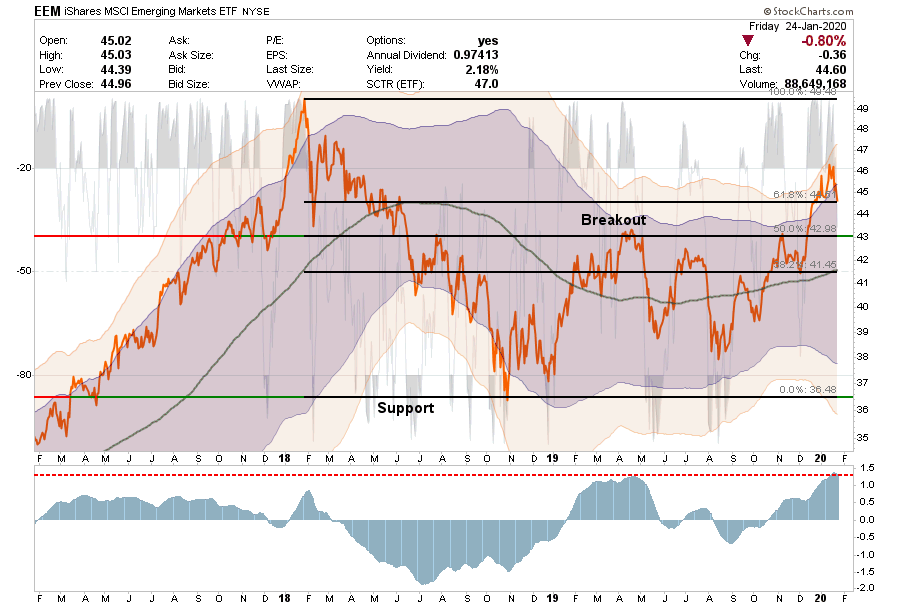
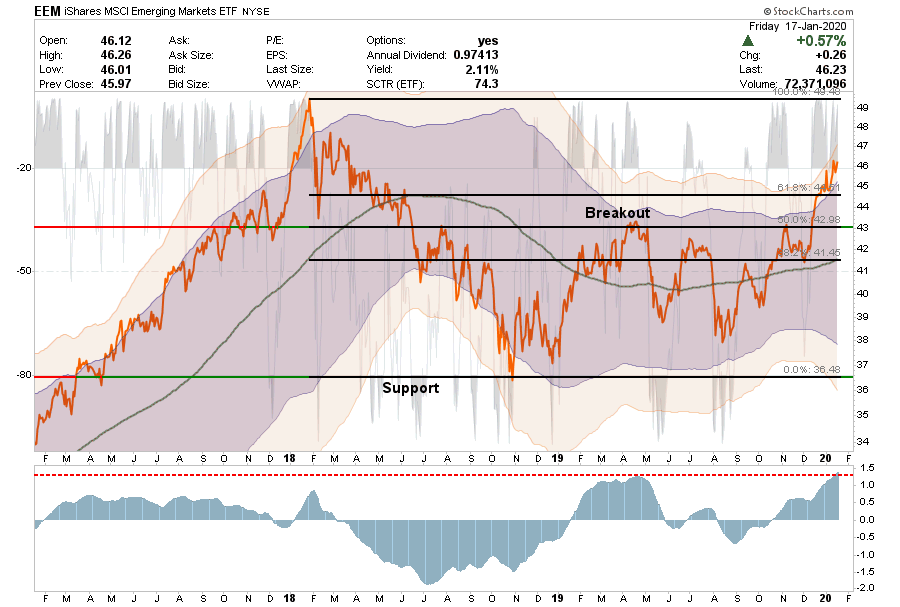
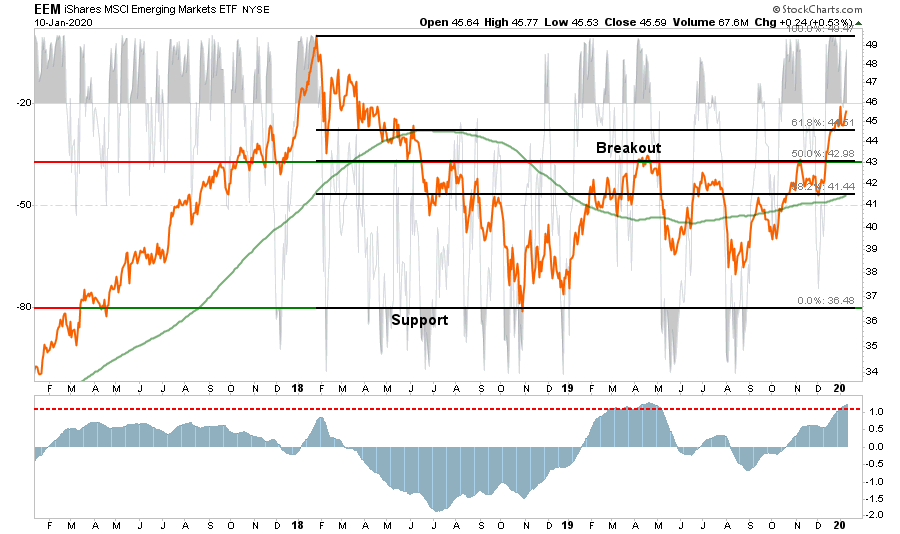
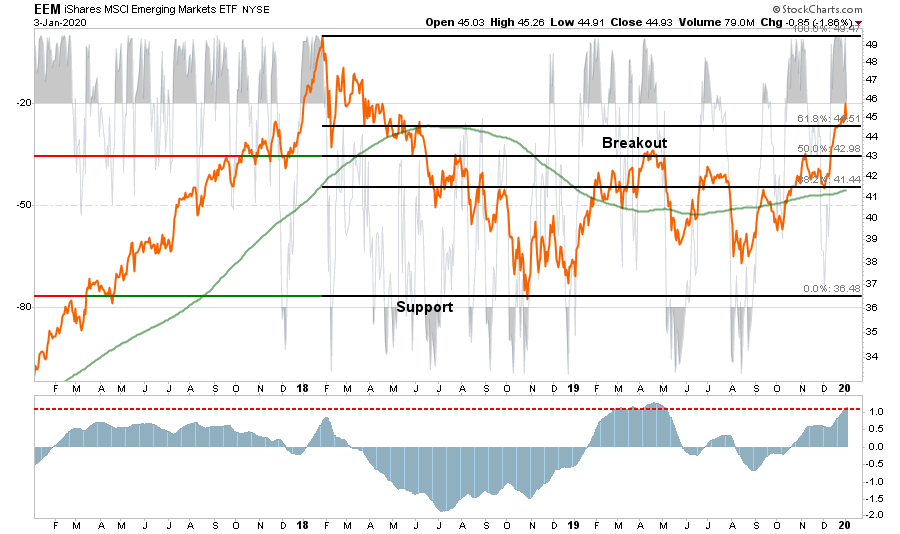
Emerging Markets
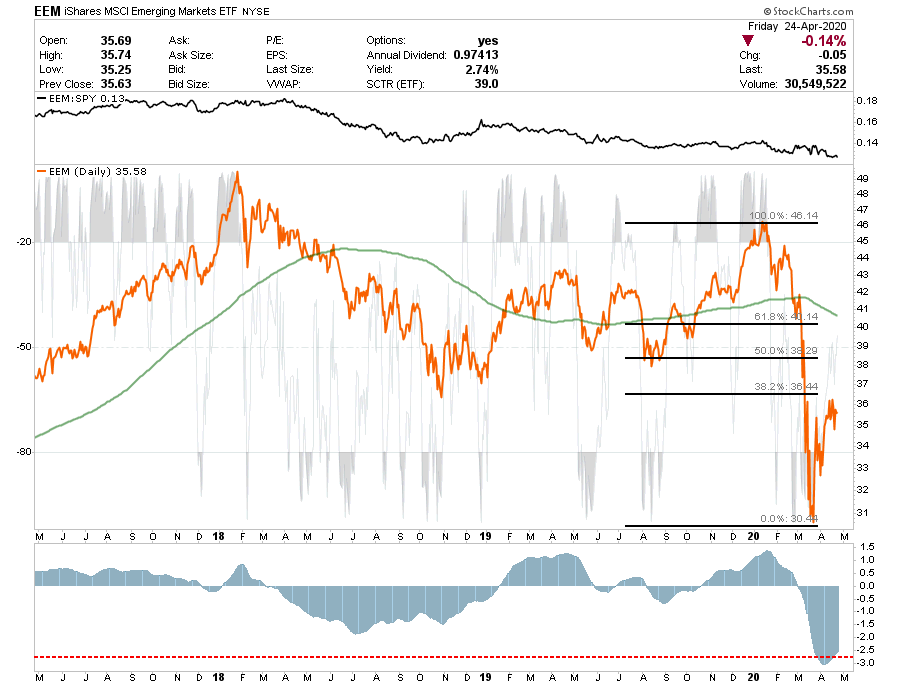
- As with small and mid-cap stocks, emerging and international markets are being hit hard by the virus. Economically, these countries are being destroyed right now.
- We previously stated that investors should use counter-trend rallies to sell into. If you haven’t done so, do so Monday. Relative performance remains exceedingly weak.
- Short-Term Positioning: Bearish – Market Risk Is High
- Last Week: No position
- This Week: No position.
- Stop-loss moved up to $33 for trading positions.
- Long-Term Positioning: Bearish
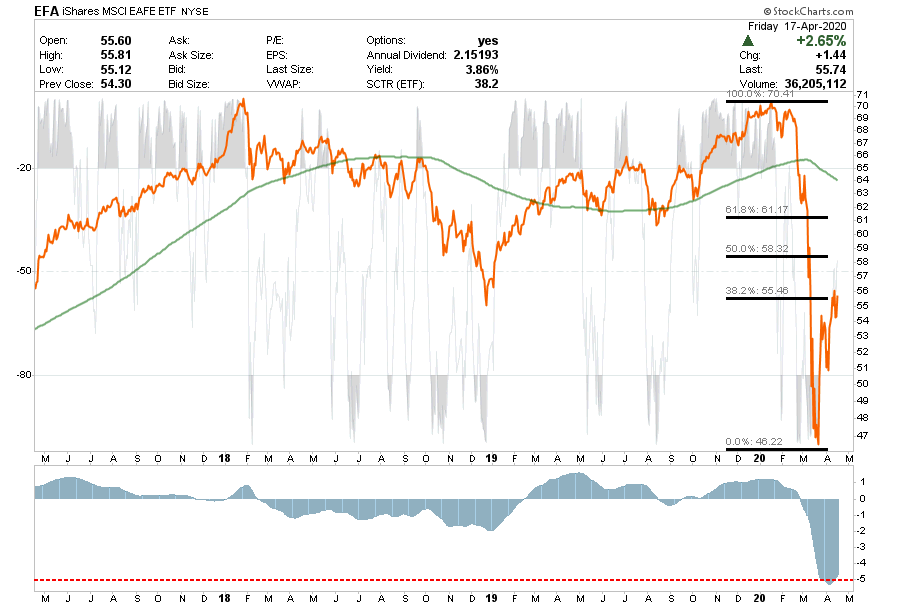
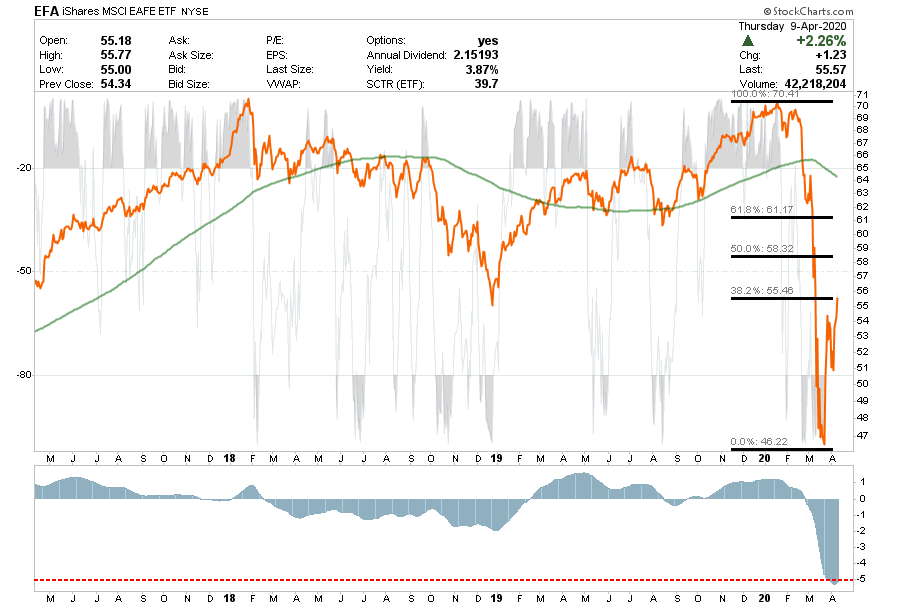
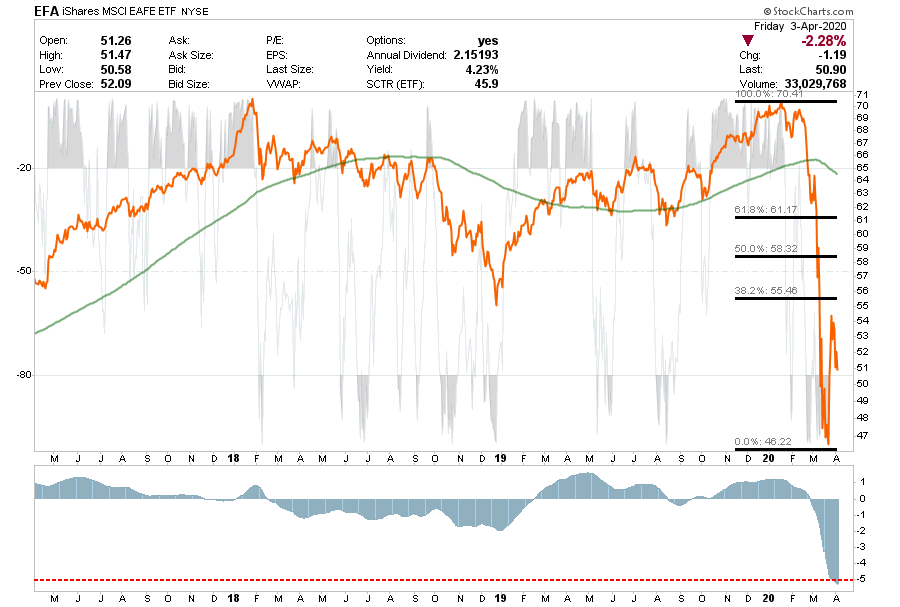
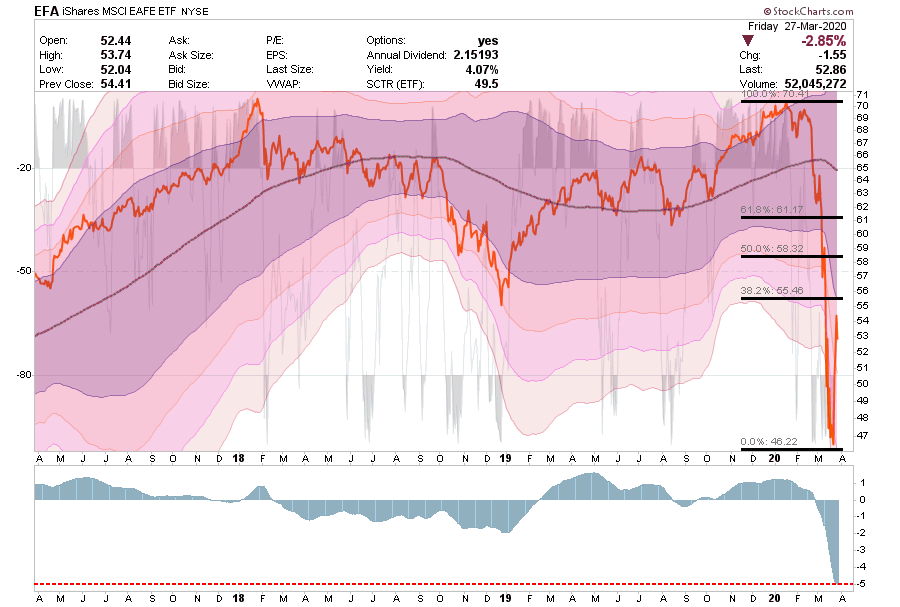
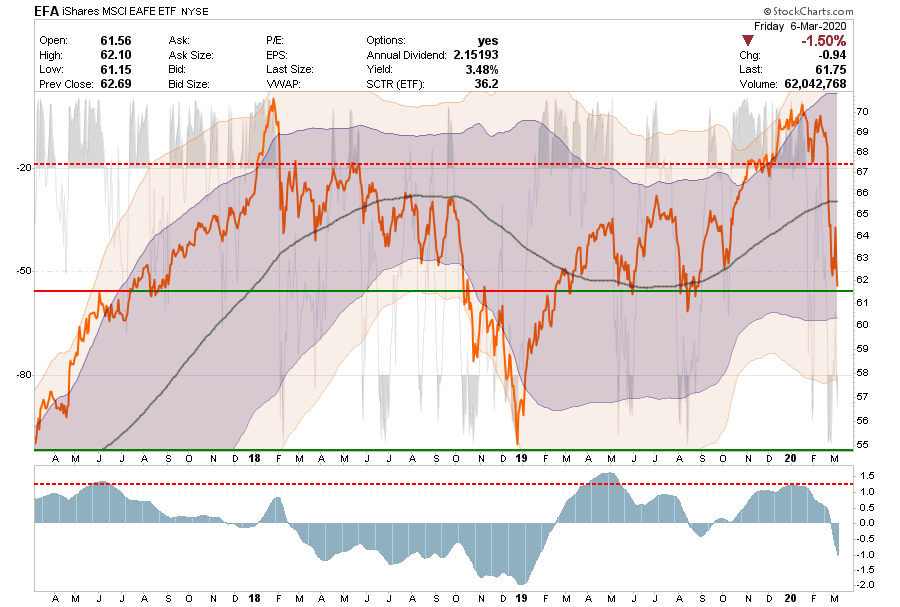
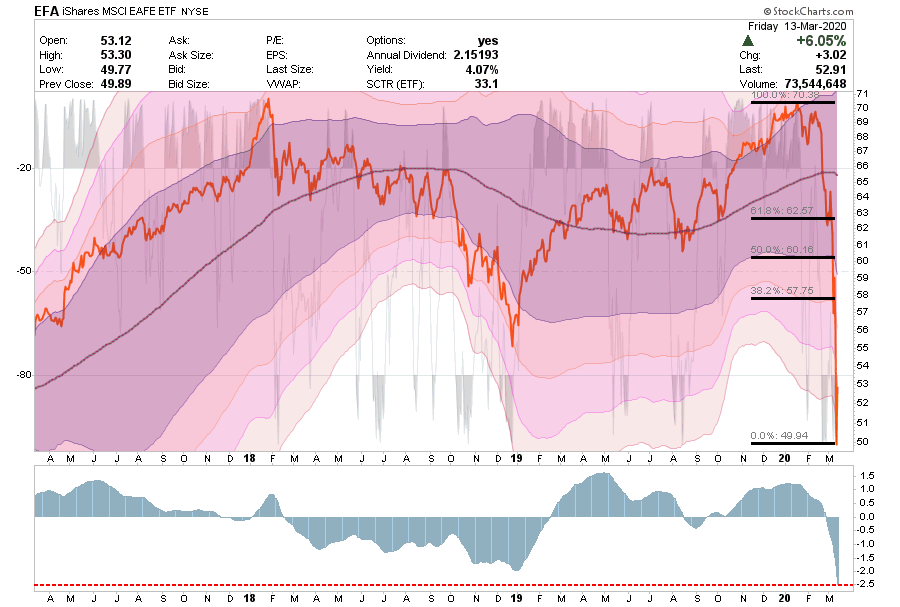
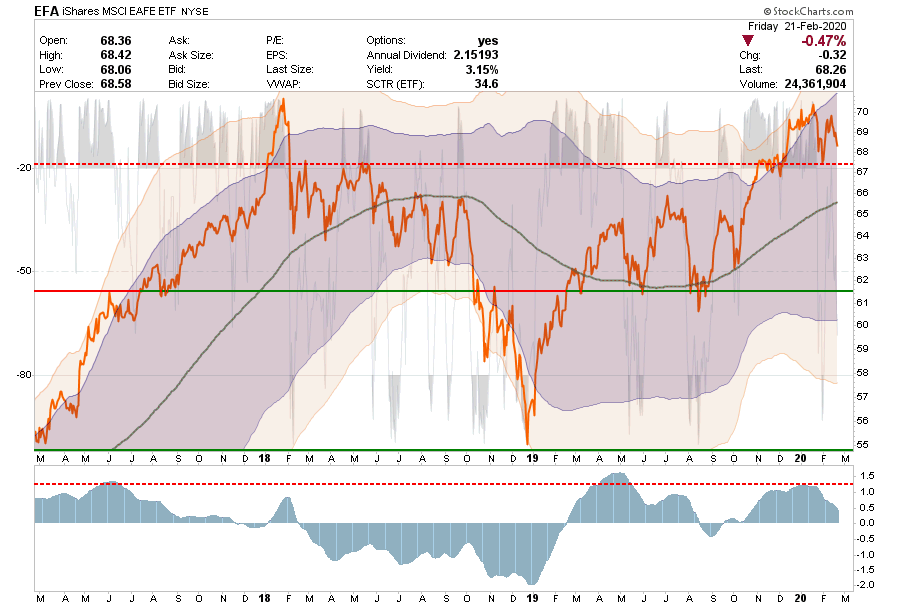
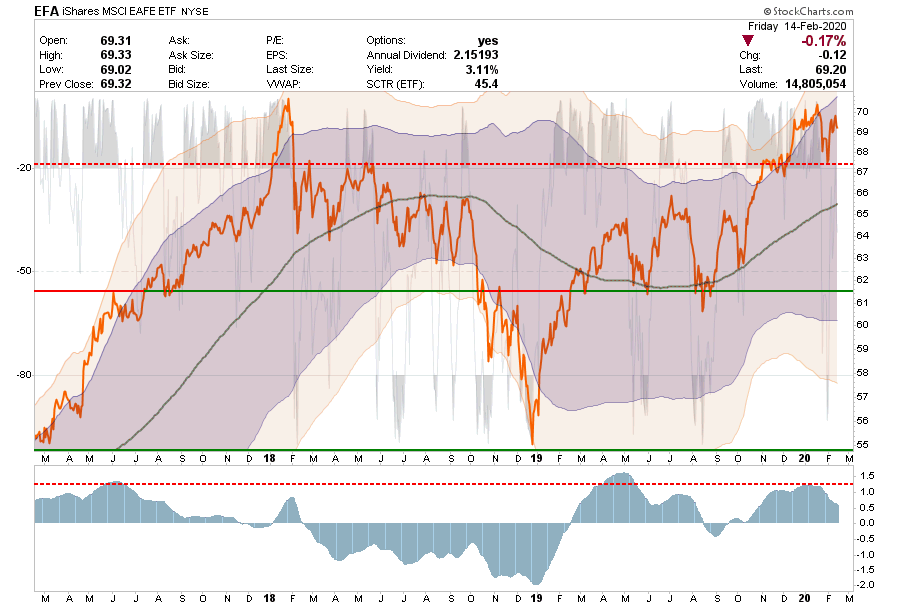
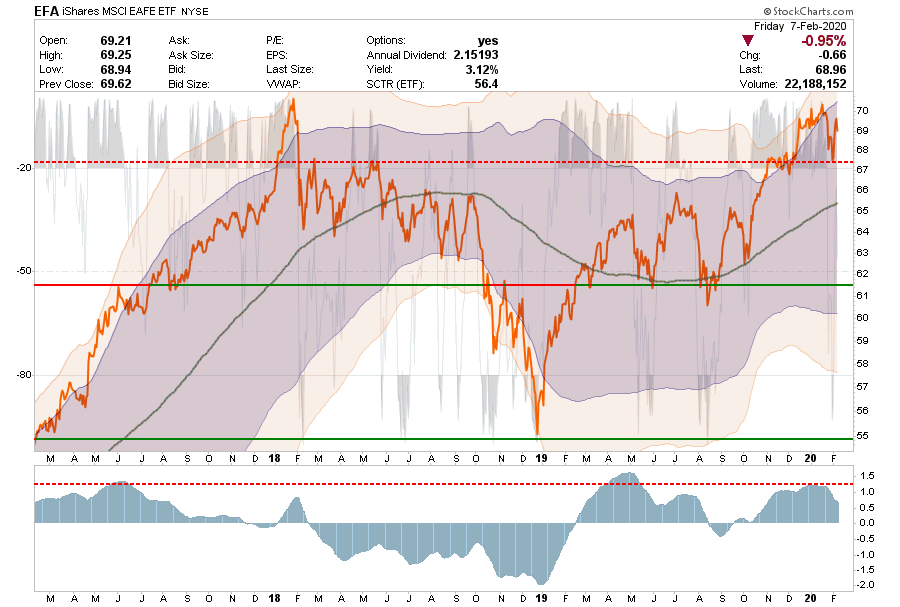
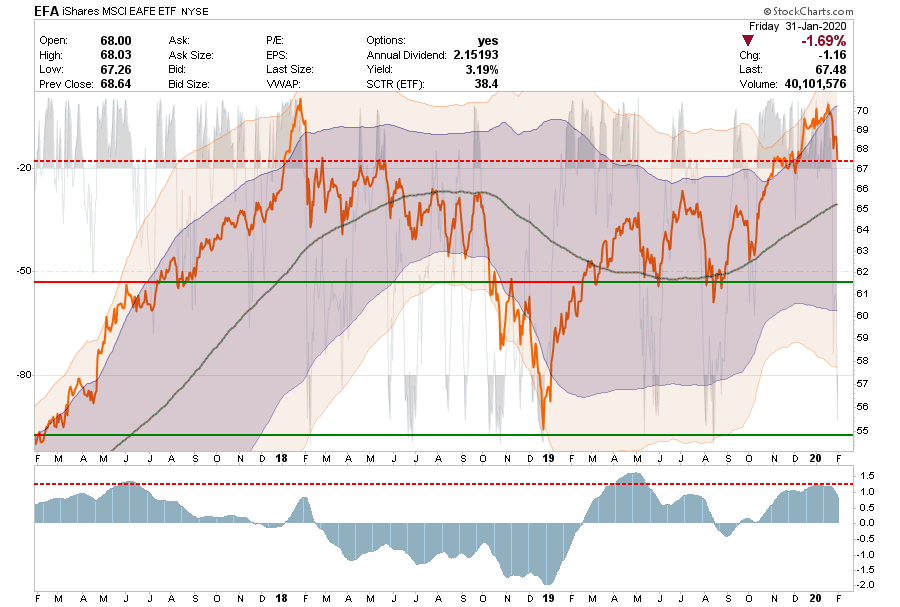
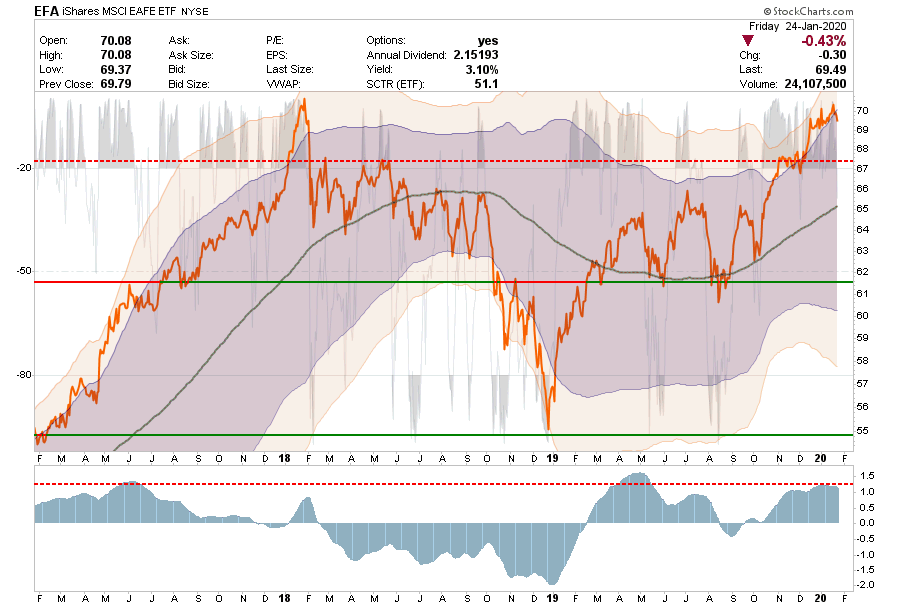
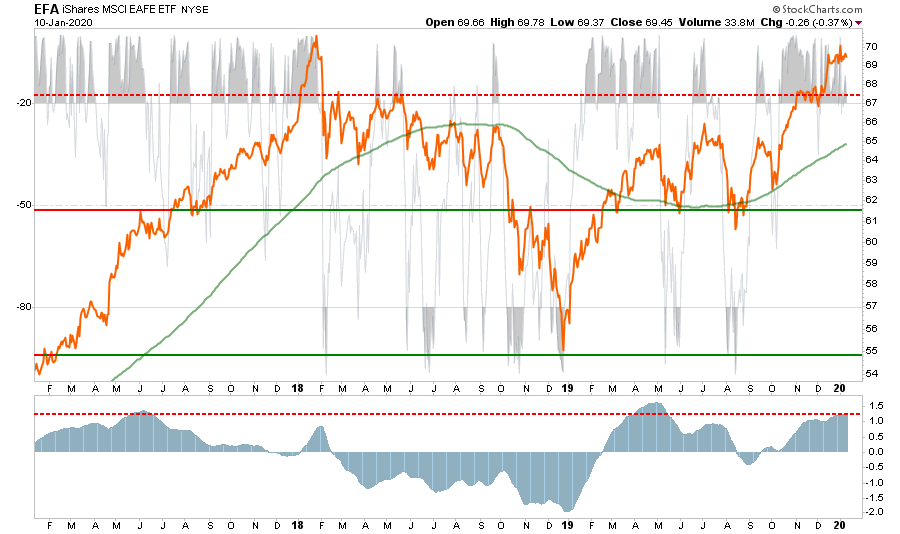
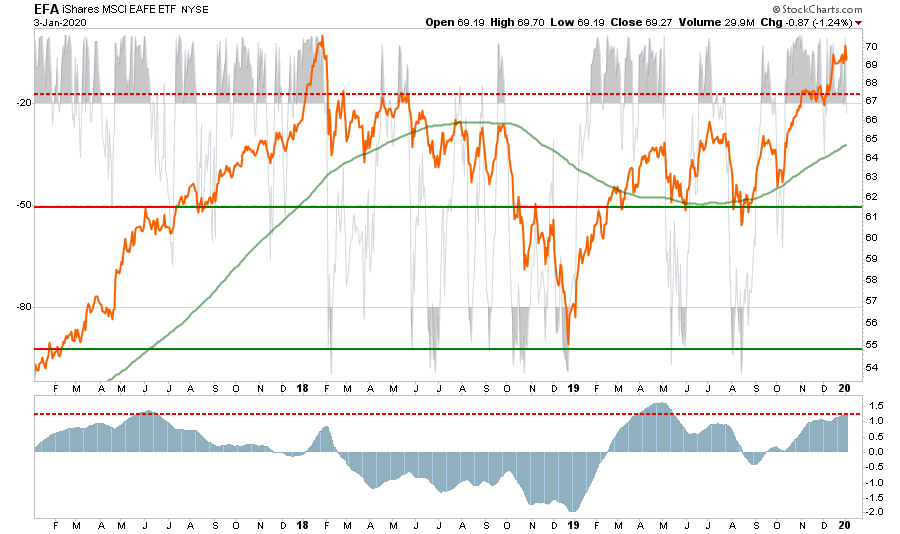
International Markets
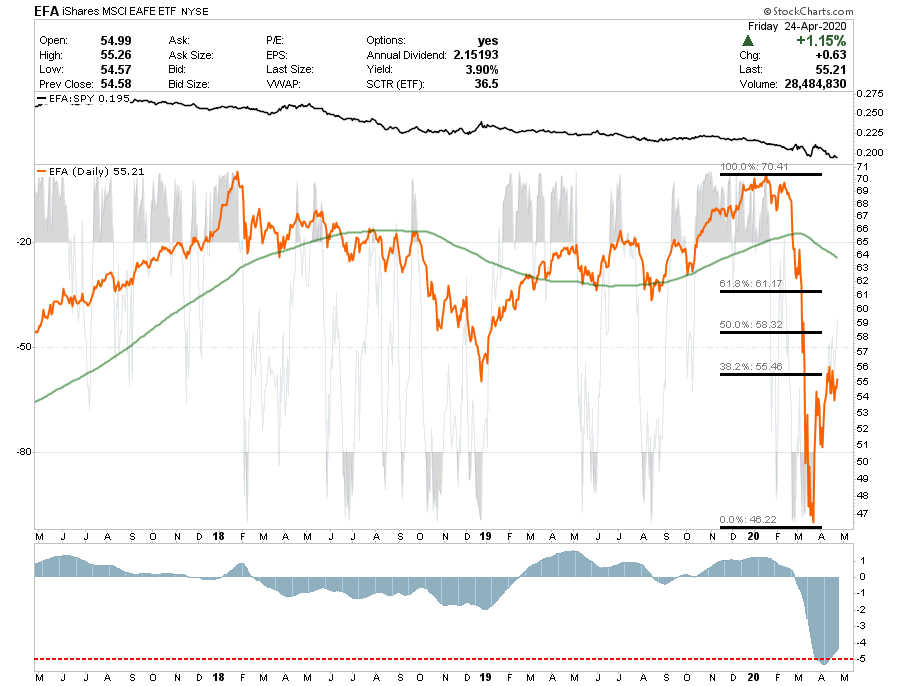
- Same with EFA as with EEM.
- The rally failed at the 28.2% retracement and relative performance remains exceedingly weak.
- Remain out of these markets for the time being.
- Short-Term Positioning: Bearish – Market Risk Is High
- Last Week: No position.
- This Week: No position.
- Stop-loss moved up to $51 for trading positions.
- Long-Term Positioning: Bearish
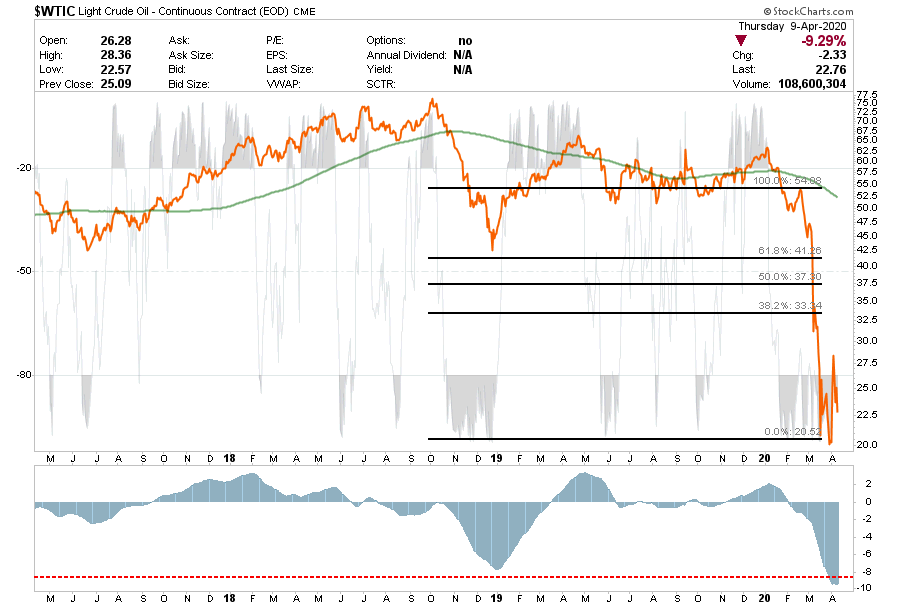
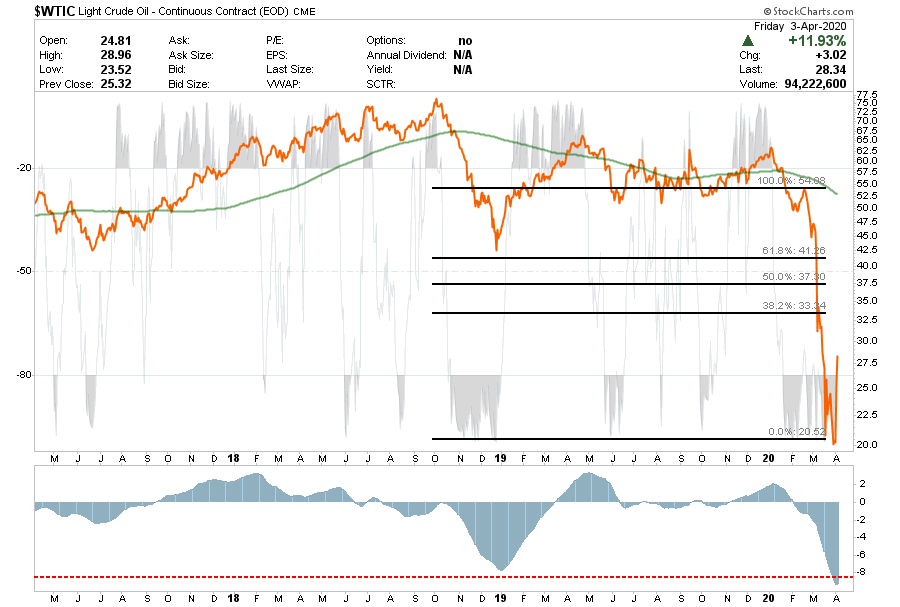
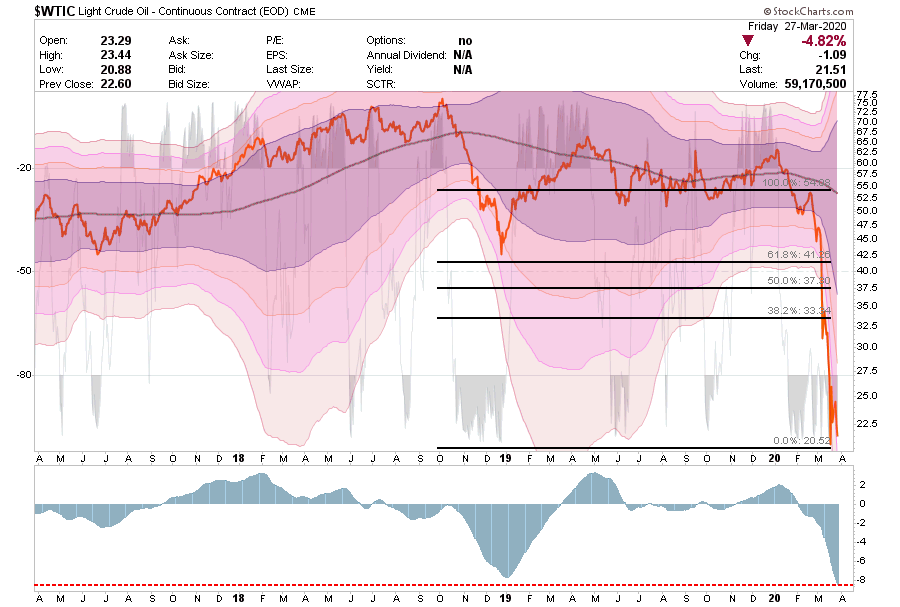
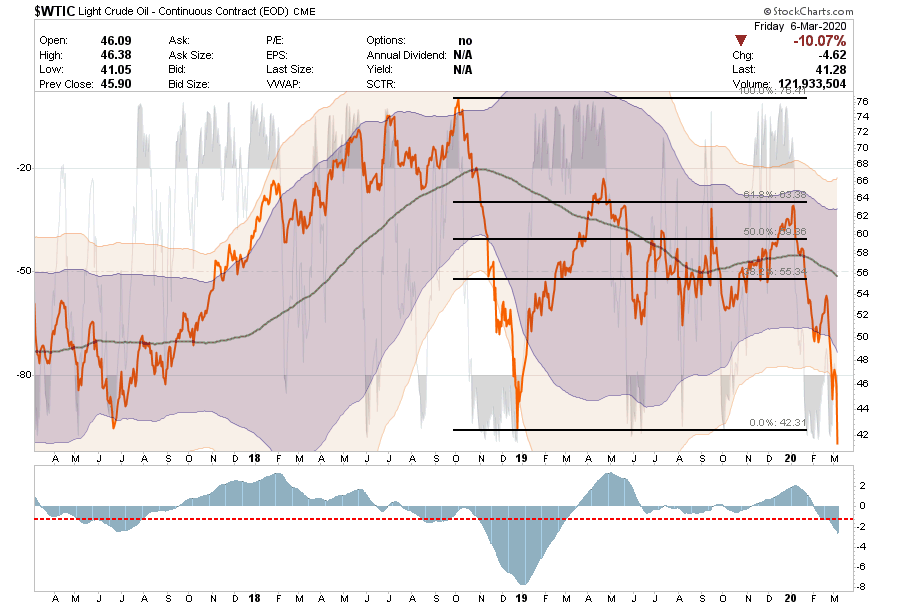
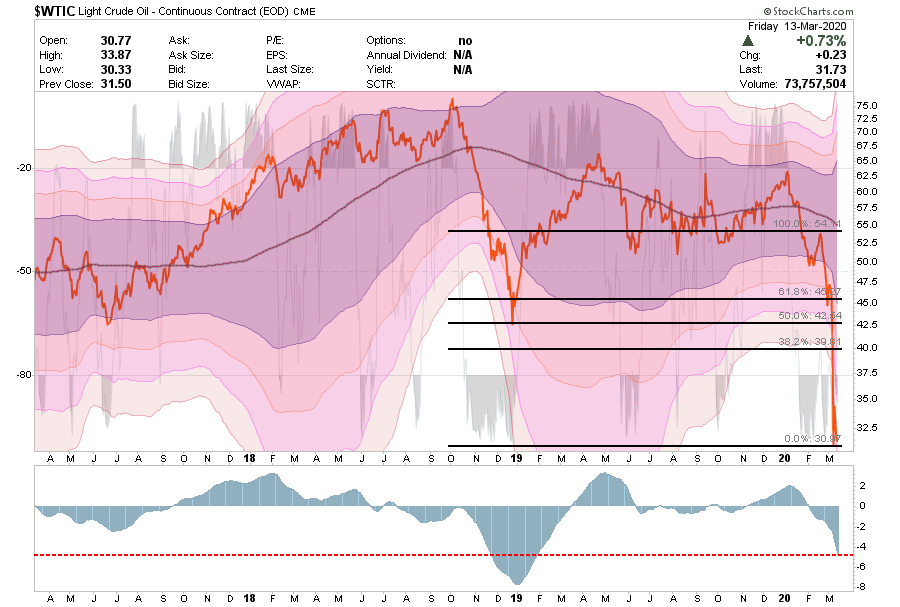
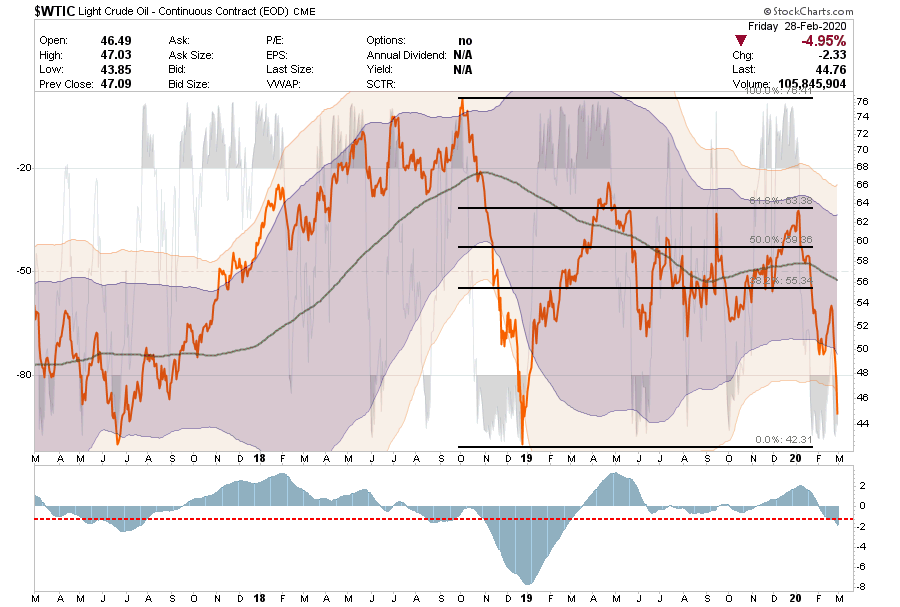
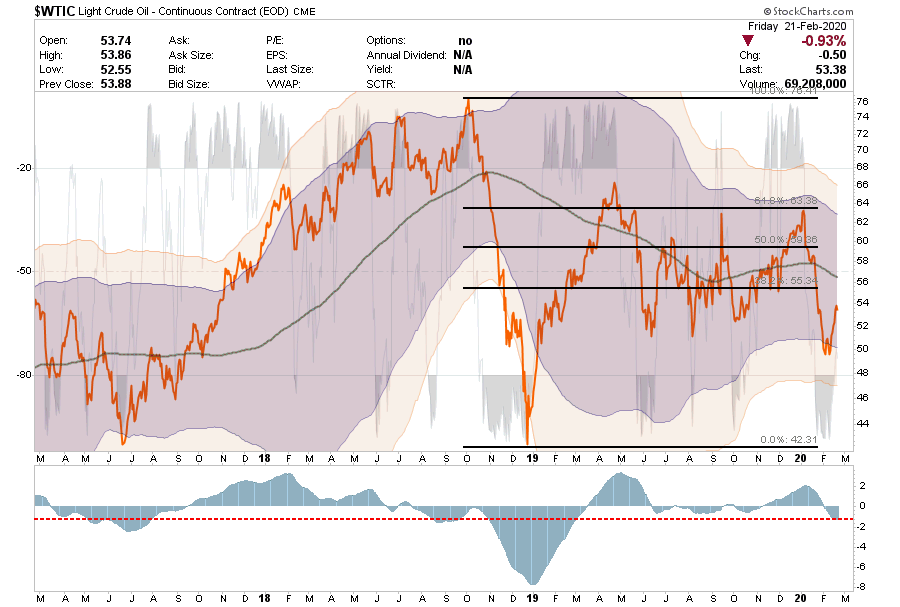
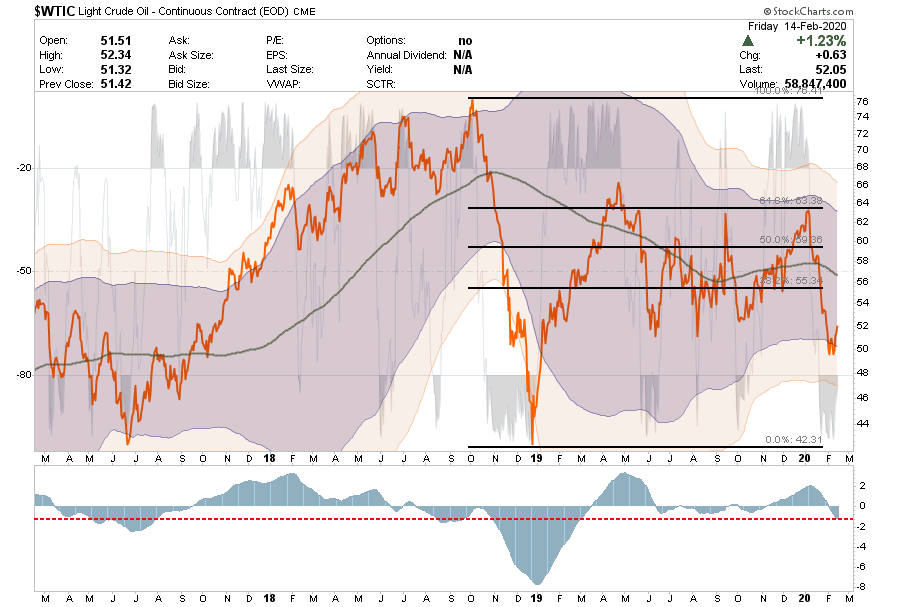
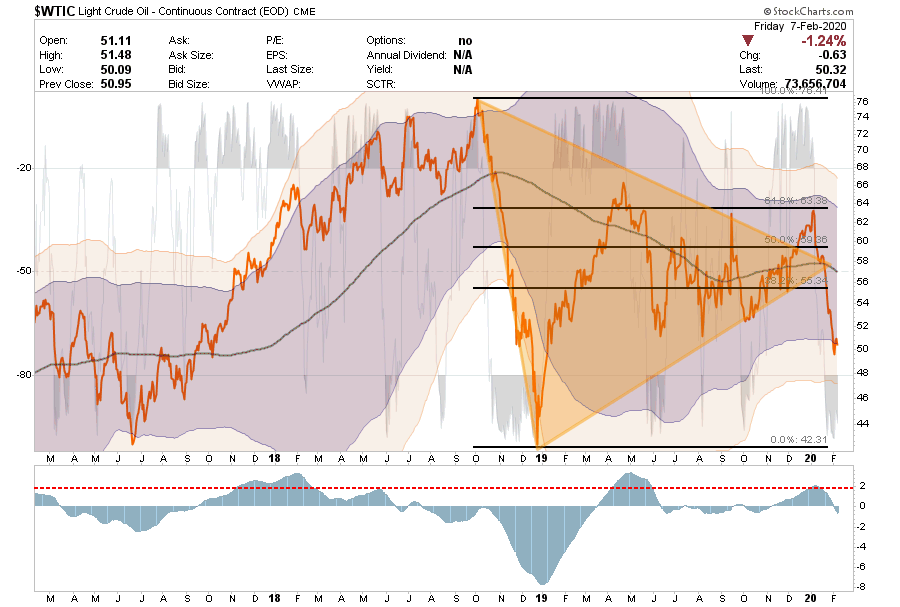
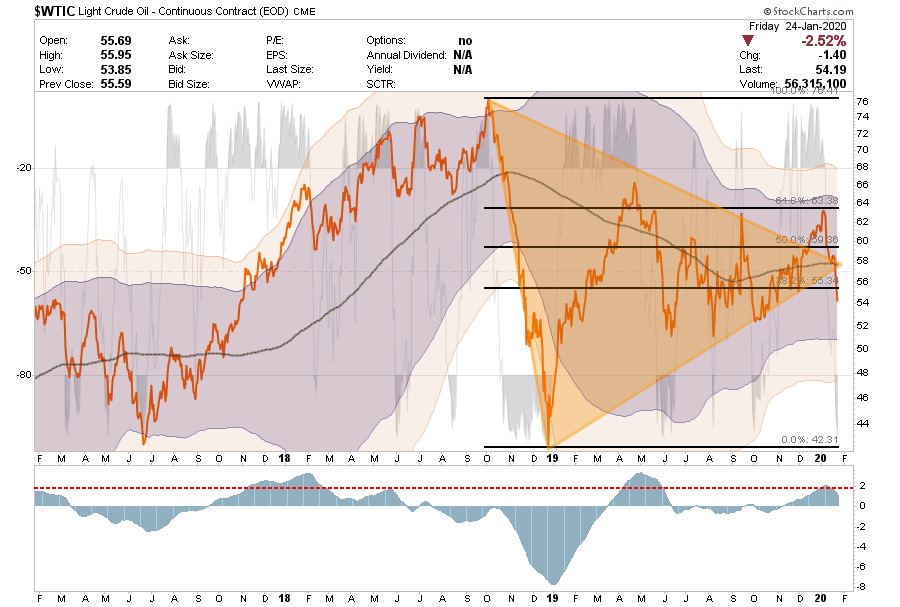
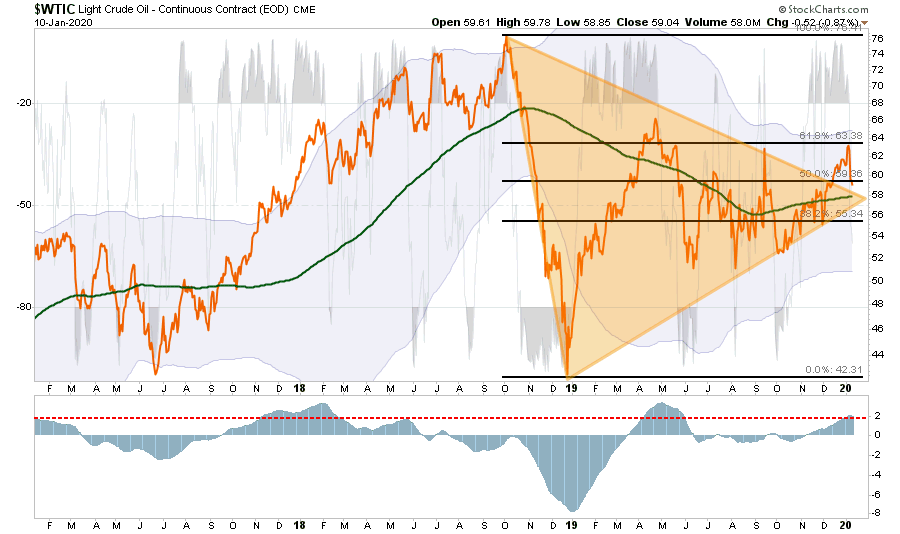
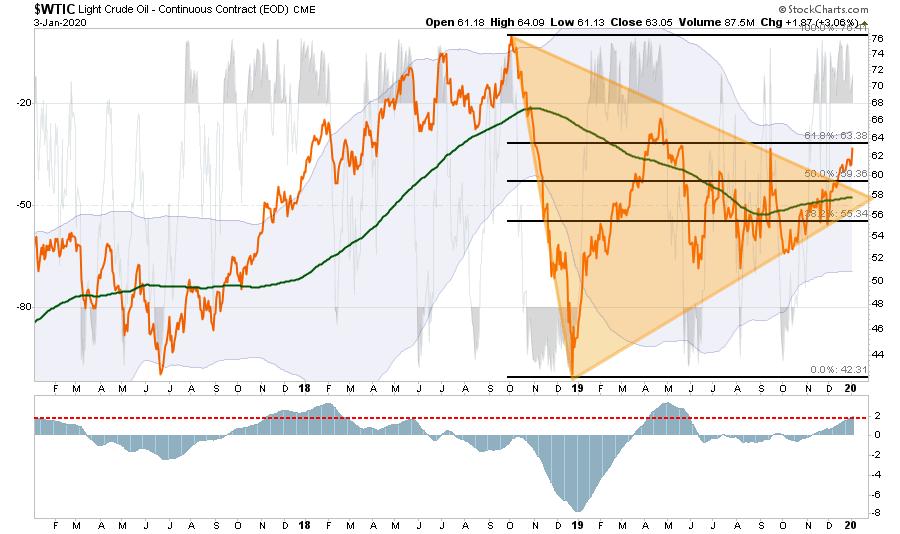
West Texas Intermediate Crude (Oil)
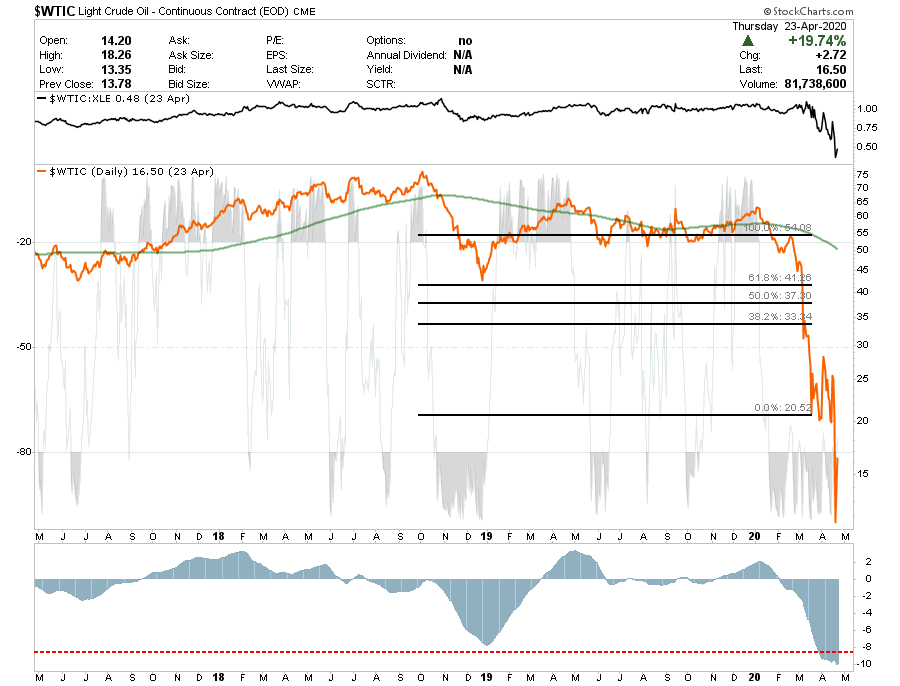
- This past week, saw oil prices collapse and then rally back as futures contracts rolled from May to June. That’s the good news, the bad news is that oil prices are going to go lower again as we head into May and storage remains a problem.
- We continue to suggest using any rally to clear positions in your portfolio for now.
- We have not changed out stance on the sector from a “value” perspective, however, and this past week we nibbled into XOM, CVX, and XLE as oil stocks had exceedingly strong relative performance relative to oil. This suggests most of the risk has been pulled out of the sector. We are still carrying very tight stops though.
- Short-Term Positioning: Bearish
- Last Week: No positions
- This Week: XOM, CVX, and XLE
- Stops Triggered for any direct crude oil positions.
- Long-Term Positioning: Bearish
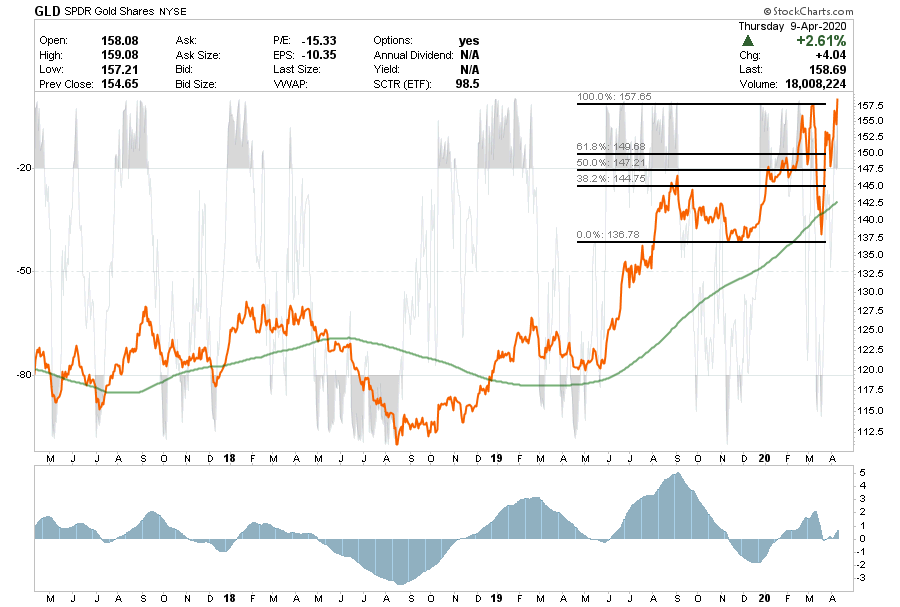
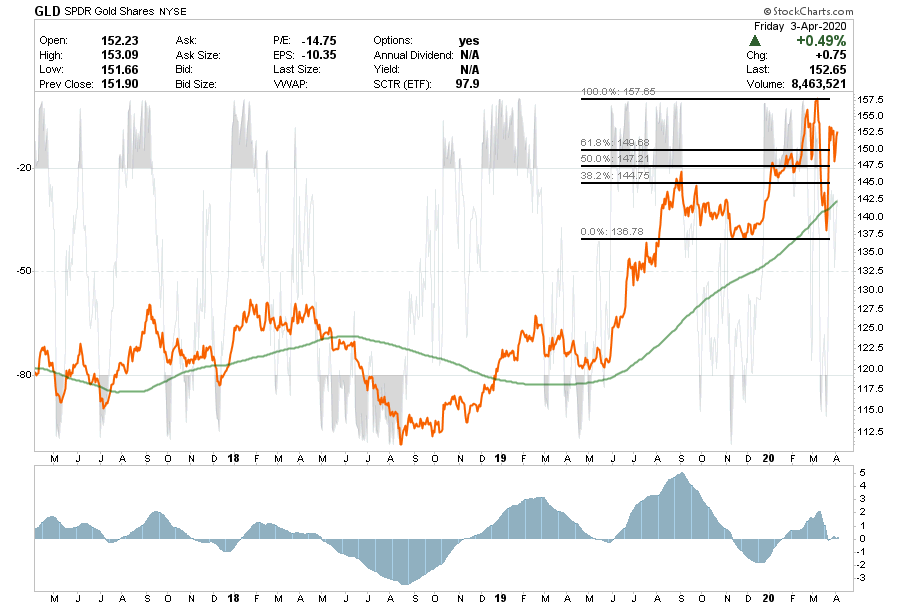
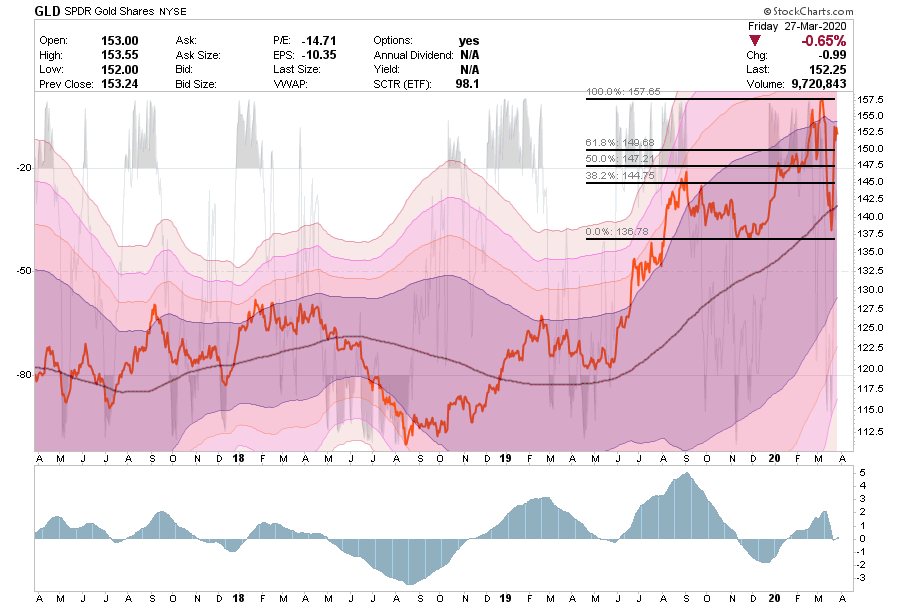
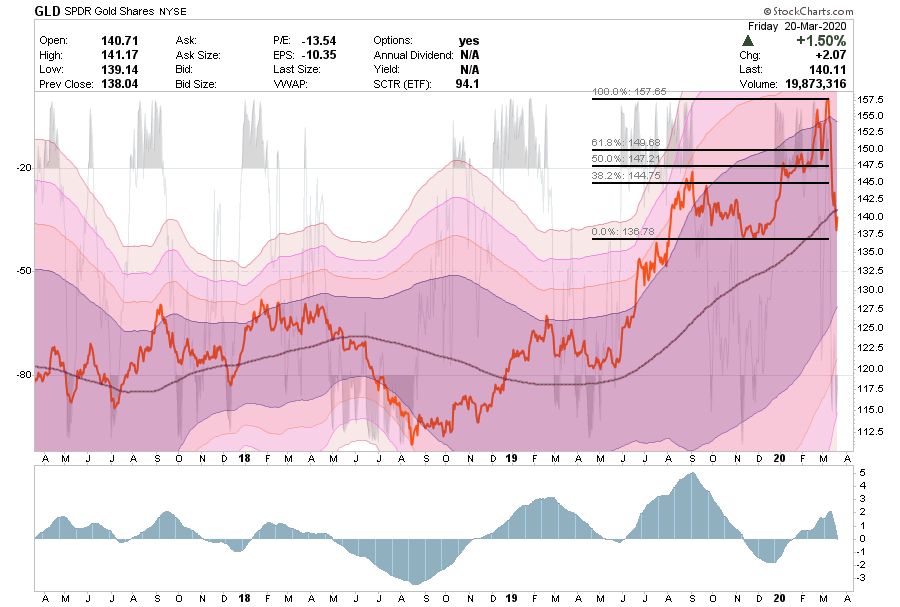
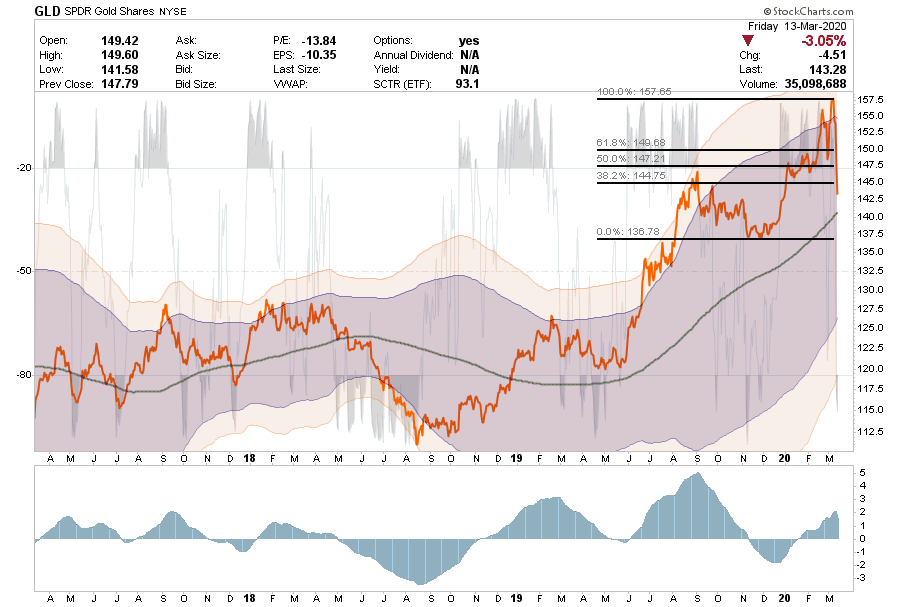
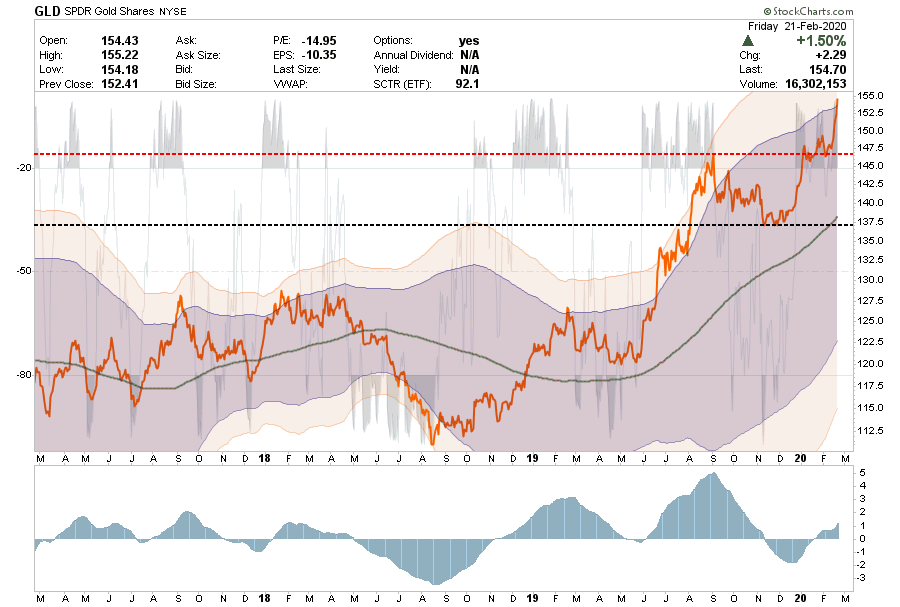
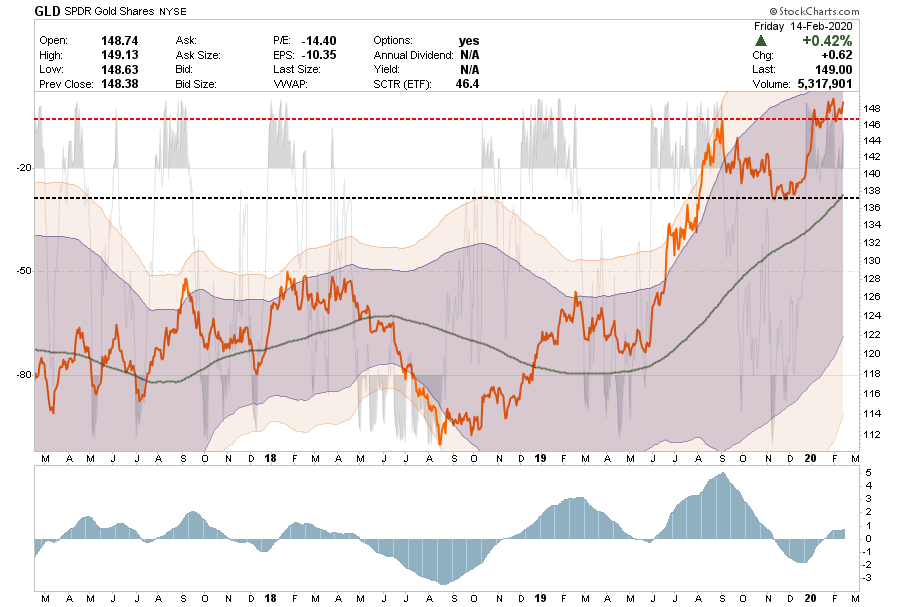
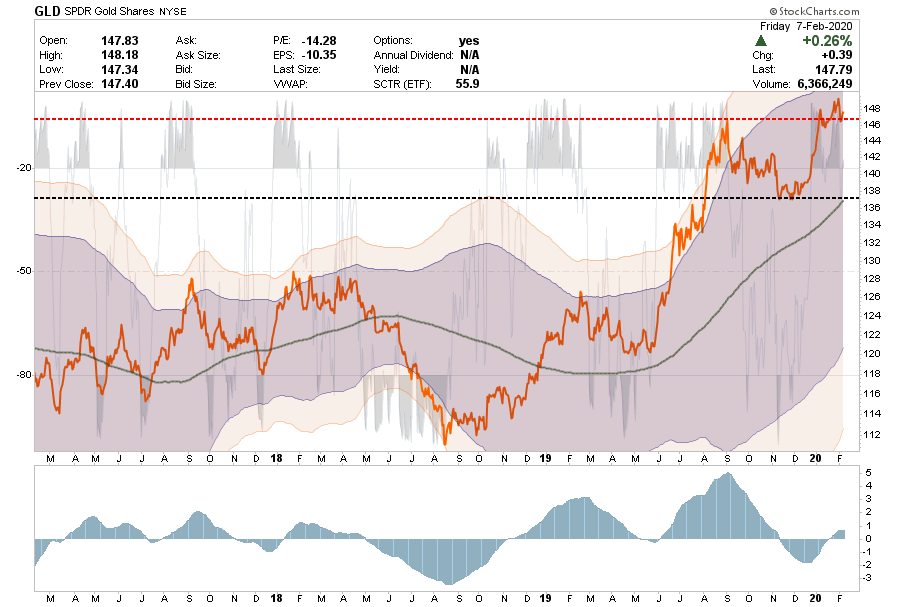
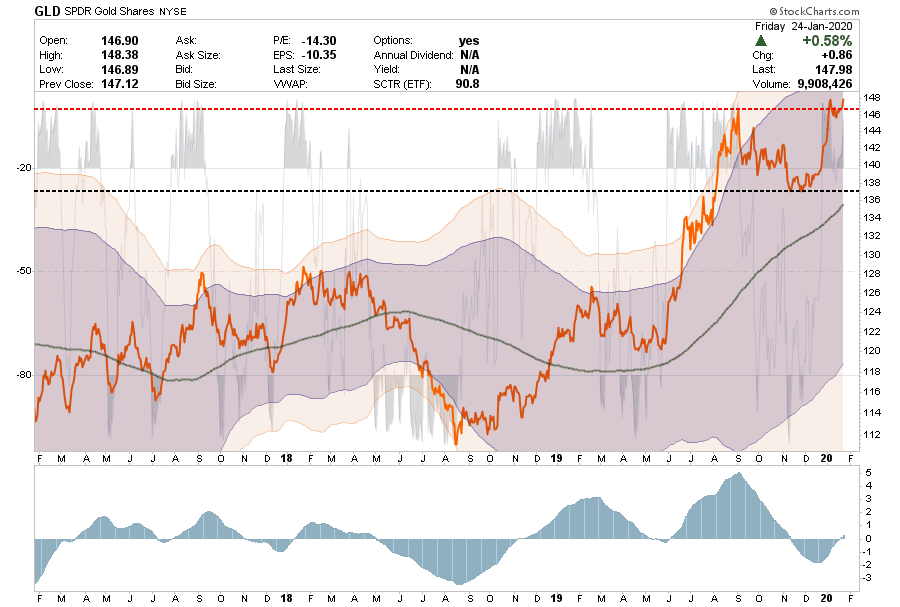
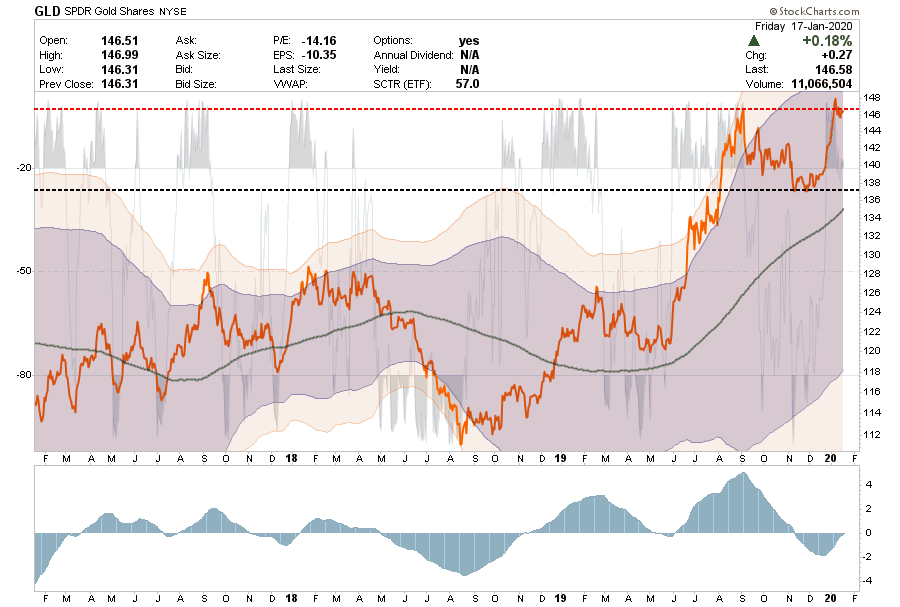
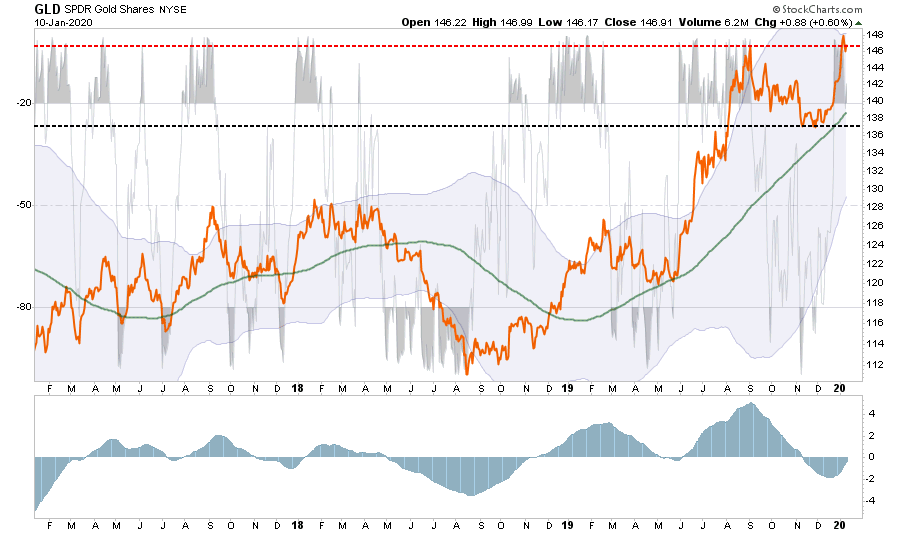
Gold
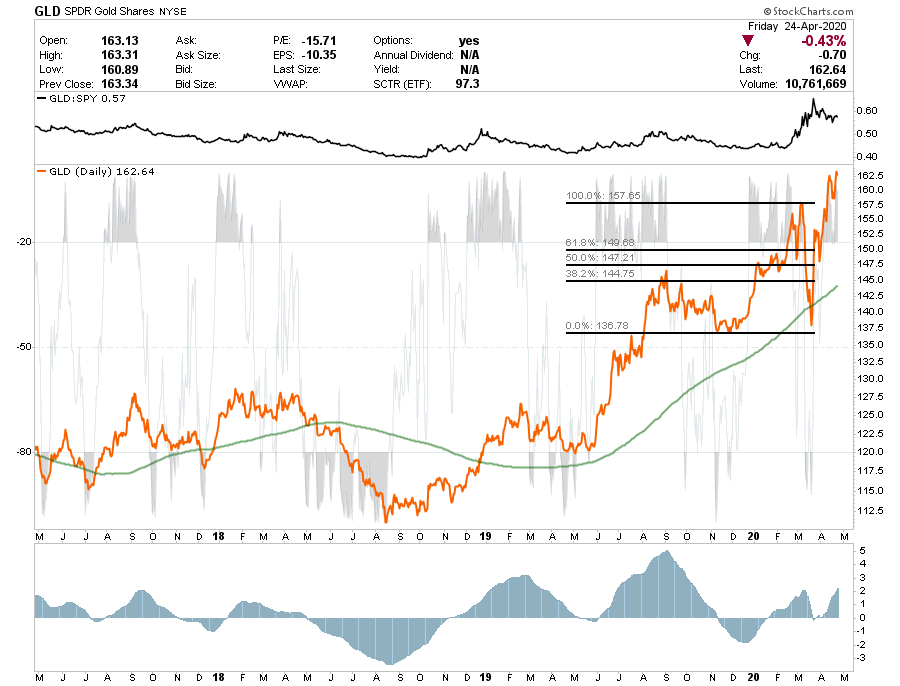
- We previously added to our positions in IAU and GDX.
- This past week Gold broke out to new highs as inflationary concerns continue to persist.
- The sectors are VERY overbought short-term so a pullback is likely that can be used to add to current holdings.
- Short-Term Positioning: Bullish
- Last week: Hold positions.
- This week: Hold positions – Positions can now be added at 157.50
- Stop-loss moved up to $150
- Long-Term Positioning: Bullish
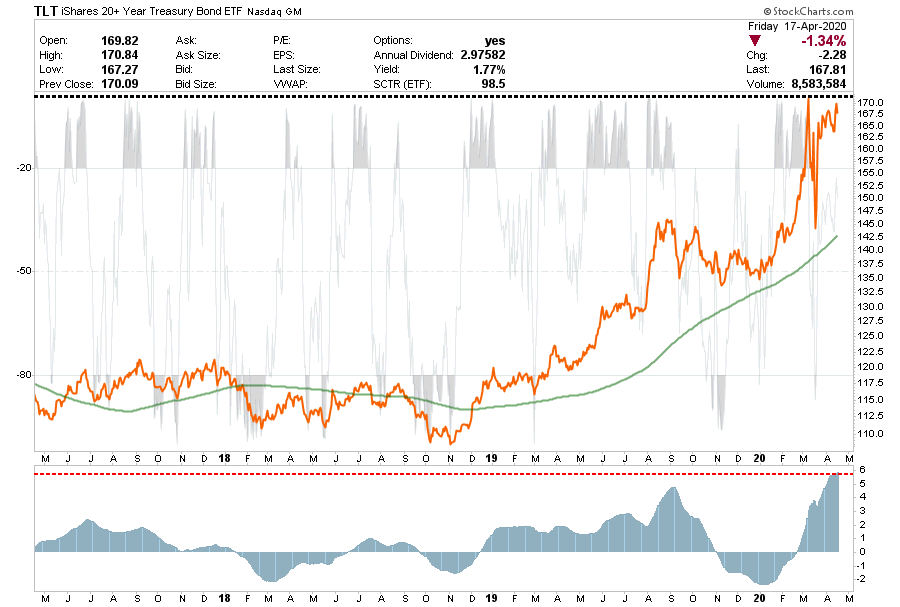
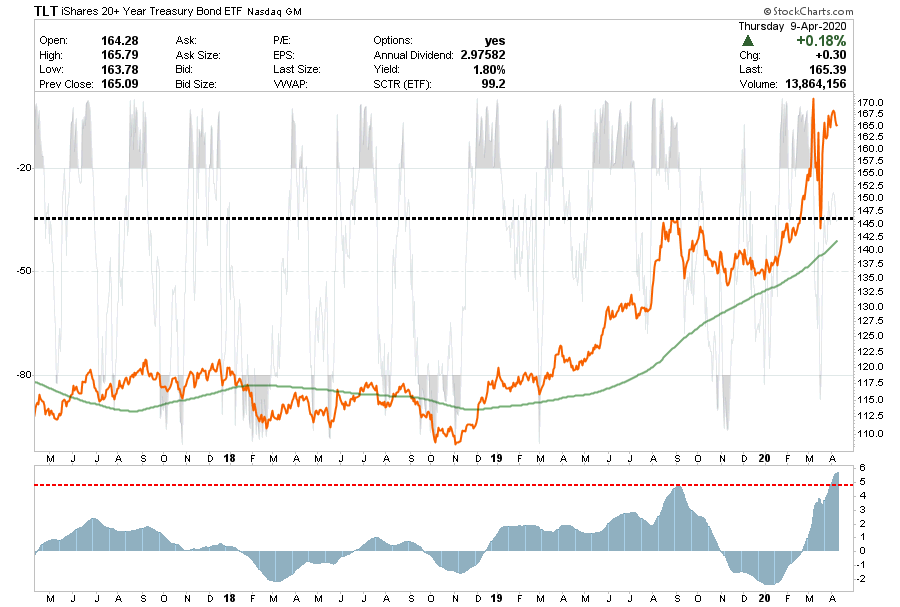
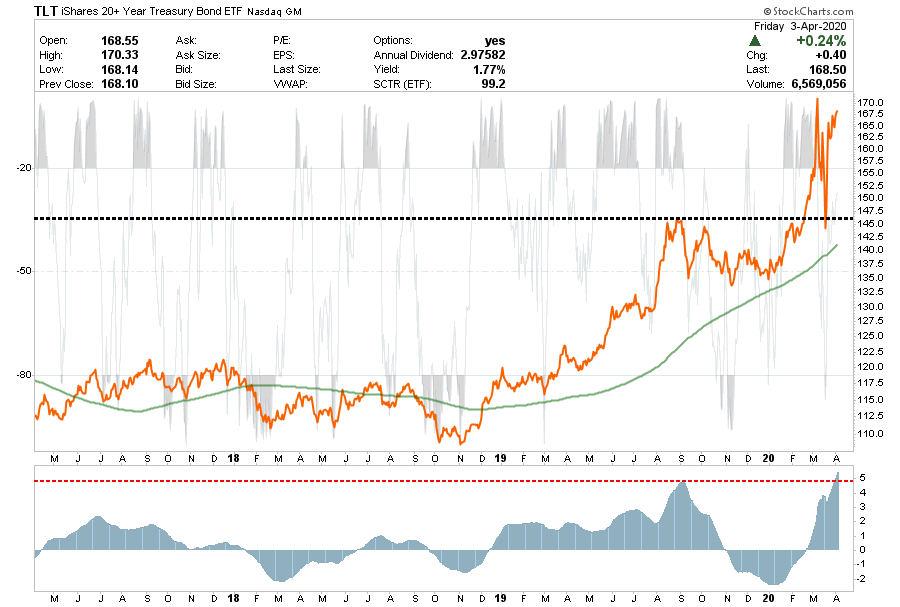
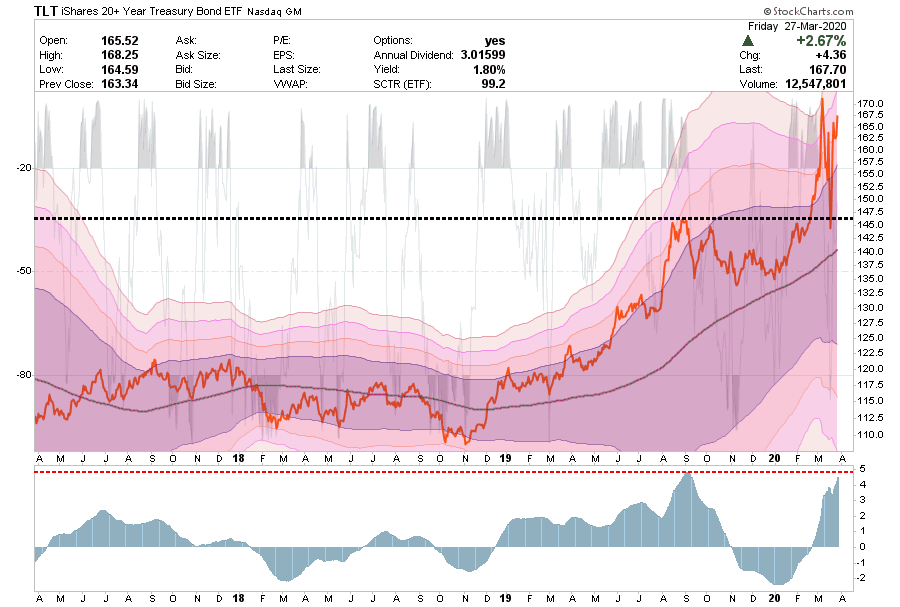
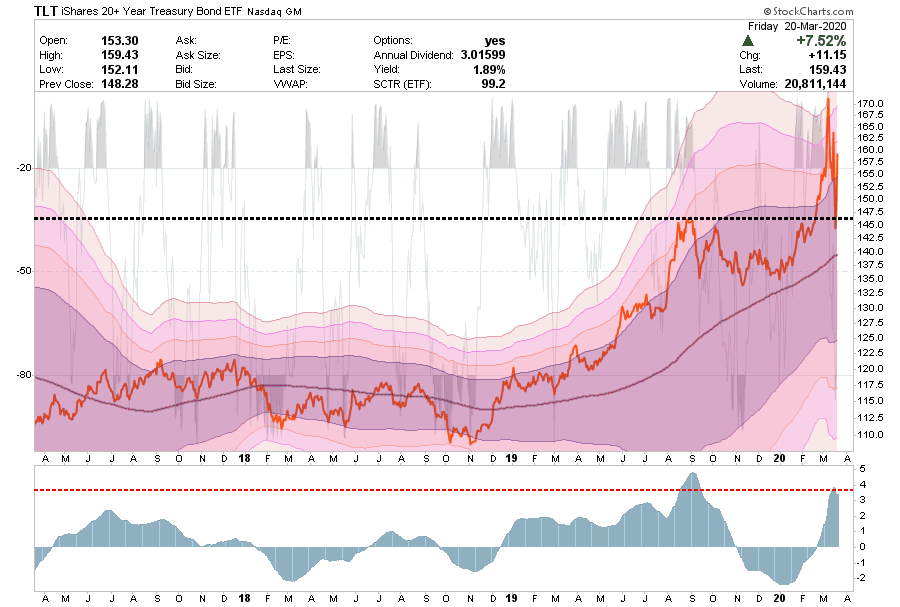
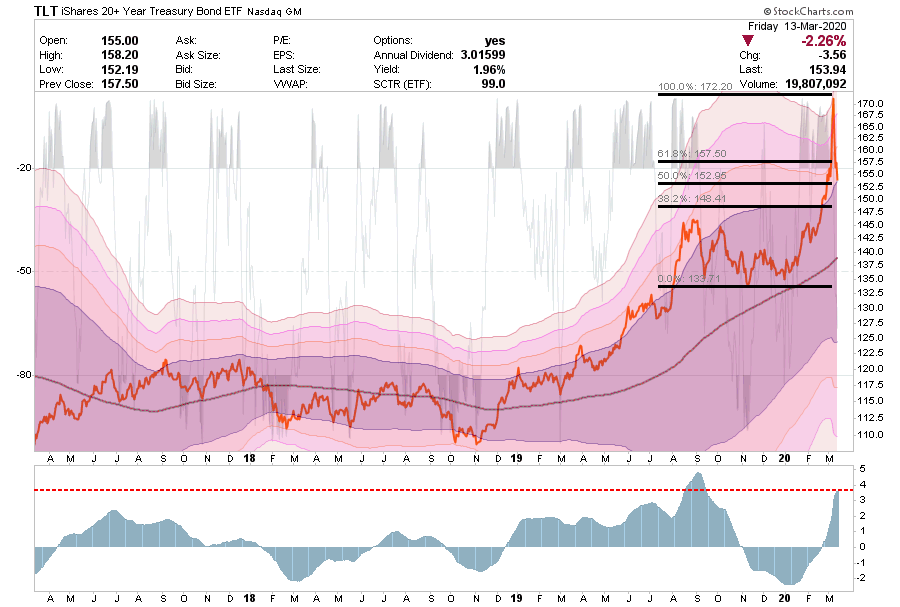
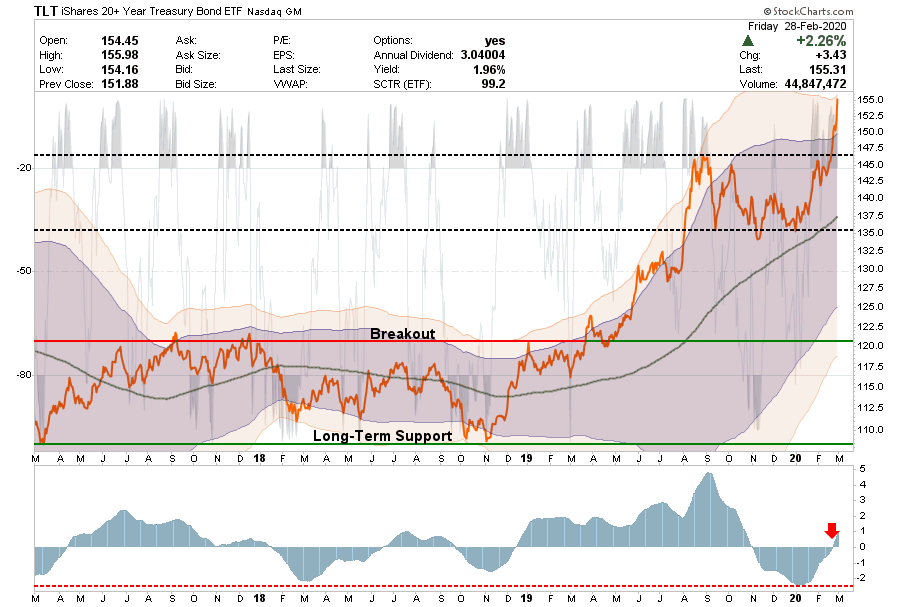
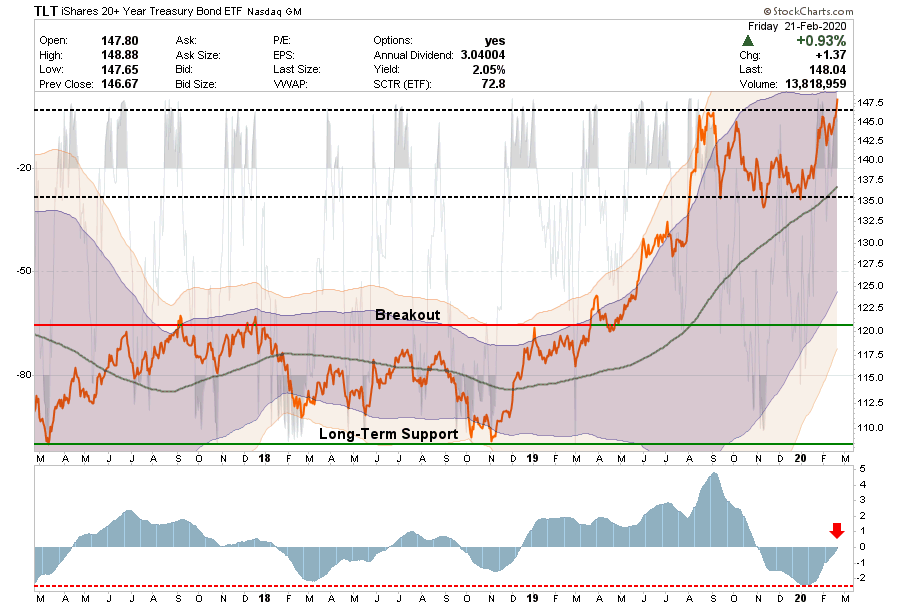
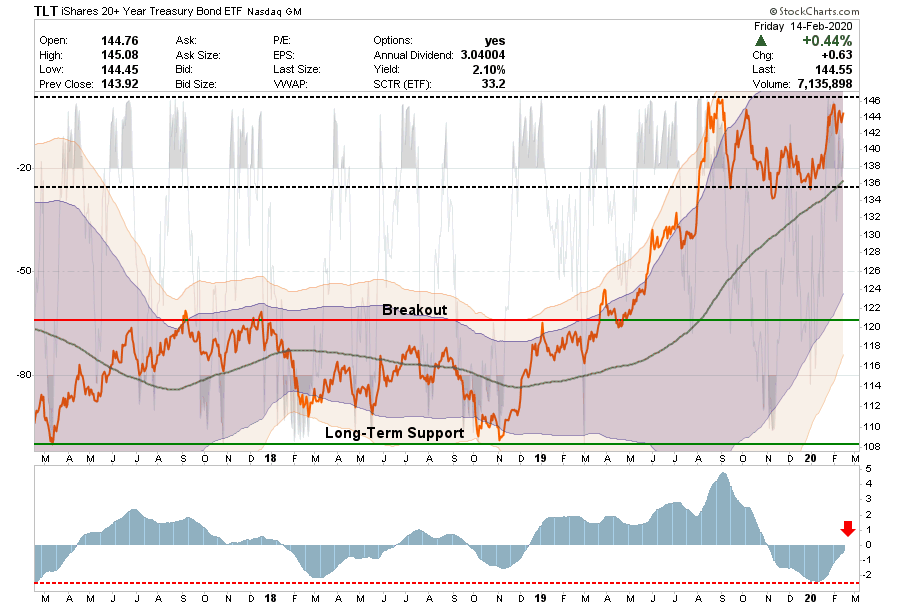
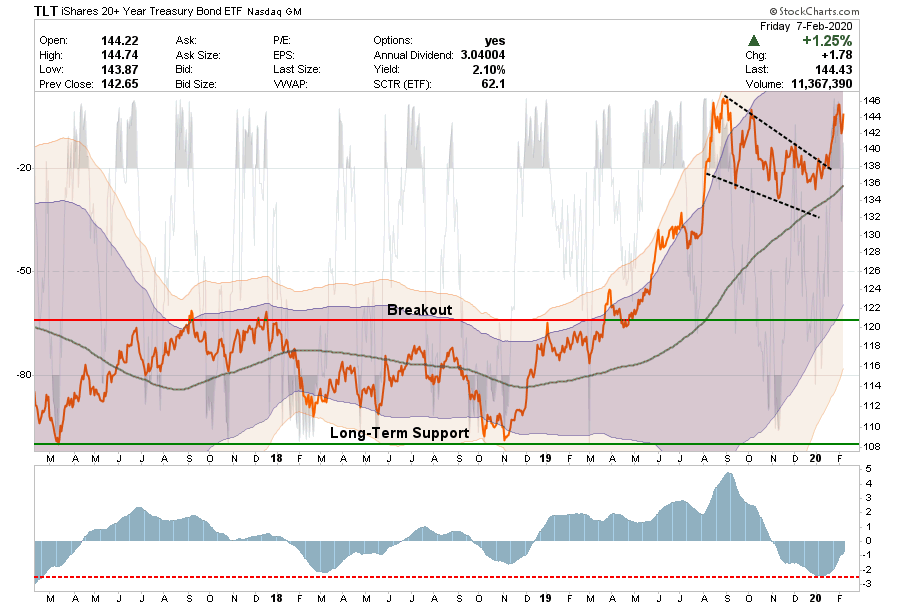
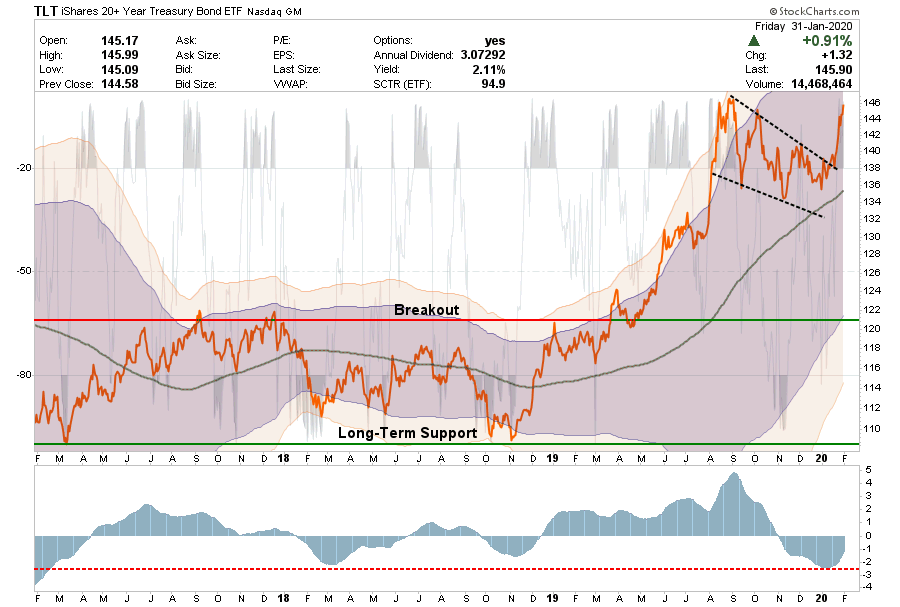
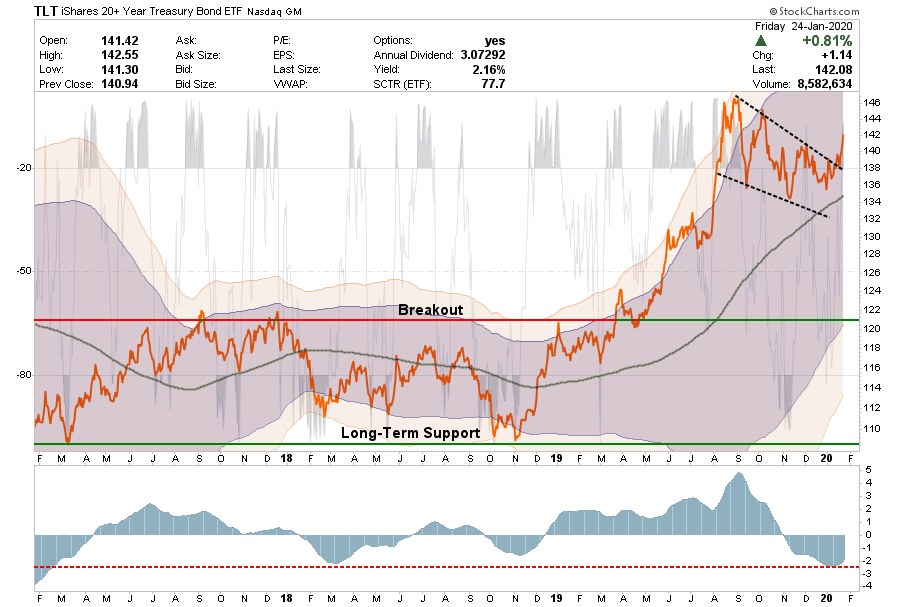
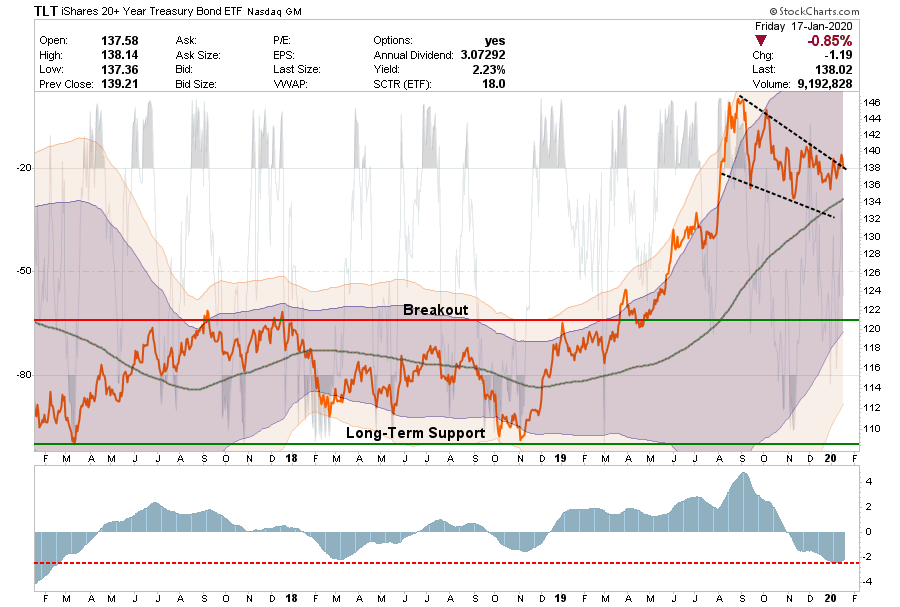
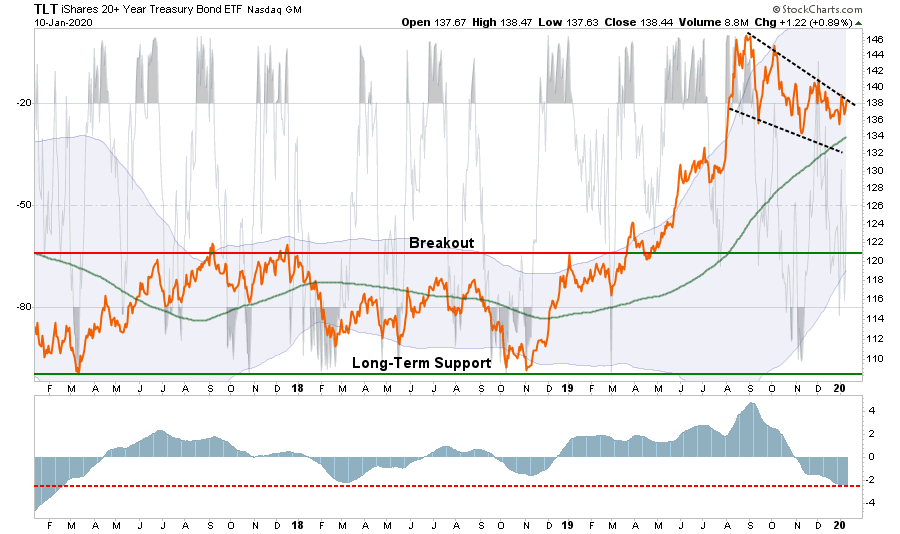
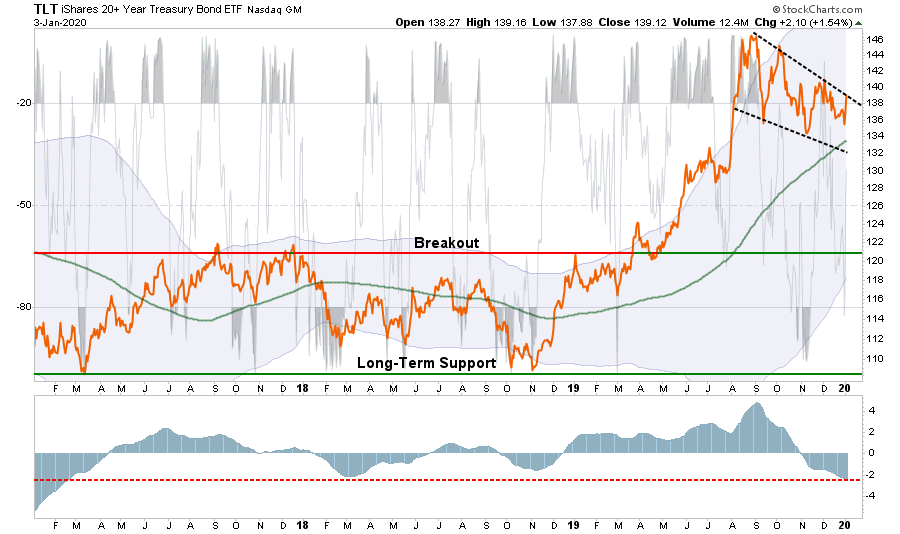
Bonds (Inverse Of Interest Rates)
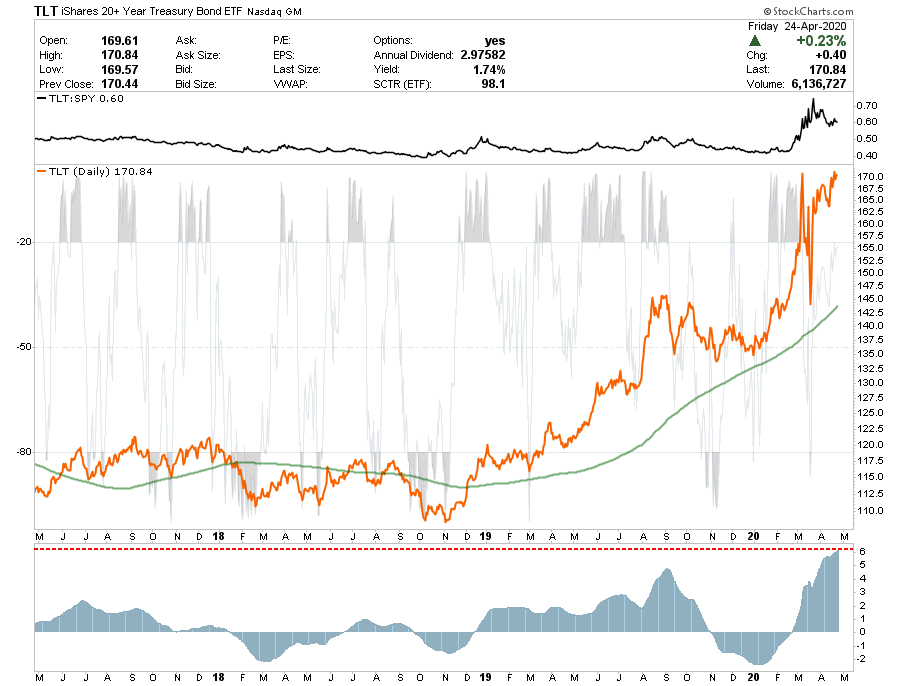
- Bonds are back to “crazy” overbought with the Fed buying everything from the banks who are happy to mark-up prices and sell it to them.
- As we have been adding equity exposure to portfolios, we needed to increase our “hedge” against equity risk accordingly. We added a 5% position of TLT on Friday for just this reason.
- Short-Term Positioning: Neutral
- Last Week: Hold positions
- This Week: Added 5% position of TLT
- Stop-loss is $152.50
- Long-Term Positioning: Bullish
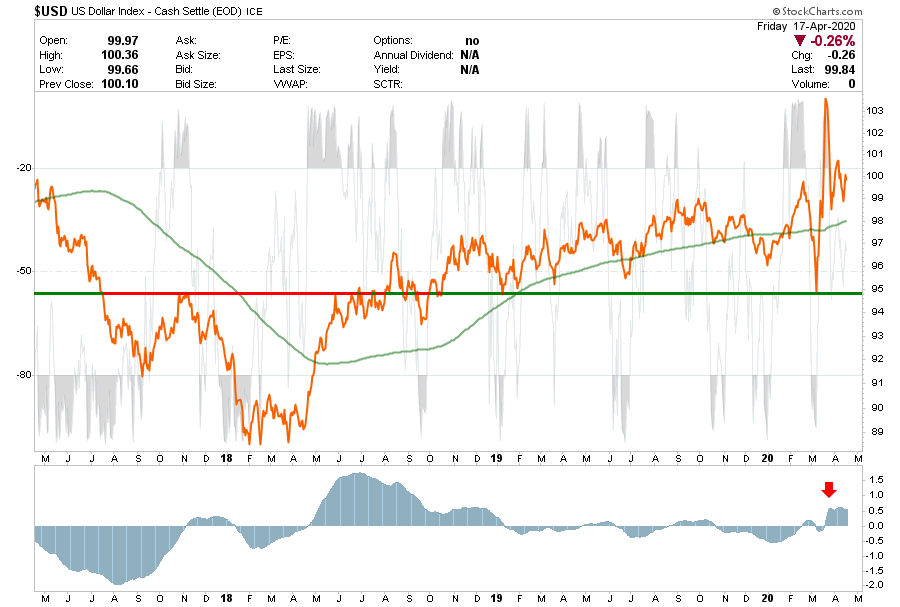
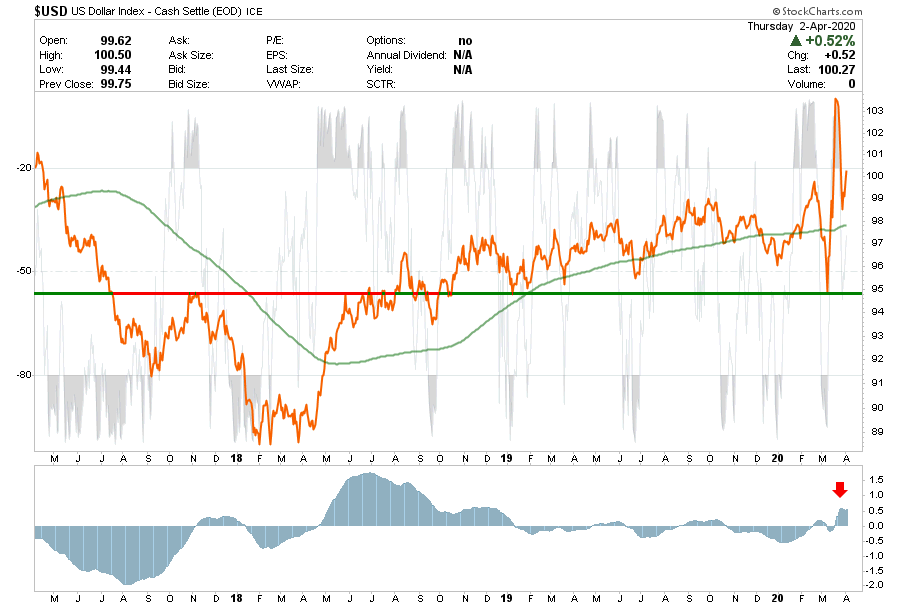
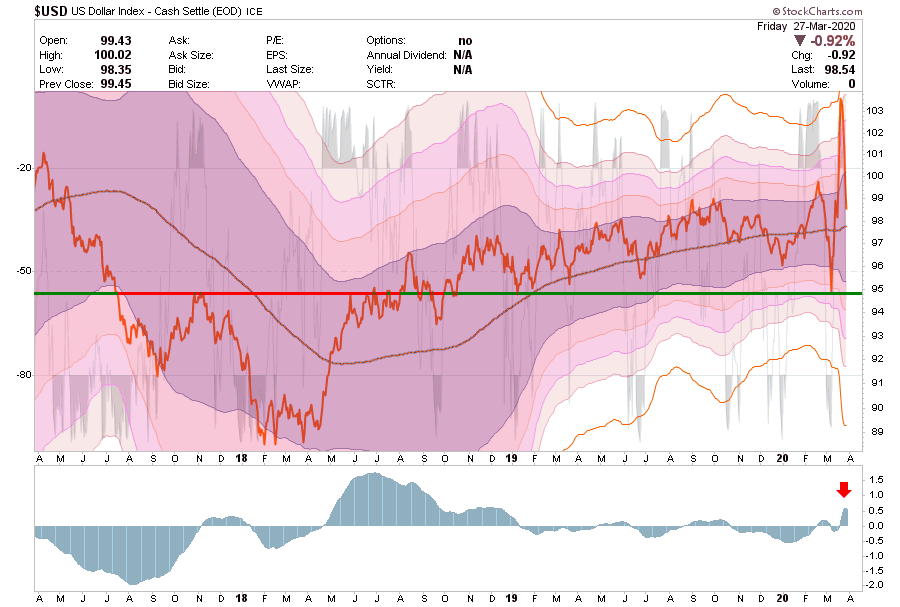
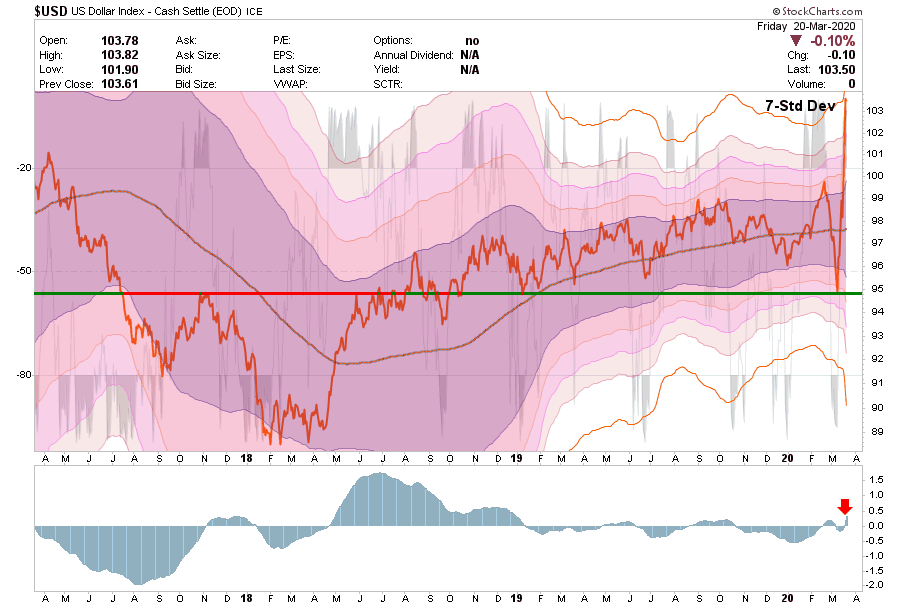
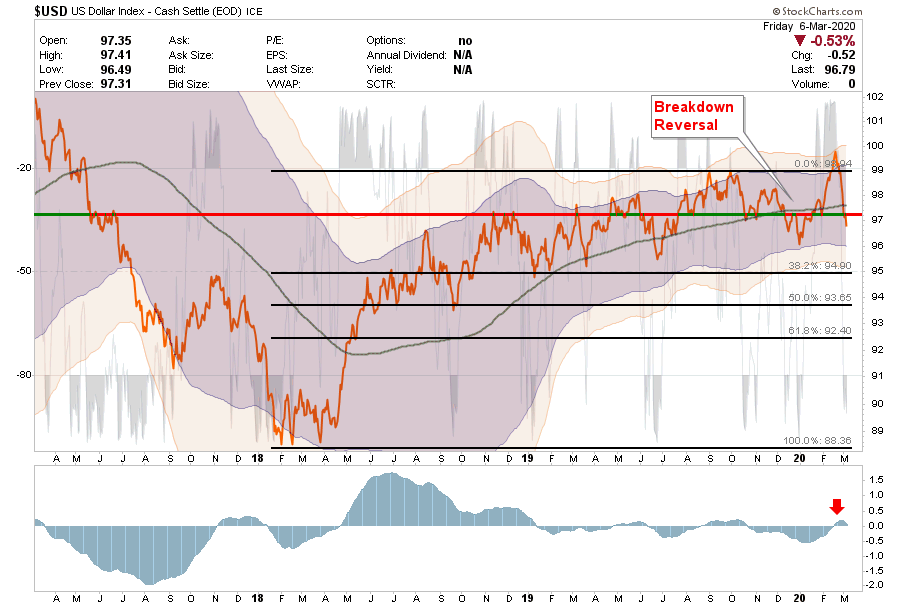
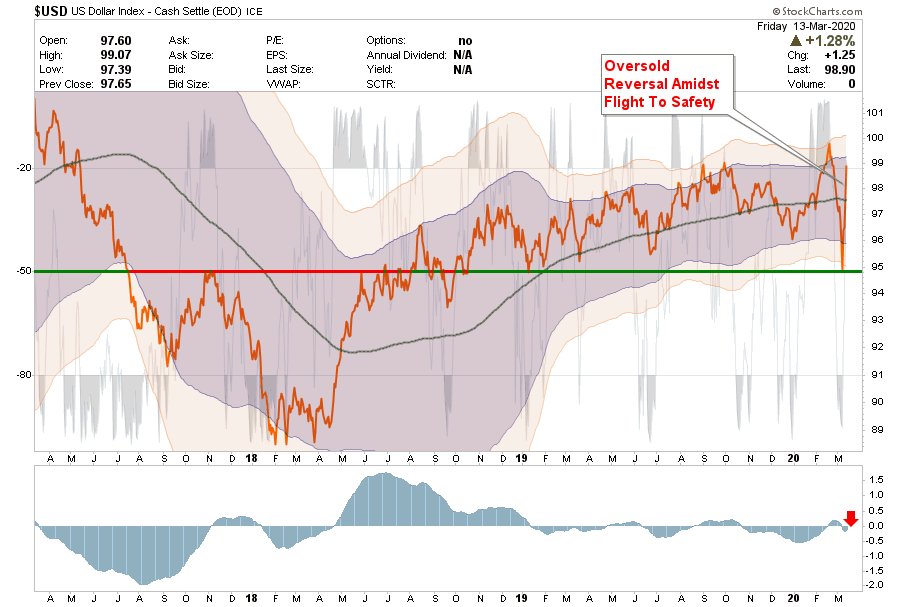
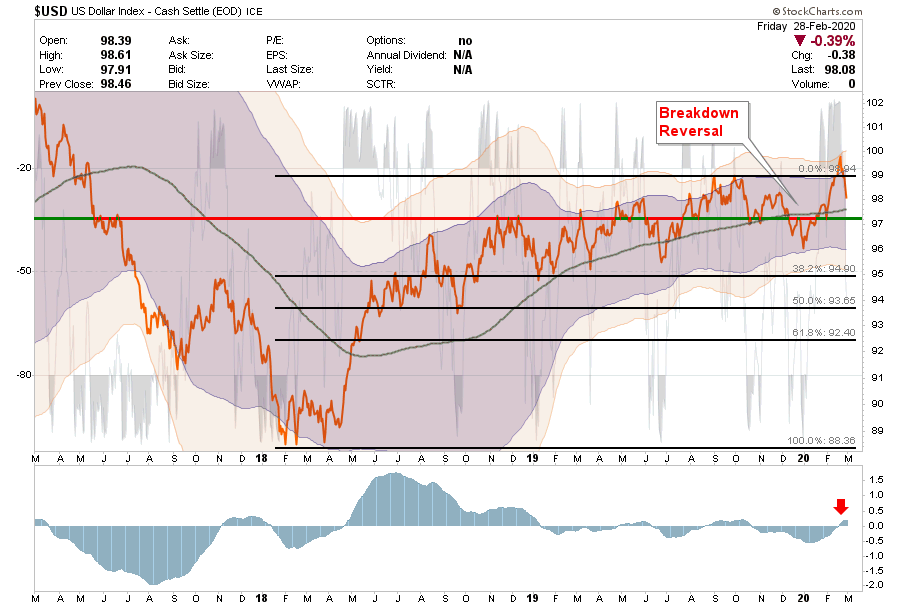
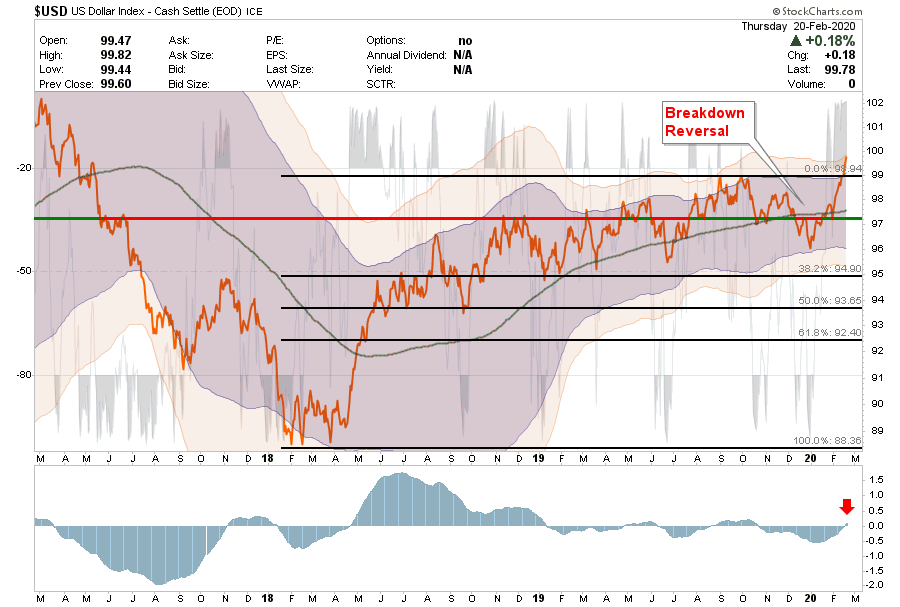
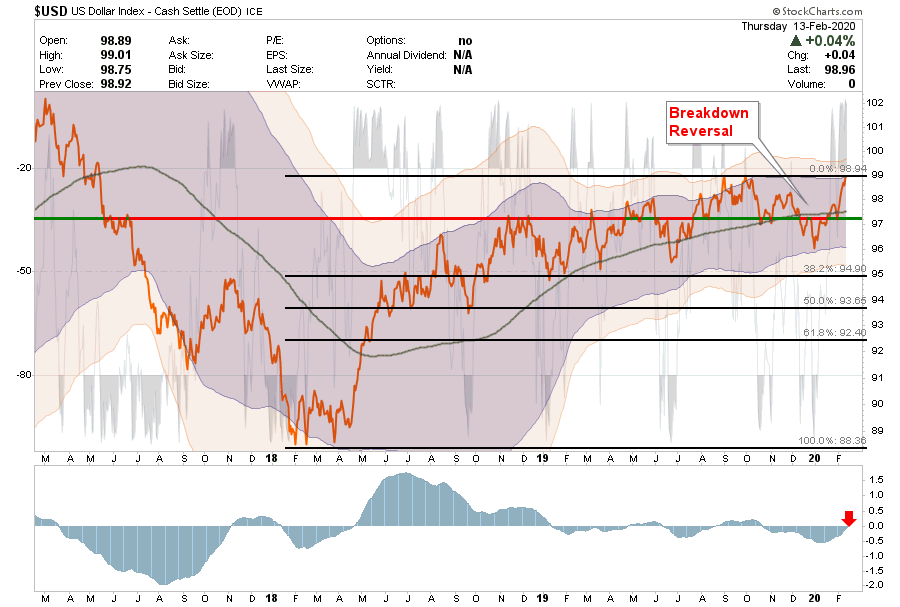
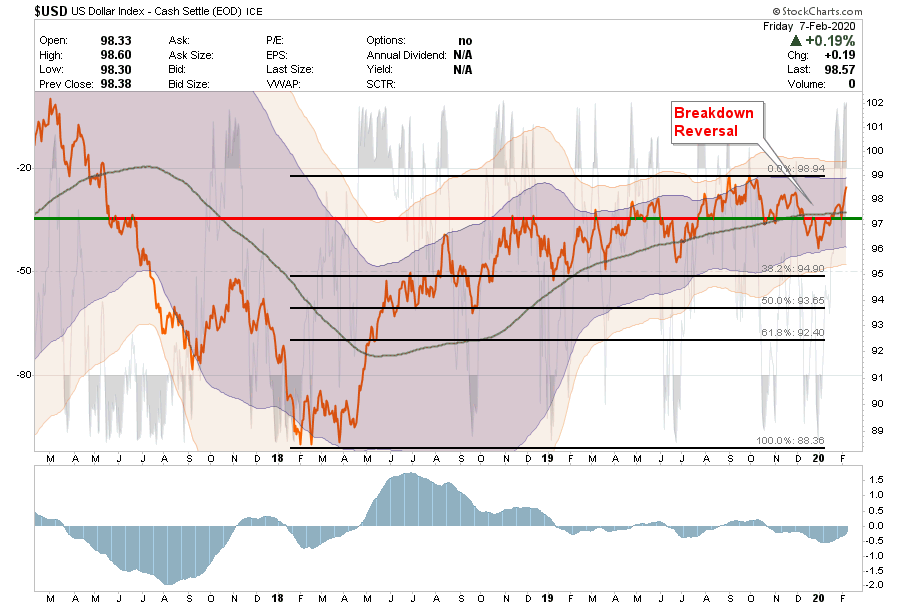
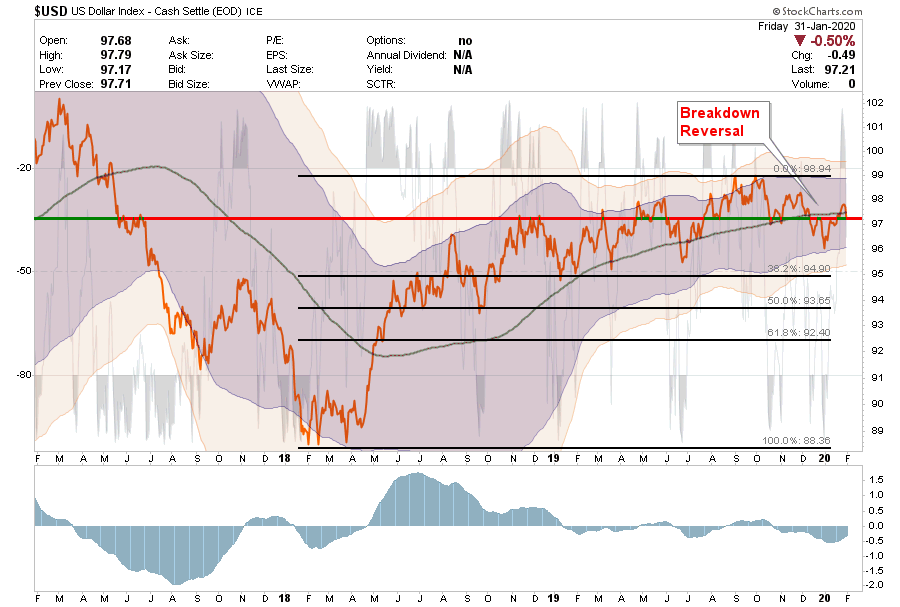
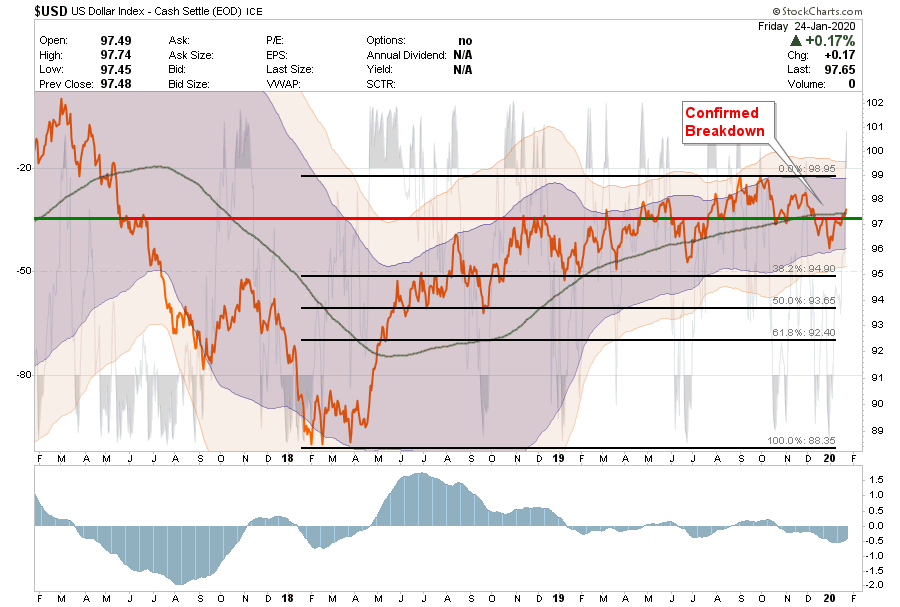
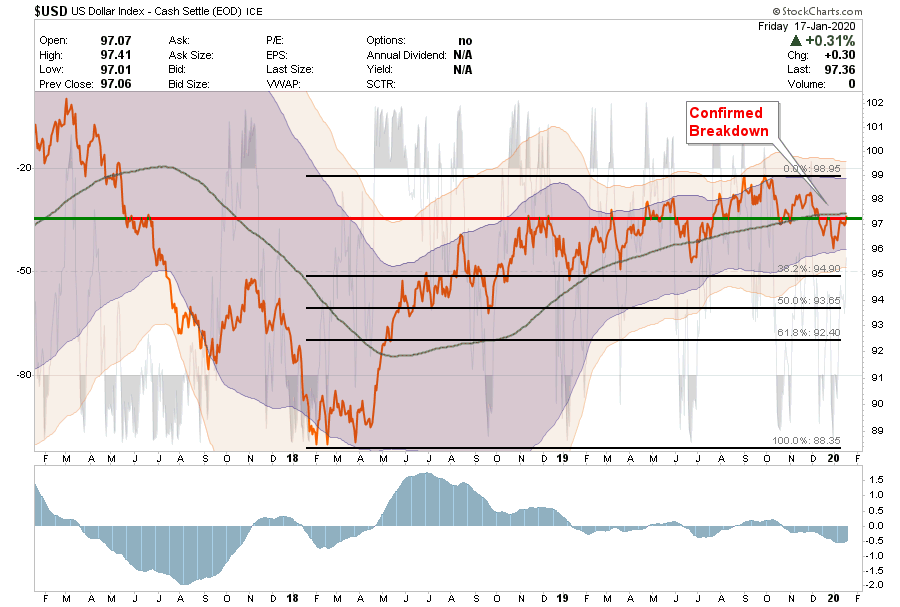
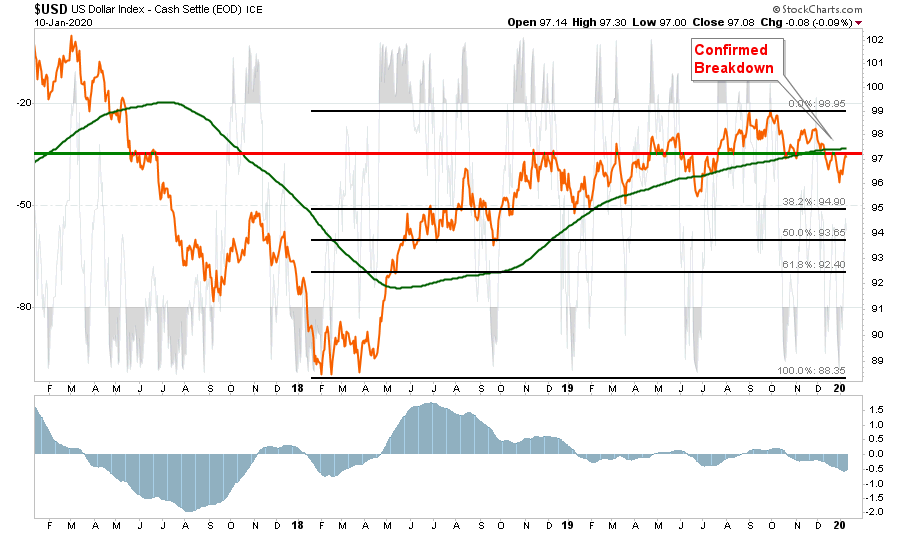
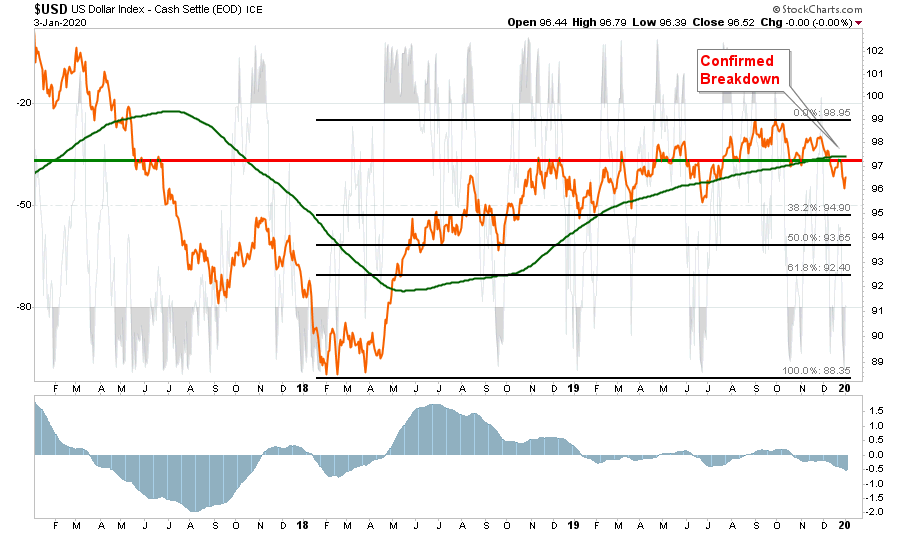
U.S. Dollar
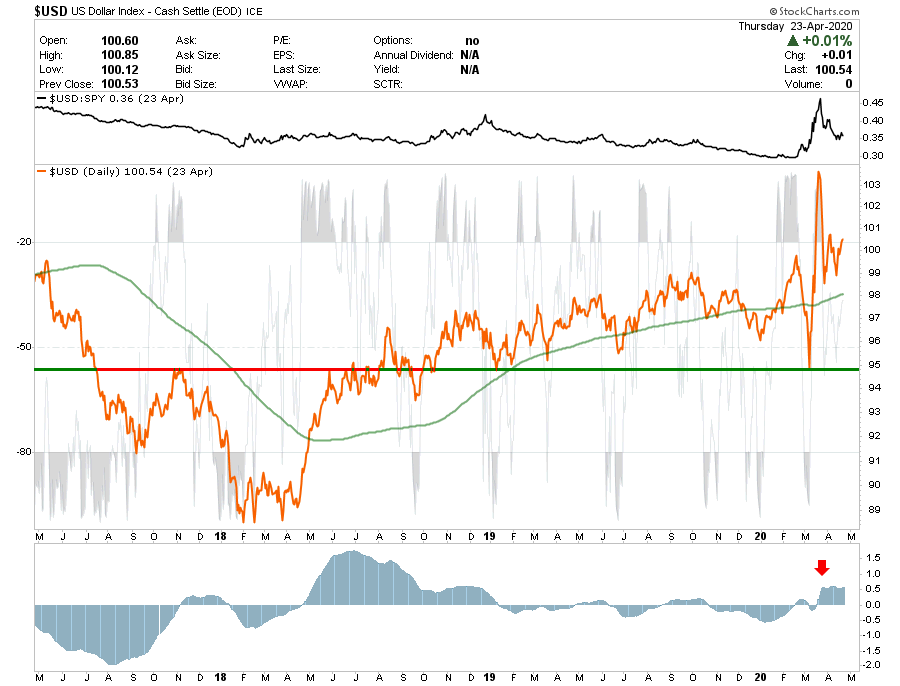
- We added a position last week to the Dollar to hedge against the global dollar shortage issue.
- Our reasoning was explained in detail in “Our 5-Favorite Positions Right Now”
- Stop is set at $98