Our interim global forecast is the second prepared in March and is much more pessimistic than our 17 March regularly scheduled outlook. It is based on major downgrades to forecasts of the US economy and oil prices. The risks remain overwhelmingly on the downside and further downgrades are almost assured.
IHS Markit now believes the COVID-19 recession will be deeper than the one following the global financial crisis in 2008-09. Real world GDP should plunge 2.8% in 2020 compared with a drop of 1.7% in 2009. Many key economies will see double-digit declines (at annualized rates) in the second quarter, with the contraction continuing into the third quarter.
It will likely take two to three years for most economies to return to their pre-pandemic levels of output. More troubling is the likelihood that, because of the negative effects of the uncertainty associated with the virus on capital spending, the path of potential GDP will be lower than before. This happened in the wake of the global financial crisis.
Six Key Points
Based on recent data and developments, IHS Markit has slashed the US 2020 forecast to a contraction of 5.4%.
Because of the deep US recession and collapsing oil prices, IHS Markit expects Canada’s economy to contract 3.3% this year, before seeing a modest recovery in 2021.
Europe, where the number of cases continues to grow rapidly and lockdowns are pervasive, will see some of the worst recessions in the developed world, with 2020 real GDP drops of approximately 4.5% in the eurozone and UK economies. Italy faces a decline of 6% or more. The peak GDP contractions expected in the second quarter of 2020 will far exceed those at the height of the global financial crisis.
Japan was already in recession, before the pandemic. The postponement of the summer Tokyo Olympics will make the downturn even deeper. IHS Markit expects a real GDP contraction of 2.5% this year and a very weak recovery next year.
China’s economic activity is expected to have plummeted at a near-double-digit rate in the first quarter. It will then recover sooner than other countries, where the spread of the virus has occurred later. IHS Markit predicts growth of just 2.0% in 2020, followed by a stronger-than-average rebound in 2021, because of its earlier recovery from the pandemic.
Emerging markets growth will also be hammered. Not only are infection rates rising rapidly in key economies, such as India, but the combination of the deepest global recession since the 1930s, plunging commodity prices, and depreciating currencies (compounding already dangerous debt burdens) will push many of these economies to the breaking point.
No V-Shaped Recovery
With that, Markit came around to my point of view all along. Those expecting a V-shaped recovery are sadly mistaken.
I have been amused by Goldman Sachs and Morgan Stanley predictions of a strong rebound in the third quarter.
It’s a list of projections from an excellent must see video presentation by Jim Bianco. I added my own thoughts on the key points.
The bottom line is don’t expect a v-shaped recovery. We will not return to the old way of doing business.
Globalization is not over, but the rush to globalize everything is. This will impact earnings for years to come.
Finally, stimulus checks are on the way, but there will be no quick return to buying cars, eating out, or traveling as much.
Boomers who felt they finally had enough retirement money just had a quarter of it or more wiped out.
It will take a long time, if ever, for the same sentiment to return. Spending will not recover. Boomers will die first, and they are the ones with the most money.
Shedlock: Fed Trying To Save The Bond Market As Unemployment Explodes
Bond market volatility remains a sight to behold, even at the low end of the curve.
Bond Market Dislocations Remain
The yield on a 3-month T-Bill fell to 1.3 basis points then surged to 16.8 basis points in a matter of hours. The yield then quickly crashed to 3 basis points and now sits at 5.1 basis points.
The Fed is struggling even with the low end of the Treasury curve.
$IRX 3-Month Yield
Stockcharts shows the 3-month yield ($IRX) dipping below zero but Investing.Com does not show the yield went below zero.
In a crisis, it is said, all correlations go to one. Threats get so overwhelming that everything reacts in unison. And the common thread running through all facets of financial markets and the real economy right now is simple: a global cash crunch of epic proportions.
Investors piled $137 billion into cash-like assets in the five days ending March 11, according to a Bank of America report citing EPFR Global data. Its monthly fund manager survey showed the fourth-largest monthly jump in allocations to cash ever, from 4% to 5.1%.
“Cash has become the king as the short-term government funds have had massive deposits, with ~$13 billion inflows last week (a 10-standard deviation move),” adds Maneesh Dehspande, head of equity derivatives strategy at Barclays.
4th Largest Jump in History
It’s quite telling that a jump of a mere 1.1 percentage point to 5.1% cash is the 4th largest cash jump in history.
Margin and Short Covering
“In aggregate, the market saw a large outflow, with $9 billion of long liquidation and $6 billion of short covering,” said Michael Haigh, global head of commodity research at Societe Generale. “This general and non-directional closure of money manager positions could be explained by a need for cash to pay margin calls on other derivatives contracts.”
The comment is somewhat inaccurate. Sideline cash did not change “in aggregate” although cash balances t various fund managers did.
This is what happens when leveraged longs get a trillion dollar derivatives margin call or whatever the heck it was.
Need a Better Hedge
With the S&P 500 down more than 12% in the five sessions ending March 17, the Japanese yen is weaker against the greenback, the 10-year Treasury future is down, and gold is too.
That’s another sign dollars are top of mind, and investors are selling not only what they want to, but also what they have to.
Dash to Cash
It’s one thing to see exchange-traded products stuffed full of relatively illiquid corporate bonds trade below the purported sum of the value of their holdings. It’s quite another to see such a massive discount develop in a more plain-vanilla product like the Vanguard Total Bond Market ETF (BND) as investors ditched the product to raise cash despite not quite getting their money’s worth.
The fund closed Tuesday at a discount of nearly 2% to its net asset value, which blew out to above 6% last week amid accelerating, record outflows. That exceeded its prior record discount from 2008.
It is impossible for everyone to go to cash at the same time.
Someone must hold every stock, every bond and every dollar.
The Fed said the swaps, in which the Fed accepts other currencies in exchange for dollars, will for at least the next six months allow the central banks of Australia, Brazil, South Korea, Mexico, Singapore, Sweden, Denmark, Norway and New Zealand to tap up to a combined total of $450 billion, money to ensure the world’s dollar-dependent financial system continues to function.
The new swap lines “like those already established between the Federal Reserve and other central banks, are designed to help lessen strains in global U.S. dollar funding markets, thereby mitigating the effects of these strains on the supply of credit to households and businesses, both domestically and abroad,” the Fed said in a statement.
The central banks of South Korea, Singapore, Mexico and Sweden all said in separate statements they intended to use them.
Fed Does Another Emergency Repo and Relaunches Commercial Paper Facility
The Fed blew three economic bubbles in succession. A deflationary bust has started. They blew bubbles trying to prevent “deflation” defined as falling consumer prices.
BIS Deflation Study
The BIS did a historical study and found routine price deflation was not any problem at all.
“Deflation may actually boost output. Lower prices increase real incomes and wealth. And they may also make export goods more competitive,” stated the BIS study.
Deflation is not really about prices. It’s about the value of debt on the books of banks that cannot be paid back by zombie corporations and individuals.
Blowing bubbles in absurd attempts to arrest “price deflation” is crazy. The bigger the bubbles the bigger the resultant “asset bubble deflation”. Falling consumer prices do not have severe negative repercussions. Asset bubble deflations are another matter.
Assessing the Blame
Central banks are not responsible for the coronavirus. But they are responsible for blowing economic bubbles prone to crash.
The equities bubbles before the coronavirus hit were the largest on record.
Dollar Irony
The irony in this madness is the US will be printing the most currency and have the biggest budget deficits as a result. Yet central banks can’t seem to get enough dollars. In that aspect, the dollar ought to be sinking.
But given the US 10-year Treasury yield at 1.126% is among the highest in the world, why not exchange everything one can for dollars earning positive yield.
This is all such circular madness, it’s hard to say when or how it ends.
Unemployment Set To Explode
A SurveyUSA poll reveals 9% of the US is out of a job due to the coronavirus.
9% of Working Americans (14 Million) So Far Have Been Laid Off As Result of Coronavirus; 1 in 4 Workers Have Had Their Hours Reduced;
2% Have Been Fired; 20% Have Postponed a Business Trip; Shock Waves Just Now Beginning to Ripple Through Once-Roaring US Economy:
Early markers on the road from recession to depression as the Coronavirus threatens to stop the world from spinning on its axis show that 1 in 4 working Americans have had their hours reduced as a result of COVID-19, according to SurveyUSA’s latest time-series tracking poll conducted 03/18/20 and 03/19/20.
Approximately 160 million Americans were employed in the robust Trump economy 2 months ago. If 26% have had their hours reduced, that translates to 41 million Americans who this week will take home less money than last, twice as many as SurveyUSA found in an identical poll 1 week ago. Time-series tracking graphs available here.
9% of working Americans, or 14 million of your friends and neighbors, will take home no paycheck this week, because they were laid off, up from 1% in an identical SurveyUSA poll 1 week ago. Time-series tracking graphs available here.
Unlike those laid-off workers who have some hope of being recalled once the worst of the virus has past, 2% of Americans say they have lost their jobs altogether as a result of the virus, up from 1% last week.
Of working Americans, 26% are working from home either some days or every day, up from 17% last week. A majority, 56%, no longer go to their place of employment, which means they are not spending money on gasoline or transit tokens.
About: SurveyUSA interviewed 1,000 USA adults nationwide 03/18/20 through 03/19/20. Of the adults, approximately 60% were, before the virus, employed full-time or part-time outside of the home and were asked the layoff and reduced-hours questions. Approximately half of the interviews for this survey were completed before the Big 3 Detroit automakers announced they were shutting down their Michigan assembly lines. For most Americans, events continue to unfold faster than a human mind is able to process the consequences.
If we assume the SurveyUSA numbers are accurate and will not get worse, we can arrive at some U3 and U6 unemployment estimates.
Baseline Unemployment Estimate (U3)
Unemployed: 5.787 million + 14 million = 19.787 million unemployed
Civilian Labor Force: 164.546 million (unchanged)
Unemployment Rate: 19.787 / 164.546 = 12.0%
That puts my off the top of the head 15.0% estimate a few days in the ballpark.
Underemployment Estimate (U6)
Employed: 158.759 million.
26% have hours reduced = 41.277 million
Part Time for Economic Reasons: 4.318 million + 41.277 million = 45.595 million underemployed
45.595 million underemployed + 19.787 million unemployed = 65.382 million
Civilian Labor Force: 164.546 million (unchanged)
U6 Unemployment Rate: 65.382 / 164.546 = 39.7%
Whoa Nellie
Wow, that’s not a recession. A depression is the only word.
Note that economists coined a new word “recession” after the 1929 crash and stopped using the word depression assuming it would never happen again.
Prior to 1929 every economic slowdown was called a depression. So if you give credit to the Fed for halting depressions, they haven’t. Ity’s just a matter of semantics.
Depression is a very fitting word if those numbers are even close to what’s going to happen.
The Fed blew three economic bubbles in succession. A deflationary bust has started. They blew bubbles trying to prevent “deflation” defined as falling consumer prices.
BIS Deflation Study
The BIS did a historical study and found routine price deflation was not any problem at all.
“Deflation may actually boost output. Lower prices increase real incomes and wealth. And they may also make export goods more competitive,” stated the BIS study.
Deflation is not really about prices. It’s about the value of debt on the books of banks that cannot be paid back by zombie corporations and individuals.
Blowing bubbles in absurd attempts to arrest “price deflation” is crazy. The bigger the bubbles the bigger the resultant “asset bubble deflation”. Falling consumer prices do not have severe negative repercussions. Asset bubble deflations are another matter.
Assessing the Blame
Central banks are not responsible for the coronavirus. But they are responsible for blowing economic bubbles prone to crash.
The equities bubbles before the coronavirus hit were the largest on record.
Dollar Irony
The irony in this madness is the US will be printing the most currency and have the biggest budget deficits as a result. Yet central banks can’t seem to get enough dollars. In that aspect, the dollar ought to be sinking.
But given the US 10-year Treasury yield at 1.126% is among the highest in the world, why not exchange everything one can for dollars earning positive yield.
This is all such circular madness, it’s hard to say when or how it ends.
Margin Call: You Were Warned Of The Risk
I have been slammed with emails over the last couple of days asking the following questions:
“What just happened to my bonds?”
“What happened to my gold position, shouldn’t it be going up?”
“Why are all my stocks being flushed at the same time?”
“Stocks down, Bonds down, credit down, gold down, oil down, copper down, crypto down, global systemically important banks down, and liquidity down…
Today was the worst day for a combined equity/bond portfolio… ever…”
This Is What A “Margin Call,” Looks Like.
In December 2018,we warned of the risk. At that time, the market was dropping sharply, and Mark Hulbert wrote an article dismissing the risk of margin debt. To wit:
“Plunging margin debt may not doom the bull market after all, reports to the contrary notwithstanding.
According to research conducted in the 1970s by Norman Fosback, then the president of the Institute for Econometric Research, there is an 85% probability that a bull market is in progress when margin debt is above its 12-month moving average, in contrast to just a 41% probability when it’s below.
Why, then, do I suggest not becoming overly pessimistic? For several reasons:
1) The margin debt indicator issues many false signals
2) There is insufficient data
3) Margin debt is a strong coincident indicator.”
I disagreed with Mark on several points at the time. But fortunately the Federal Reserve’s reversal on monetary policy kept the stock market from sinking to levels that would trigger “margin calls.”
As I noted then, margin debt is not a technical indicator that can be used to trade markets. Margin debt is the “gasoline,” which drives markets higher as the leverage provides for the additional purchasing power of assets. However, that “leverage” also works in reverse as it provides the accelerant for larger declines as lenders “force” the sale of assets to cover credit lines without regard to the borrower’s position.
That last sentence is the most important and is what is currently happening in the market.
The issue with margin debt, in terms of the biggest risk, is the unwinding of leverage is NOT at the investor’s discretion.
It is at the discretion of the broker-dealers that extended that leverage in the first place. (In other words, if you don’t sell to cover, the broker-dealer will do it for you.)
When lenders fear they may not be able to recoup their credit-lines, they force the borrower to either put in more cash or sell assets to cover the debt. The problem is that “margin calls” generally happen all at once as falling asset prices impact all lenders simultaneously.
Margin debt is NOT an issue – until it is.
When an “event” occurs that causes lenders to “panic” and call in margin loans, things progress very quickly as the “math” becomes a problem. Here is a simple example.
“If you buy $100,000 of stock on margin, you only need to pay $50,000. Seems like a great deal, especially if the stock price goes up. But what if your stock drops to $60,000? Suddenly, you’ve lost $40,000, leaving you with only $10,000 in your margin account. The rules state that you need to have at least 25 percent of the $60,000 stock value in your account, which is $15,000. So not only do you lose $40,000, but you have to deposit an additional $5,000 in your margin account to stay in business.“
However, when margin calls occur, and equity is sold to meet the call, the equity in the portfolio is reduced further. Any subsequent price decline requires additional coverage leading to a “death spiral” until the margin line is covered.
Example:
$100,000 portfolio declines to $60,000. Requiring a margin call of $5000.
You have to deposit $5000, or sell to cover.
However, if you don’t have the cash, then a problem arises. The sell of equity reduces the collateral requirement requiring a larger transaction: $5000/.25% requirement = $20,000
With the margin requirement met, a balance of $40,000 remains in the account with a $10,000 margin requirement.
The next morning, the market declines again, triggering another margin call.
Wash, rinse, repeat until broke.
This is why you should NEVER invest on margin unless you always have the cash to cover.
Just 20%
As I discussed previously, the level we suspected would trigger a margin event was roughly a 20% decline from the peak.
“If such a decline triggers a 20% fall from the peak, which is around 2340 currently, broker-dealers are likely going to start tightening up margin requirements and requiring coverage of outstanding margin lines.
This is just a guess…it could be at any point at which “credit-risk” becomes a concern. The important point is that ‘when’ it occurs, it will start a ‘liquidation cycle’ as ‘margin calls’ trigger more selling which leads to more margin calls. This cycle will continue until the liquidation process is complete.
The Dow Jones provided the clearest picture of the acceleration in selling as “margin calls” kicked in.
The last time we saw such an event was in 2008.
How Much More Is There To Go?
Unfortunately, FINRA only updates margin debt with about a 2-month lag.
Mark’s second point was a lack of data. This isn’t actually the case as margin debt has been tracked back to 1959. However, for clarity, let’s just start with data back to 1980. The chart below tracks two things:
The actual level of margin debt, and;
The level of “free cash” balances which is the difference between cash and borrowed funds (net cash).
As I stated above, since the data has not been updated since January, the current level of margin, and negative cash balances, has obviously been reduced, and likely sharply so.
However, previous “market bottoms,” have occurred when those negative cash balances are reverted. Given the extreme magnitude of the leverage that was outstanding, I highly suspect the “reversion” is yet complete.
The relationship between cash balances and the market is better illustrated in the next chart. I have inverted free cash balances, to show the relationship between reversals in margin debt and the market. Given the market has only declined by roughly 30% to date, there is likely more to go. This doesn’t mean a fairly sharp reflexive bounce can’t occur before a further liquidation ensues.
If we invert margin debt to the S&P 500, you can see the magnitude of both previous market declines and margin liquidation cycles. As stated, this data is as of January, and margin balances will be substantially lower following the recent rout. I am just not sure we have “squeezed” the last bit of blood out of investors just yet.
You Were Warned
I warned previously, the idea that margin debt levels are simply a function of market activity, and have no bearing on the outcome of the market, was heavily flawed.
“By itself, margin debt is inert.
Investors can leverage their existing portfolios and increase buying power to participate in rising markets. While ‘this time could certainly be different,’ the reality is that leverage of this magnitude is ‘gasoline waiting on a match.’
When an event eventually occurs, it creates a rush to liquidate holdings.The subsequent decline in prices eventually reaches a point that triggers an initial round of margin calls. Since margin debt is a function of the value of the underlying ‘collateral,’ the forced sale of assets will reduce the value of the collateral, triggering further margin calls. Those margin calls will trigger more selling, forcing more margin calls, so forth and so on.
That event was the double-whammy of collapsing oil prices and the economic shutdown in response to the coronavirus.
While it is certainly hoped by many that we are closer to the end of the liquidation cycle, than the beginning, the dollar funding crisis, a blowout in debt yields, and forced selling of assets, suggests there is likely more pain to come before we are done.
It’s not too late to take actions to preserve capital now, so you have capital to invest later.
“With our risk limits hit, and in order to protect our clients from both financial and emotional duress, we made the decision that even the reduced risk we were carrying was still too much.
The good news is that a great ‘buying’ opportunity is coming. Just don’t be in a ‘rush’ to try and buy the bottom.
I can assure you, when we ultimately see a clear ‘risk/reward’ set up to start taking on equity risk again, we will do so ‘with both hands.’
And we are sitting on a lot of cash just for that reason.”
You can’t “buy low,” if you don’t have anything to “buy with.”
The Problem With Pragmatism… and Inflation
Pragmatism is seeking immediate solutions with little to no consideration for the longer-term benefits and consequences. An excellent example of this is the Social Security system in the United States. In the Depression-era, a government-sponsored savings plan was established to “solve” for lack of retirement savings by requiring contributions to a government-sponsored savings plan. At the time, the idea made sense as the population was greatly skewed towards younger people. No one seriously considered whether there would always be enough workers to support benefits for retired people in the future. Now, long after those policies were enacted and those that pushed the legislation are long gone, the time is fast approaching when Social Security will be unable to pay out what the government has promised.
Pragmatism is the common path of governments, led by politicians seeking re-election and the retention of power. Instead of considering the long-term implications of their policies, they focus on satisfying an immediate desire of their constituents.
In his book Economics in One Lesson, Henry Hazlitt made this point very clear by elaborating on the problems that eventually transpire from imprudent monetary and fiscal policy.
“The art of economics consists in looking not merely at the immediate but at the longer effects of any act or policy; it consists in tracing the consequences of that policy not merely for one group but for all groups.
Nine-tenths of the economic fallacies that are working such dreadful harm in the world today are the result of ignoring this lesson.”
Inflation
One of the most pernicious of these issues in our “modern and sophisticated” intellectual age is that of inflation. When asked to define inflation, most people say “rising prices,” with no appreciation for the fact that price movements are an effect, not a cause. They are a symptom of monetary circumstances. Inflation is a disequilibrium between the amounts of currency entering an economic system relative to the productive output of that same system.
In today’s world, there is only fiat (“by decree”) currencies. In other words, the value of currencies are not backed by some physical commodity such as gold, silver, or oil. Currencies are only backed by the perceived productive capacity of the nation and the stability of the issuing government. If a government takes unreasonable measures in managing its fiscal and monetary affairs, then the standard of living in that society will deteriorate, and confidence in it erodes.
Put another way, when the people of a nation or its global counterparts lose confidence in the fiscal and monetary policy-makers, the result is a loss of confidence in the medium of exchange, and a devaluation of the currency ensues. The influence of those in power will ultimately prove to be unsustainable.
Inflation is an indicator of confidence in the currency as a surrogate of confidence in the policies of a government. It is a mirror. This is why James Grant is often quoted as saying, “The gold price is the reciprocal of the world’s faith in central banking.”
Confidence in a currency may be lost in a variety of ways. The one most apparent today is creating too many dollars as a means of subsidizing the spending habits of politicians and the borrowing demands of corporations and citizens.
Precedent
There is plenty of modern-day historical precedent for a loss of confidence from excessive debt creation and the inevitable excessive currency creation. Weimar Germany in the 1920s remains the modern era poster child, but Zimbabwe, Argentina, and Venezuela also offer recent examples.
Following the 2008 financial crisis, many believed that the actions of the Federal Reserve were “heroic.” Despite failing to see the warning signs of a housing bubble in the months and even years leading up to the crisis, the Fed’s perspective was that it exists to provide liquidity. As the chart below illustrates, that is precisely what they did.
Data Courtesy Bloomberg
That pragmatic response failed to heed Hazlitt’s warning. What are the longer-term effects for the economy, the bailed-out banking system, and all of us? How would these policies affect the economy, markets, society, and the wealth of the nation’s citizens in five, ten, or twenty years?
Keeping interest rates at a low level for many years following the financial crisis while the economy generally appears to have recovered raises other questions. The Fed continues to argue that inflation remains subdued. That argument goes largely undisputed despite credible evidence to the contrary. Further, it provides the Fed a rationalization for keeping rates well below normal.
Politicians who oversee the Fed and want to retain power, consent to low-rate policies believing it will foster economic growth. While that may make sense to some, it is short-sighted and, therefore, pragmatic. The assessment does not account for a variety of other complicating factors, namely, what may transpire in the future as a result? Are seeds of excess being sown as was the case in the dot-com bubble and the housing bubble? If so, can we gauge the magnitude?
Policy Imposition
In the mid-1960s, President Lyndon Johnson sought to escalate U.S. involvement in the Vietnam War. In doing so, he knew he would need the help of the Fed to hold interest rates down to run the budget deficits required to fund that war. Although then-Fed Chairman William McChesney Martin was reluctant to ease monetary policy, he endured various forms of abuse from the Oval Office and finally acquiesced.
The bullying these days comes from President Trump. Although his arguments for easier policy contradict what he said on the campaign trail in 2016, Jerome Powell is compliant. Until recently, the economy appeared to be running at full employment and all primary fundamental metrics were well above the prior peaks set in 2007.
Additionally, Congress, at Trump’s behest and as the chart below illustrates, has deployed massive fiscal stimulus that created a yawning gap (highlighted) between fiscal deficits and the unemployment picture. This is a divergence not seen since the Johnson administration in the 1960s (also highlighted) and one of magnitude never seen. As is very quickly becoming clear, those actions both monetary and fiscal, were irresponsible to the point of negligence. Now, when we need it most as the economy shuts down, there is little or no “dry powder”.
Data Courtesy Bloomberg
President Johnson got his way and was able to fund the war with abnormally low interest rates. However, what ensued over the next 15 years was a wave of inflation that destroyed the productive capacity of the economy well into the early 1980s. Interest rates eventually rose to 18%, and economic dynamism withered as did the spirits of the average American.
The springboard for that scenario was a pragmatic policy designed to solve an immediate problem with no regard for the future. Monetary policy that suppressed interest rates and fiscal policy that took advantage of artificially low interest rates to accumulate debt at a relatively low cost went against the American public best interests. The public could not conceive that government “of, by and for the people” would act in such a short-sighted and self-serving manner.
Data Courtesy Bloomberg
The Sequel
Before the COVID-19 pandemic, the Congressional Budget Office (CBO) projections for U.S. budget deficits exceeded $1 trillion per year for the next 10-years. According to the CBO, the U.S. Treasury’s $22.5 trillion cumulative debt outstanding was set to reach $34.5 trillion by 2029, and that scenario assumed a very optimistic GDP growth of 3% per year. Further, it laughably assumed no recession will occur in the next decade, even though we are already in the longest economic expansion since the Civil War. In the event of a recession, a $1.8 trillion-dollar annual deficit would align with average historical experience. Given the severity of what is evident from the early stages of the pandemic, that forecast may be very much on the low end of reality.
The 1960s taught us that monetary and fiscal policy is always better erring on the side of conservatism to avoid losing confidence in the currency. Members of the Fed repeatedly tell the public they know this. Yet, if that is the case, why would they be so influenced by a President focused on marketing for re-election purposes? Alternatively, maybe the policy table has been set over the past ten years in a way that prevents them from taking proper measures? Do they assume they would be rejected despite the principled nature of their actions?
Summary
Inflation currently seems to be the very least of our worries. Impeachment, Iran, North Korea and climate change were all crisis head fakes.
The Fed was also distracted by what amounted to financial dumpster fires in the fall of 2019. After a brief respite, the Fed’s balance sheet began surging higher again and they cut the Fed Funds rate well before there was any known threat of a global pandemic. What is unclear is whether imprudent fiscal policies were forcing the Fed into imprudent monetary policy or whether the Fed’s policies, historical and current, are the enabler of fiscal imprudence. Now that the world has changed, as it has a habit of doing sometimes even radically, policymakers and the collective public are in something of a fine mess to understate the situation.
Now we are contending with a real global financial, economic, and humanitarian threat and one that demands principled action as opposed to short-sighted pragmatism.
The COVID-19 pandemic is clearly not a head fake nor is it a random dumpster fire. Neither is it going away any time soon. Unlike heads of state or corporate CEOs, biological threats do not have a political agenda and they do not care about the value of their stock options. There is nothing to negotiate other than the effectiveness of efforts required to protect society.
Given the potential harm caused by the divergence between stimulus and economic fundamentals, it would be short-sighted and irresponsibly pragmatic to count out the prospect of inflation. Given the actions of the central bankers, it could also be the understatement of this new and very unusual decade.
Shedlock: Supply And Demand Shocks Coming Up
Dual economic shocks are underway simultaneously. There are shortages of some things and lack of demand for others.
The coronavirus is delivering a one-two punch to the world economy, laying it low for months to come and forcing investors to reprice equities and bonds to account for lower company earnings.
From one side, the epidemic is hammering the capacity to produce goods as swathes of Chinese factories remain shuttered and workers housebound. That’s stopping production of goods there and depriving companies elsewhere of the materials they need for their own businesses.
With the virus no longer contained to China, increasingly worried consumers everywhere are reluctant to shop, travel or eat out. As a result, companies are likely not only to send workers home, but to cease hiring or investing — worsening the hit to spending.
How the two shocks will reverberate has sparked some debate among economists, with Harvard University Professor Kenneth Rogoff writing this week that a 1970s style supply-shortage-induced inflation jolt can’t be ruled out. Others contend another round of weakening inflation is pending.
Some economists argue that what’s happened is mostly a supply side shock, others have highlighted the wallop to demand as well, to the degree that the distinction matters.
Slowest Since the Financial Crisis
Inflationary or Deflationary?
In terms of prices, it’s a bit of both, but mostly the latter.
There’s a run on sanitizers, face masks, toilet paper ect. Prices on face masks, if you can find them, have gone up.
But that is dwarfed by the demand shock coming from lack of wages for not working, not traveling, not eating out etc.
The lost wages for 60 million people in China locked in will be a staggering hit alone.
That has also hit Italy. It will soon hit the US.
Next add in the fear from falling markets. People, especially boomers proud of their accounts (and buying cars like mad) will stop doing so.
It will be sudden.
Bad Timing
COVID-19 comes at a tricky time for the global economy. Take Japan. The Oct sales tax hike saw GDP fall 1.6% q/q in Q4, taking year-over-year growth negative (black). That's a weak base even before factoring in Q1 deterioration in the manufacturing (blue) & services (red) PMIs… pic.twitter.com/iUZwQ1U2LA
'The stockpiling crisis that has hit supermarkets across Asia has spread to Europe as consumers start hoarding groceries and hygiene products amid fears of a coronavirus pandemic.' https://t.co/uV5OK1zLJj
Like in many other places, Euro zone is vulnerable to COVID-19 because its starting point is so weak. Growth in Q4 was just 0.1% q/q and it's hard to see how 2020 will be much better than 0.5% overall, far below the ECB forecast of 1.1% (as of Dec). Deflation risk is rising… pic.twitter.com/oLUbIKwHLg
The COVID-19 shock is likely to accelerate the structural shift away from brick & mortar retail in the US. Growth in core retail sales was already weak through Jan, even before virus anxiety built (top lhs). COVID-19 is, unfortunately, another reason to order online (top rhs)… pic.twitter.com/feu30pC4pW
There's a debate if COVID-19 is a supply or demand shock. There's evidence of supply disruption in longer delivery times in manufacturing. But we don't for a second worry that prices will rise, because weak demand swamps all that. Net net: negative demand shock dominates by far. pic.twitter.com/OtyMoJHTDT
Deflation is not really about prices. It’s about the value of debt on the books of banks that cannot be paid back by zombie corporations and individuals.
That is what the Fed fears. It takes lower and lower yields to prevent a debt crash. But it is entirely counterproductive and it does not help the consumer, only the asset holders. Fed (global central bank) policy is to blame.
These are the important point all the inflationistas miss.
Our Triple-C Rated Economy: Complacency, Contradictions, and Corona
“I got my toes in the water, ass in the sand
Not a worry in the world, a cold beer in my hand
Life is good today, life is good today” – Toes, Zac Brown Band
The economic
and social instabilities in the U.S. are numerous and growing despite the fact
that many of these factors have been in place and observable for years.
Overvaluation of equity markets
Weak GDP Growth
High Debt to GDP levels
BBB Corporate Debt at Record Levels
High Leverage and Margin Debt
Weak Productivity
Growing Fiscal Deficits
Geopolitical uncertainty
Acute Domestic Political Divisiveness
Rising Populism
Trade Wars
Corona Virus
As we know, this list could be extended for pages, however, the one thing that will never show up on this list is…?
Inflation.
Inflation
As reported
by the Bureau of Labor Statistics (BLS) and the Bureau of Economic Analysis
(BEA), inflation has been running above 2% for the better part of the last few
years. Despite CPI being greater than their 2% target, the Federal Reserve
(Fed) has been wringing their hands about the lack of inflation. They insist
that inflation, as currently measured, is too low. We must disclaim, this all
assumes we should have confidence in these measurements.
At his
January 29, 2020 press conference, Chairman Powell stated:
“…inflation
that runs persistently below our objective can lead longer-term inflation
expectations to drift down, pulling actual inflation even lower. In turn,
interest rates would be lower, as well, closer to their effective lower bound.
As a
result, we would have less room to reduce interest rates to support the economy
in a future downturn to the detriment of American families and businesses. We
have seen this dynamic play out in other economies around the world and we’re
determined to avoid it here in the United States.”
Contradictions
There are a couple of inconsistencies in Powell’s comments
from the most recent January 2020 post-FOMC press conference. These are issues
we have become increasingly interested in exploring because of the seeming
incoherence of Fed policy. Further, as investors, high valuations and PE
multiple expansion appear predicated upon “favorable” monetary policy. If
investors are to rely on the Fed, they would be well-advised to understand them and properly judge their coherence.
As discussed in Jerome
Powell & the Fed’s Great Betrayal,
Powell states that the supply of money that the Fed provides to the system is
to be based on the demand for money – not the economic growth rate. That is a
major departure from orthodox monetary policy. If investors had been paying
attention, the bond market should have melted down on that one sentence. It did
not because the market pays attention to the current implications for the Fed’s
actions, not the future shock of such a policy. It is a myopic curse that
someday could prove costly to investors.
As for Powell’s quote above, the first inconsistency is that
the circumstances they have seen “play
out in other countries” have not shown itself in the U.S. To front-run
something that has not occurred assumes you are correct to anticipate it
occurring in the future. It is pure speculation and quite a leap even for those smart PhDs at the
Fed.
“Overall, the U.S. economy appears likely
to expand at a moderate pace over the second half of 2007, with growth then
strengthening a bit in 2008 to a rate close to the economy’s underlying trend.” – Ben Bernanke, Testimony to Senate Banking
Committee, July 2007
Although we
have not actually seen this “dynamic” play out in the U.S. since the great
depression, Fed officials are so concerned about deflation that they have begun
telegraphing their intent to allow inflation to overshoot their 2% target. Based
on current Fed guidance, periods of lesser inflation would be offset by periods
of higher inflation.
Our question
is, how do they come to that conclusion and based on what analytical rigor and evidence? There is, by the way, evidence from other countries throughout
the history of humanity, that when money is printed to accommodate the spending
incontinence of politicians, people lose confidence in the domestic currency.
That would be devastatingly inflationary, and it is, without question of
measurements, where we are headed.
The next inconsistency
is that the Fed’s protracted engagement in quantitative easing (QE) over the
past ten years has created precisely the circumstances about which Powell warns
here – “less room to reduce interest rates… to the detriment of American
families and businesses.”
The Chairman
of the U.S. Fed, Jerome Powell, should understand how supply and demand works,
but as a reminder, the less available something is, everything else constant,
the more it is worth. Mr. Chairman, your predecessors removed $3.5 trillion of
bonds from the market, what did you think would happen to bond prices and
therefore yields?
Powell stumbled
head-first into that self-contradiction, especially after watching the
fantastic failure to normalize rates through rate hikes and quantitative
tightening (QT) earlier in 2019, which caused him to perform a hasty 180-degree
policy reversal in the fall of 2019.
We think this is a workable plan, and
it will, as one of my colleagues, President Harker, described it, it will be
like watching paint dry, that this will just be something that runs quietly in
the background. –
Janet Yellen, Federal Reserve Chairman, June 14, 2017, FOMC Press Conference
Contrary to the
reassurances of Janet Yellen and many other Fed members, it (QT) was a lot more
exciting than watching paint dry. That too is troubling.
Wise Owl
In a recent
interview on RealVision TV, James Grant, publisher of Grants Interest Rate
Observer said:
“Is
inflation a thing of the past?… are forces in place today that could
reproduce [the great inflation of the 1970s? Inflation by definition,
represents a loss of confidence in money. How do you lose confidence in money?
Well, you create too much of it to subsidize the spending habits of the
politicians. That’s one possible cause and are we on the way to something like
that? Well, possibly. In this splendid economy, we’re generating a
trillion-dollar budget deficit.”
Grant
continues:
“Then
two, there is the physical structure of the economy. We live in a world of
expedited delivery of just in time rather than just in case. We live in a world
of ubiquitous information about supply chains, but maybe if push comes to shove
in the world of geopolitics, the supply chains might break. Lo and behold, we
might be on our own in America for things we now import, and if we are, those
prices would not be so low, they would be much higher.”
Again,
pointing back to our recent article referenced above, Jerome Powell &
the Fed’s Great Betrayal, there are other indicators of inflation that
contradict what the Fed believes. In that article, we discussed real-world
examples such as M2 growth, and auto and housing prices, to contrast with the BLS
and Fed engineered metrics. Despite a plethora of readily available data to the
contrary, we are continually reminded by the Fed of the absence of inflation.
As we know,
the Fed just began another round of radical policy accommodation to incite higher
inflation. If you pre-suppose a confluence of circumstances that begins to
constrict global supply chains, then the inflation Grant theorizes might not be
so far-fetched. The Fed, as has historically been the case, would be caught looking
the wrong way, and given their proclivity toward wanting more inflation, it would
almost certainly be too late to respond.
“Moreover, the agencies have made
clear that no bank is too-big-too-fail, so that bank management, shareholders,
and un-insured debt holders understand that they will not escape the
consequences of excessive risk-taking. In short, although vigilance is
necessary, I believe the systemic risk inherent in the banking system is
well-managed and well-controlled.” – Benjamin S. Bernanke Fed Chairman confirmation hearing
November 15, 2005
“Rather than making management,
shareholders, and debt holders feel the consequences of their risk-taking, you
bailed them out. In short, you are the definition of moral hazard.” – Senator Jim Bunning at Bernanke
second confirmation hearing December 3, 2009
In the same way, there were recorded levels of laughter
in FOMC meetings at the absurd incentives homebuilders were offering to sell houses
in 2004, 2005, and 2006. The Fed is now equally blind, neglect, and arrogant concerning
the perceived absence of inflation. The laughter in the Eccles Building
boardroom stopped abruptly in mid-2007 as the housing market stalled. The Coronavirus
may be a similar wake-up call with serious economic consequences.
Here and
Now
The
situation that is developing illustrates the one-dimensional nature of Fed
thinking. Despite having the latest news
on the spread of the Corona Virus at the January 29, 2020 Federal Open Market
Committee (FOMC) meeting, the Fed’s concern was for a slowdown in global growth
and failed attempts to prime inflation. There was no consideration for
possible second and third-order effects of the virus.
What are the
possible second and third-order effects? They are the things that follow after
the obvious occurs. In this case, there is no question that China’s growth is
going to be hurt by the virus and quarantines, the restrictions on flight and
travel, and factory shutdowns. That is obvious.
Consider the
virus is now spreading rapidly to other suppliers of U.S. goods and services
such as Korea, Japan, and Italy. What might not be obvious is that the growing
problem will impede global commerce and cause fractures in the extensive and
complex network of global supply chains. Goods and services we are accustomed
to finding on the shelves of the local Wal-Mart or via the internet may not be
available to us, or if they are, they may come at a cost well above the price
we paid before the pandemic. If that occurs, those changes in prices will eventually
find their way to the BLS inflation data collectors, and then, as the old
saying goes, all bets are off.
Summary
There are
plenty of uncertainties in the world. Individuals have the decision-making
ability to evaluate those uncertainties and the risks they pose. That said, it
is difficult to remember a time when the potential turbulence we face has been
so broadly ignored by the “market” and so overlooked by the Fed and politicians.
It is as though we have been tranquilized by the ever-rising stock market and
net worth as an artifact of that fallacious indicator of security.
By all
appearances, stock index levels convey not a worry in the world. Indeed, life
is good today. We are just not so sure about tomorrow.
Why “Not-QE” is QE: Deciphering Gibberish
“I guess I should warn you, if I turn out to be particularly clear, you’ve probably misunderstood what I’ve said.” – Alan Greenspan
Imagine if Federal Reserve (Fed)
Chairman Jerome Powell told the American people they must pay more for the goods
and services they consume.
How long would it take for mobs with pitchforks
to surround the Mariner Eccles building?
However, Jerome Powell and every other member of the Fed routinely and consistently
convey pro-inflationary ideals, and there is nary a protest, which seems odd.
The reason for the American public’s complacency is that the Fed is not that direct
and relies on carefully crafted language and euphemisms to describe the desire
for higher inflation.
To wit, the following statements from past
and present Fed officials make it all but clear they want more inflation:
“That is why it is essential that we at the
Fed use our tools to make sure that we do not permit an unhealthy downward
drift in inflation expectations and inflation,” – Jerome Powell November
2019
“In order to move rates up, I would want to
see inflation that’s persistent and that’s significant,” -Jerome Powell
December 2019
“Been very challenging to get inflation back
to 2% target” -Jerome Powell December 2019
“Ms. Yellen also said that continuing low
inflation, regarded as a boon by many, could be “dangerous” – FT – November
2017
“One way to increase the scope for monetary
policy is to retain the Fed’s current focus on hitting a targeted value of
inflation, but to raise the target to, say, 3 or 4 percent.” –Ben
Bernanke October 2017
“Further weakness in inflation could prompt
the U.S. Federal Reserve to cut interest rates, even if economic growth
maintains its momentum” -James
Bullard, President of the Federal Reserve Bank of St. Louis May 2019
“Fed Evans Says Low Inflation Readings
Elevating His Concerns” -Bloomberg May 2019
“I believe an aggressive policy
action such as this is required to re-anchor inflation expectations at our
target.” Neel Kashkari, President Minneapolis Fed June
2019
As an aside, it cannot be overemphasized
the policies touted in the quotes above actually result in deflation, an
outcome the Fed desperately fears.
The Fed, and all central banks for
that matter, have a long history of using confusing economic terminology.
Economics is not as complicated as the Fed makes it seem. What does make economics
hard to grasp is the technical language and numerous contradictions the Fed uses
to explain economics and justify unorthodox monetary policy. It is made even
more difficult when the Fed’s supporting cast – the media, Wall Street and other
Fed apologists – regurgitate the Fed’s gibberish.
The Fed’s fourth installment of
quantitative easing (“QE4”, also known as “Not-QE QE”) is vehemently denied as
QE by the Fed and Fed apologists. These
denials, specifically a recent article in the Financial Times (FT), provide us
yet another opportunity to show how the Fed and its minions so blatantly
deceive the public.
What is QE?
QE is a transaction in which the Fed purchases
assets, mainly U.S. Treasury securities and mortgage-backed-securities, via their
network of primary dealers. In exchange for the assets, the Fed credits the participating
dealers’ reserve account at the Fed, which is a fancy word for a place for
dormant money. In this transaction, each dealer receives payment for the assets
sold to the Fed in an account that is essentially the equivalent of a
depository account with the Fed. Via QE, the Fed has created reserves that sit
in accounts maintained by it.
Reserves are the amount of funds required
by the Fed to be held by banks (which we are using interchangeably with
“primary dealer” for the remainder of this discussion) in their Fed account or
in vault cash to back up a percentage of specified deposit liabilities. While
QE is not directly money printing, it enables banks to create loans at a
multiple of approximately ten times the reserves available, if they so choose.
Notice that “Quantitative Easing” is the
preferred terminology for the operations that create additional reserves, not
something easier to understand and more direct like money/reserve printing, Fed
bond buying program, or liquidity injections. Consider the two words used to describe
this policy – Quantitative and Easing. Easing is an accurate descriptor of the
Fed’s actions as it refers to an action that makes financial conditions easier,
e.g., lower interest rates and more money/liquidity. However, what does
quantitative mean? From the Oxford Dictionary, “quantitative” is “relating to, measuring, or measured by the
quantity of something rather than its quality.”
So, QE is a measure of the amount of
easing in the economy. Does that make sense to you? Would the public be so
complacent if QE were called BBMPO (bond buying and money printing operations)?
Of course not. The public’s acceptance of QE without much thought is a victory
for the Fed marketing and public relations departments.
Is “Not-QE” QE?
The Fed and media are vehemently
defending the latest round of repurchase market (“repo”) operations and T-bill
purchases as “not QE.” Before the Fed even implemented these new measures,
Jerome Powell was quick to qualify their actions accordingly: “My colleagues and I will soon announce
measures to add to the supply of reserves over time,” “This is not QE.”
This new round of easing is QE, QE4, to be
specific. We dissect a recent article from the
FT to debunk the nonsense commonly used to differentiate these recent actions
from QE.
The article presents three factors
that must be present for an action to qualify as QE, and then it rationalizes
why recent Fed operations are something else. Here are the requirements, per
the article:
“increasing the volume of reserves in the
banking system”
“altering the mix of assets held by investors”
“influence investors’ expectations about
monetary policy”
Simply:
providing
banks the ability to make more money
forcing
investors to take more risk and thereby push asset prices higher
steer
expectations about future Fed policy.
Point 1
In the article, White argues “that the US banking system has not
multiplied up the Fed’s injection of reserves.”
That is an objectively false
statement. Since September 2019, when repo and Treasury bill purchase operations
started, the assets on the Fed’s balance sheet have increased by approximately
$397 billion. Since they didn’t pay for those assets with cash, wampum, bitcoin,
or physical currency, we know that $397 billion in additional reserves have
been created. We also know that excess reserves, those reserves held above the
minimum and therefore not required to backstop specified deposit liabilities,
have increased by only $124 billion since September 2019. That means $273
billion (397-124) in reserves were employed (“multiplied up”) by banks to
support loan growth.
Regardless of whether these reserves
were used to back loans to individuals, corporations, hedge funds, or the U.S.
government, banks increased the amount of debt outstanding and therefore the
supply of money. In the first half of 2019, the M2 money supply rose at a 4.0%
to 4.5% annualized rate. Since September, M2 has grown at a 7% annualized rate.
Point 2
White’s second argument against the
recent Fed action’s qualifying as QE is that, because the Fed is buying Treasury
Bills and offering short term repo for this round of operations, they are not
removing riskier assets like longer term Treasury notes and mortgage-backed securities
from the market. As such, they are not causing investors to replace safe investments
with riskier ones. Ergo, not QE.
This too is false. Although by purchasing
T-bills and offering repo the Fed has focused on the part of the bond market
with little to no price risk, the Fed has removed a vast amount of assets in a
short period. Out of necessity, investors need to replace those assets with other
assets. There are now fewer non-risky assets available due to the Fed’s actions,
thus replacement assets in aggregate must be riskier than those they replace.
Additionally, the Fed is offering repo
funding to the market. Repo is largely used by banks, hedge funds,
and other investors to deploy leverage when buying financial assets. By cheapening
the cost of this funding source and making it more readily available, institutional
investors are incented to expand their use of leverage. As we know, this alters
the pricing of all assets, be they stocks, bonds, or commodities.
By way of example, we know that two
large mortgage REITs, AGNC and NLY, have dramatically increased the leverage
they utilize to acquire mortgage related assets over the last few months. They
fund and lever their portfolios in part with repo.
Point 3
White’s third point states, “the Fed is not using its balance sheet to
guide expectations for interest rates.”
Again, patently false. One would have
to be dangerously naïve to subscribe to White’s logic. As described below,
recent measures by the Fed are gargantuan relative to steps they had taken over
the prior 50 years. Are we to believe
that more money, more leverage, and fewer assets in the fixed income universe is
anything other than a signal that the Fed wants lower interest rates? Is
the Fed taking these steps for more altruistic reasons?
Bad Advice
After pulling the wool over his reader’s
eyes, the author of the FT article ends with a little advice to investors:“Rather than obsessing about fluctuations in
the size of the Fed’s balance sheet, then, investors might be better off
focusing on those things that have changed more fundamentally in recent
months.”
After a riddled and generally incoherent explanation about why QE is not QE, White has the chutzpah to follow up with advice to disregard the actions of the world’s largest central bank and the crisis-type operations they are conducting. QE 4 and repo operations were a sudden and major reversal of policy. On a relative basis using a 6-month rate of change, it was the third largest liquidity injection to the U.S. financial system, exceeded only by actions taken following the 9/11 terror attacks and the 2008 financial crisis. As shown below, using a 12-month rate of change, recent Fed actions constitute the single biggest liquidity injection in 50 years of data.
Are we to believe that the latest
round of Fed policy is not worth following? In what is the biggest “tell” that
White is not qualified on this topic, every investment manager knows that money
moves the markets and changes in liquidity, especially those driven by the
central banks, are critically important to follow.
The graph below compares prior balance
sheet actions to the latest round.
Data Courtesy St. Louis Federal Reserve
This next graph is a not so subtle
reminder that the current use of repo is simply unprecedented.
Data Courtesy St. Louis Federal Reserve
Summary
This is a rebuttal to the FT article and
comments from the Fed, others on Wall Street and those employed by the
financial media. The wrong-headed views in the FT article largely parrot those
of Ben Bernanke. This past January he stated the following:
“Quantitative easing works through two
principal channels: by reducing the net supply of longer-term assets, which
increases their prices and lower their yields; and by signaling policymakers’
intention to keep short rates low for an extended period. Both channels helped
ease financial conditions in the post-crisis era.” -LINK
Bourbon, tequila, and beer offer
drinkers’ very different flavors of alcohol, but they all have the same effect. This round of QE may be a slightly
different cocktail of policy action, but it is just as potent as QE 1, 2, and 3
and will equally intoxicate the market as much, if not more.
Keep in mind that QE 1, 2, and 3 were
described as emergency policy actions designed to foster recovery from
an economic crisis. Might that fact be the rationale for claiming this round of
liquidity is far different from prior ones? Altering words to describe clear
emergency policy actions is a calculated effort to normalize those actions.
Normalizing them gives the Fed greater latitude to use them at will, which appears
to be the true objective. Pathetic though it may be, it is the only rationale that
helps us understand their obfuscation.
Dallas Fed President Sees “No Move” In Fed Funds Rate
Dallas Fed President Robert Kaplan made some interesting comments today on interest rates, repos, and the coronavirus.
Dallas Fed President Robert Kaplan was on panel discussion today at the University of Texas McCombs School of Business on the “2020 Business Outlook: Real Estate and the Texas Economy” in Austin, Texas.
Bloomberg Econoday Synopsis
Dallas Fed President Robert Kaplan is neutral right now on monetary policy, saying neither a rate cut nor a rate hike are necessary in the medium term. “My base case is no movement up or down in the Fed funds rate [in 2020], but I’ll be monitoring [things] carefully … this year,” Kaplan said in a panel discussion.
Kaplan believes the outlook for the economy has stabilized and if anything has “firmed”, and though he now has “a more confident outlook” he isn’t ready to commit to a rate hike saying it’s “too soon to judge if a hike is coming, and you’ve got a number of [risky] factors going on.”
Regarding a so-called “coronavirus cut” to reassure markets, Kaplan doesn’t see justification yet adding, however, that he is carefully watching how the virus unfolds and that he will have a better sense of its effects over the next few months. Kaplan also noted that he will be watching the first-half impact of the Boeing 737 production shutdown.
On repo operations, Kaplan described the rise in the Fed’s balance sheet through year-end as “substantial” but he sees slowing growth through June. “I’d be hopeful and expect that as we continue bill purchases during the second quarter, the repo usage will begin to decline and the headline net balance-sheet growth for the Fed will moderate – certainly far more moderate than what’s we’ve seen to this period.”
On inflation, Kaplan’s base case is an upward trend toward 2 percent in the medium term. Kaplan said the Fed is debating whether to lengthen out its look at inflation from a one-year average to perhaps a two-year average. “We look at a variety of factors to make our judgment.”
Regarding no interest rate movement, the market disagrees, and so do I.
On inflation, the entire fed is clueless about what it is.
“Lenin was certainly right. There is no subtler, no surer means of overturning the existing basis of society than to debauch the currency. The process engages all the hidden forces of economic law on the side of destruction, and does it in a manner which not one man in a million is able to diagnose.”
John Maynard Keynes – The Economic Consequences of Peace 1920
“And when we see that we’ve reached that level we’ll begin to gradually reduce our asset purchases to the level of the underlying trend growth of demand for our liabilities.” –Jerome Powell January 29, 2020.
With that one seemingly innocuous statement, Chairman Powell revealed an alarming admission about the supply of money and your wealth. The current state of monetary policy explains why so many people are falling behind and why wealth inequality is at levels last seen almost 100 years ago.
REALity
“Real” is a very important concept in the field of economics. Real generally refers to an amount of something adjusted for the effects of inflation. This allows economists to measure true organic growth or decline.
Real is
equally important for the rest of us. The size of our paycheck or bank account
balance is meaningless without an understanding of what money can buy. For
instance, an annual income of $25,000 in 1920 was about eight times the
national average. Today that puts a family of four below the Federal Poverty
Guideline. As your grandfather used to say, a dollar doesn’t go as far as it
used to.
Real wealth and
real wage growth are important for assessing your economic standing and that of
the nation.
Here are two
facts:
Wealth is largely a function of the wages we earn
The wages we earn are predominately a function of the growth rate of the economy
These facts
establish that the prosperity and wealth of all citizens in aggregate is meaningfully
tied to economic growth or the output of a nation. It makes perfect sense.
Now, let us consider
inflation and the role it plays in determining our real wages and real wealth.
If the rate
of inflation is less than the rate of wage growth over time, then our real
wages are rising and our wealth is increasing. Conversely, if inflation rises
at a pace faster than wages, wealth declines despite a larger paycheck and more
money in the bank.
With that understanding of “real,” let’s discuss inflation.
What is Inflation?
Borrowing
from an upcoming article, we describe inflation in the following way:
“One of the most pernicious of these issues in our “modern and sophisticated” intellectual age is that of inflation. Most people, when asked to define inflation, would say “rising prices” with no appreciation for the fact that price movements are an effect, not a cause. They are a symptom of monetary circumstances. Inflation defined is, in fact, a disequilibrium between the amount of currency entering an economic system relative to the productive output of that same system.”
The price of
cars, cheeseburgers, movie tickets, and all the other goods and services we
consume are chiefly based on supply and demand. Demand is a function of both
our need and desire to own a good and, equally importantly, how much money we
have. The amount of money we have in aggregate, known as money supply, is
governed by the Federal Reserve. Therefore, the supply of money is a key
component of demand and therefore a significant factor affecting prices.
With the
linkage between the supply of money and inflation defined, let us revisit
Powell’s recent revelation.
“And when we see that we’ve reached that level we’ll begin to gradually reduce our asset purchases to the level of the underlying trend growth of demand for our liabilities.”
In plain English, Powell states that the supply of money is based on the demand for money and not the economic growth rate. To clarify, one of the Fed’s largest liabilities currently are bank reserves. Banks are required to hold reserves for every loan they make. Therefore, they need reserves to create money to lend. Ergo, “demand for our liabilities,” as Powell states, actually means bank demand for the seed funding to create money and make loans.
The
relationship between money supply and the demand for money may, in fact, be
aligned with economic growth. If so, then the supply of money should rise with
the economy. This occurs when debt is predominately employed to facilitate
productive investments.
The problem occurs
when money is demanded for consumption or speculation. For example:
When hedge funds demand billions to leverage their trading activity
When Apple, which has over $200 billion in cash, borrows money to buy back their stock
When you borrow money to buy a car, the size of the economy increases but not permanently as you are not likely to buy another car tomorrow and the next day
Now ask,
should the supply of money increase because of those instances?
The
relationship between the demand for money and economic activity boils down to
what percentage of the debt taken on is productive and helps the economy and
the populace grow versus what percentage is for speculation and consumption.
While there
is no way to quantify how debt is used, we do know that speculative and
consumptive debt has risen sharply and takes up a much larger percentage of all
debt than in prior eras. The glaring
evidence is the sharp rise of debt to GDP.
Data Courtesy St. Louis Federal
Reserve
If most of
the debt were used productively, then the level of debt would drop relative to
GDP. In other words, the debt would not only produce more economic growth but
would also pay for itself. The exact
opposite is occurring as growth languishes despite record levels of debt
accumulation.
The
speculative markets provide further evidence. Without presenting the long list
of asset valuations that stand at or near record levels, consider that since
the last time the S&P 500 was fairly valued in 2009, it has grown 375%. Meanwhile,
total U.S. Treasury debt outstanding is up by 105% from $11 trillion to $22.5
trillion and corporate debt is up 55% from $6.5 trillion to $10.1 trillion. Over
that same period, nominal GDP has only grown 46% and Average Hourly Earnings by
29%.
When the money supply is increased
for consumptive and speculative purposes, the Fed creates dissonance between
our wages, wealth, and the rate of inflation. In other words, they generate
excessive inflation and reduce our real wealth.
If this is the case, why is the stated rate of inflation less than economic growth and wage growth?
The Wealth Scheme
This scheme
works like all schemes by keeping the majority of people blind to what is truly
occurring. To perpetuate such a scheme, the public must be convinced that inflation
is low and their wealth is increasing.
In 2000, a
brand new Ford Taurus SE sedan had an original MSRP of $18,935. The 2019 Ford
Taurus SE has a starting price of $27,800.
Over the last 19 years, the base price of the Ford Taurus has risen by
2.05% a year or a total of 47%. According to the Bureau of Labor Statics (BLS),
since the year 2000, the consumer price index for new vehicles has only risen
by 0.08% a year and a total of 1.68% over the same period.
For another instance of how inflation is grossly underreported, we highlighted flaws in the reporting of housing prices in MMT Sounds Great in Theory But… To wit:
“Since then, inflation measures have been tortured, mangled, and abused to the point where it scarcely equates to the inflation that consumers deal with in reality. For example, home prices were substituted for “homeowners equivalent rent,” which was falling at the time, and lowered inflationary pressures, despite rising house prices.
Since 1998, homeowners equivalent rent has risen 72% while house prices, as measured by the Shiller U.S. National Home Price Index has almost doubled the rate at 136%. Needless to say, house prices, which currently comprise almost 25% of CPI, have been grossly under-accounted for. In fact, since 1998 CPI has been under-reported by .40% a year on average. Considering that official CPI has run at a 2.20% annual rate since 1998, .40% is a big misrepresentation, especially for just one line item.”
Those two obscene examples highlight that the government reported inflation is not the same inflation experienced by consumers. It is important to note that we are not breaking new ground with the assertion that the government reporting of inflation is low. As we have previously discussed, numerous private assessments quantify that the real inflation rate could easily be well above the average reported 2% rate. For example, Shadow Stats quantifies that inflation is running at 10% when one uses the official BLS formula from 1980.
Despite what
we may sense and a multitude of private studies confirming that inflation is
running greater than 2%, there are a multitude of other government-sponsored
studies that argue inflation is actually over-stated. So, the battle is in the
trenches, and the devil is in the details.
As defined
earlier, inflation is “a disequilibrium
between the amount of currency entering an economic system relative to the
productive output of that same system.”
The
following graph shows that the supply of money, measured by M2, has grown far more
than the rate of economic growth (GDP) over the last 20 years.
Data St. Louis Federal Reserve
Since 2000,
M2 has grown 234% while GDP has grown at half of that rate, 117%. Over the same
period, the CPI price index has only grown by 53%. M2 implies an annualized
inflation rate over the last 20 years of 6.22% which is three times that of
CPI.
Dampening
perceived inflation is only part of the cover-up. The scheme is also
perpetuated with other help from the government. The government borrows to
boost temporary economic growth and help citizens on the margin. This further limits
people’s ability to detect a significant decline in their standard of living.
As shown
below, when one strips out the change in government debt (the actual increase
in U.S. Treasury debt outstanding) from the change in GDP growth, the organic economy
has shrunk for the better part of the last 20 years.
Data St. Louis Federal Reserve
It doesn’t
take an economist to know that a 6.22% inflation rate (based on M2) and decade
long recession would force changes to our monetary policy and send those
responsible to the guillotines. If someone suffering severe headaches is
diagnosed with a brain tumor, the problem does not go away because the doctor
uses white-out to cover up the tumor on the x-ray film.
Despite crystal clear evidence, the mirages
of economic growth and low inflation prevent us from seeing reality.
Summary
Those
engaging in speculative ventures with the benefit of cheap borrowing costs are
thriving. Those whose livelihood and wealth are dependent on a paycheck are
falling behind. For this large percentage of the population, their paychecks may
be growing in line with the stated government inflation rate but not the true inflation
rate they pay at the counter. They fall further behind day by day as shown
below.
While this
may be hard to prove using government inflation data, it is the reality.
If you think otherwise, you may want to ask why a political outsider like
Donald Trump won the election four years ago and why socialism and populism are
surging in popularity. We doubt that it is because everyone thinks their wealth
is increasing. To quote Bill Clinton’s 1992 campaign manager James Carville, “It’s the economy, stupid.”
That brings
us back to Jerome Powell and the Fed. The U.S. economy is driven by millions of
individuals making decisions in their own best interests. Prices are best
determined by those millions of people based on supply and demand – that
includes the price of money or interest rates. Any governmental interference
with that natural mechanism is a recipe for inefficiency and quite often failure.
If monetary policy is to be set by a small number of people in a conference room in the Eccles Building in Washington, D.C. who think they know what is best for us based on flawed data, then they should prepare themselves for even more radical social and political movements than we have already seen.
Retired Or Retiring Soon? Yes, Worry About A Correction
When I was growing up, my father used to tell me I should “never take advice from anyone who hasn’t succeeded at what they are advising.”
The most truth of that statement is found in the financial press, which consists mostly of people writing articles and giving advice on topics where they have little experience, and in general, have achieved no success.
The best example came last week in an email quoting:
“You recently suggested that you took profits from your portfolios; however, I read an article saying retirees shouldn’t change their strategies. ‘If you’ve got a thoughtful financial plan and a diversified investment portfolio, the general rule is to leave everything alone.'”
This seems to be an entirely different approach to what you are suggesting. Also, since corrections can’t be predicted, it seems to make sense.”
One of the biggest reasons why investors consistently underperform over the long-term is due to flawed investment advice.
Let me explain.
Corrections & Bear Markets Matter
It certainly seems logical, by looking the 120-year chart of the market, that one should just stay invested regardless of what happens. Eventually, as the financial media often suggests, the markets always get back to even. One such chart is the percentage gain/loss chart over the long-term, as shown below.
This is one of the most deceptive charts an advisor can show a client, particularly one that is close to, or worse in, retirement.
The reality is that you DIED long before ever achieving that 8% annualized long-term return you were promised. Secondly, math is a cruel teacher.
Visually, percentage drawdowns seem to be inconsequential relative to the massive percentage gains that preceded them. That is, until you convert percentages into points and reveal an uglier truth.
It is important to remember that a 100% gain on a $1000 investment, followed by a 50% loss, does not leave you with $1500. A 50% loss wipes out the previous 100% gain, leaving you with a 0% net return.
For retirees, this is a critically important point.
In 2000, the average “baby boomer” was around 45-years of age. The “dot.com” crash was painful, but with 20-years to go before retirement, there was time to recover. In 2010, following the financial crisis, the time to retirement for the oldest boomers was depleted, and the average boomer only had 10-years to recover. During both of these previous periods, portfolios were still in accumulation mode. However, today, only the youngest tranche of “boomers,” have the luxury of “time” to work through the next major market reversion. (This also explains why the share of workers over the age of 65 is at historical highs.)
With the majority of “boomers” now faced with the implications of a transition into the distribution phase of the investment cycle, such has important ramifications during market declines. The following example shows a $1 million portfolio with, and without, an annualized 4% withdrawal rate. (We are going into much deeper analysis on this in a moment.)
While a 10% decline in the market will reduce a portfolio from $1 million to $900,000, when combined with an assumed monthly withdrawal rate, the portfolio value is reduced by almost 14%. This is the result of taking distributions during a period of declining market values. Importantly, while it ONLY requires a non-withdrawal portfolio an 11.1% return to break even, it requires nearly a 20% return for a portfolio in the distribution phase to attain the same level.
Impairments to capital are the biggest challenges facing pre- and post-retirees currently.
This is an important distinction. Most articles written about retirees, or those ready to retire, is an unrealized assumption of an indefinite timeline.
While the market may not be different than it has been in the past. YOU ARE!
Starting Valuations Matter
As I have discussed previously, without understanding the importance of starting valuations on your investment returns, you can’t understand the impact the market will have on psychology, and investor behavior.
Over any 30-year period, beginning valuation levels have a tremendous impact on future returns.
As valuations rise, future rates of annualized returns fall. This should not be a surprise as simple logic states that if you overpay for an asset today, the future returns must, and will, be lower.
This is far less than the 8-10% rates of return currently promised by the Wall Street community. It is also why starting valuations are critical for individuals to understand when planning for both the accumulation and distribution, phases of the investment life-cycle.
Let’s elaborate on our example above.
We know that markets go up and down over time, therefore when advisors use “average” or “annualized” rates of return, results often deviate far from reality. However, we do know from historical analysis that valuations drive forward returns, so using historical data, we calculated the 4-periods where starting valuations were either above 20x earnings, or below 10x earnings. We then ran a $1000 investment going forward for 30-years on a total-return, inflation-adjusted, basis.
The results were not surprising.
At 10x earnings, the worst performing period started in 1918 and only saw $1000 grow to a bit more than $6000. The best performing period was actually not the screaming bull market that started in 1980 because the last 10-years of that particular cycle caught the “dot.com” crash. It was the post-WWII bull market that ran from 1942 through 1972 that was the winner. Of course, the crash of 1974, just two years later, extracted a good bit of those returns.
Conversely, at 20x earnings, the best performing period started in 1900, which caught the rise of the market to its peak in 1929. Unfortunately, the next 4-years wiped out roughly 85% of those gains. However, outside of that one period, all of the other periods fared worse than investing at lower valuations. (Note: 1993 is still currently running as its 30-year period will end in 2023.)
The point to be made here is simple and was precisely summed up by Warren Buffett:
“Price is what you pay. Value is what you get.”
To create our variable return assumption model, we averaged each of the 4-periods above into a single total return, inflation-adjusted, index. We could then see the impact of $1000 invested in the markets at both valuations BELOW 10x trailing earnings, and ABOVE 20x. Investing at 10x earnings yields substantially better results.
Starting Valuations Are Critical To Withdrawal Rates
With a more realistic return model, the impact of investing during periods of high valuations becomes more evident, particularly during the withdrawal phase of retirement.
Let’s start with our $1 million retirement portfolio. The chart below shows various “spend down” assumptions of a $1 million retirement portfolio adjusted for an 8% annualized return, the impact of inflation at 3%, and the effect of taxation on withdrawals.
By adjusting the annualized rate of return for the impact of inflation and taxes, the life expectancy of a portfolio grows considerably shorter. Unfortunately, this is what “really happens” to investors over time, but is never discussed in mainstream analysis.
To understand “real outcomes,” we must adjust for variable rates of returns. There is a significant difference between 8% annualized rates of return and 8% real rates of return.
When we adjust the spend down structure for elevated starting valuation levels, and include inflation and taxes, a far different, and less favorable, outcome emerges. Retirees will run out of money not in year 30, but in year 18.
With this understanding, let’s revisit what happens to “buy and hold” investors over time. The chart below shows $3000 invested annually into the S&P 500 inflation-adjusted, total return index at 10% compounded annually, and both 10x and 20x valuation starting levels. I have also shown $3000 saved annually and “stuffed in a mattress.”
The red line is 10% compounded annually. While you don’t get compounded returns, it is there for comparative purposes to the real returns received over the 30-year investment horizon starting at 10x and 20x valuation levels. The shortfall between the promised 10% annual rates of return and actual returns are shown in the two shaded areas. In other words, if you are banking on some advisor’s promise of 10% annual returns for retirement, you aren’t going to make it.
Questions Retirees Need To Ask About Plans
What this analysis reveals is that “retirees” SHOULDbe worried about bear markets.
Taking the correct view of your portfolio, and the risks being undertaken is critical when entering the retirement and distribution phase of the portfolio life cycle.
Most importantly, when building and/or reviewing your financial plan, these are the questions you must ask and have concrete answers for:
What are the expectations for future returns going forward given current valuation levels?
Should the withdrawal rates be downwardly adjusted to account for potentially lower future returns?
Given a decade long bull market, have adjustments been made for potentially front-loaded negative returns?
Has the impact of taxation been carefully considered in the planned withdrawal rate?
Have future inflation expectations been carefully considered?
Have drawdowns from portfolios during declining market environments, which accelerates principal bleed, been considered?
Have plans been made to harbor capital during up years to allow for reduced portfolio withdrawals during adverse market conditions?
Has the yield chase over the last decade, and low interest rate environment, which has created an extremely risky environment for retirement income planning, been carefully considered?
What steps should be considered to reduce potential credit and duration risk in bond portfolios?
Have expectations for compounded annual rates of returns been dismissed in lieu of a plan for variable rates of future returns?
If the answer is “no” to the majority of these questions. then feel free to contact one of the CFP’s in our office who take all of these issues into account.
With debt levels rising globally, economic growth on the long-end of the cycle, earnings growth weak, valuations high, and potential risk of a recession, the uncertainty of retirement plans has risen markedly. This lends itself to the problem of individuals having to spend a bulk of their “retirement” continuing to work.
Yes, not only should you worry about bear markets, you should worry about them a lot.
Recession Arithmetic: What Would It Take?
David Rosenberg explores Recession Arithmetic in today’s Breakfast With Dave. I add a few charts of my own to discuss.
Rosenberg notes “Private fixed investment has declined two quarters in a row as of 2019 Q3. Since 1980, this has only happened twice outside of a recession.”
Here is the chart he presented.
Fixed Investment, Imports, Government Share of GDP
Since 1980 there have been five recessions in the U.S.and only once, after the dotcom bust in 2001, was there a recession that didn’t feature an outright decline in consumption expenditures in at least one quarter. Importantly, even historical comparisons are complicated. The economy has changed over the last 40 years. As an example, in Q4 of 1979, fixed investment was 20% of GDP, while in 2019 it makes up 17%. Meanwhile, imports have expanded from 10% of GDP to 15% and the consumer’s role has risen from 61% to 68% of the economy. All that to say, as the structure of the economy has evolved so too has its susceptibility to risks. The implication is that historical shocks would have different effects today than they did 40 years ago.
So, what similarities exist across time? Well, every recession features a decline in fixed investment (on average -9.8% from the pre-recession period), and an accompanying decline in imports (coincidentally also about -9.5% from the pre-recession period). Given the persistent trade deficit, it’s not surprising that declines in domestic activity would result in a drawdown in imports (i.e. a boost to GDP).
So, what does all of this mean for where we are in the cycle? Private fixed investment has declined two quarters in a row as of 2019 Q3. Since 1980, this has only happened two other times outside of a recession. The first was in the year following the burst of the dotcom bubble, as systemic overinvestment unwound itself over the course of eight quarters. The second was in 2006, as the housing market imploded… and we all know how that story ended.Small sample bias notwithstanding, we can comfortably say that this is not something that should be dismissed offhand.
For now, the consumer has stood tall. Real consumption expenditures contributed 3.0% to GDP in Q2, and 2.1% in Q3. Whether the consumer can keep the economy from tipping into recession remains to be seen.
Dave’s comments got me thinking about the makeup of fixed investment. It does not take much of a slowdown to cause a recession. But there are two components and they do not always move together.
Fixed Investment Year-Over-Year
One thing easily stands out. Housing marked the bottom in 12 of 13 recessions. 2001 was the exception.
Fixed Investment Year-Over-Year Detail
Fixed Investment Tipping Point
We are very close to a tipping point in which residential and nonresidential fixed investment are near the zero line. The above chart shows recessions can happen with fixed investment still positive year-over-year.
Pater Tenebrarum at the Acting Man blog pinged me with this idea: The only caveat remains the large net speculative long position, but at the moment this strikes me almost as a “bear hook” that is keeping people on the sidelines waiting for the “inevitable” pullback while the train is leaving the station.
With the 6-year consolidation over, there is every reason fundamentally and technically for gold to continue up.
So, be my guest if you want to time gold to COT positions.
Technically Speaking
Technically, there is short-term monthly resistance between here and $1566. Perhaps there’s a pullback now, but with technical and fundamentals otherwise aligned why bet on it?
The next technical resistance area is the $1700 to $1800 area so any move above $1566 is likely to be a fast, strong one, perhaps with a retest of the $1566 area from above that.
It is important to note that nearly every ounce of gold ever mined is still in existence. A small fraction of that mined gold has been lost, and other small fractions sit in priceless statues in museums etc., and is thus not available for sale.
Otherwise, someone has to hold every ounce of gold ever mined, 100% of the time. That is the true supply. Jewelry buying and mine output are insignificant in comparison. We are not about to run out of gold as some gold shills suggest.
Mises refers to the desire to hold gold as “Reservation Demand“, that is the desire of people to hold their gold coins, bullion, bars, and jewelry rather than trading it for something else.
If we strike out jewelry buying, central bank buying, the dollar, and mine supply, what then determines “Reservation Demand” to own gold vs some other asset?
Faith in Central Banks
Talk of normalization was nonsense, as were various “Dot Plots” that suggested the Fed was on a major hiking cycle.
The market did not believe the Fed, neither did I, and neither did gold.
Once again we are back to my central gold theme question.
Is everything under control or not?
Contrarian Alert: Is Inflation Dead?
In the financial world, those who subscribe to the contrarian school of thought (including myself) keep an eye out for certain cues or indications that a trend has become overcrowded and is nearing its end. Some examples of these contrarian indicators are investor sentiment indexes, fear gauges such as the CBOE Volatility Index or VIX, the construction of record-breaking skyscrapers, and also the topics that are chosen for finance and business magazine covers. The last example is called the Magazine Cover Indicator and the logic behind it is that, by the time a trend has gained enough momentum or attention to justify its own cover story, it is about to become passé. In an infamous example, Businessweek published the cover story “The Death Of Equities” on August 13, 1979, right before the secular bull market began.
Bloomberg Businessweek’s latest cover story is called “Is Inflation Dead?,” which should make contrarians question whether the actual risk is higher inflation (or hidden inflation, as I will explain).
Here are the first few paragraphs from this piece –
If economics were literature, the story of what happened to inflation would be a gripping whodunit. Did inflation perish of natural causes—a weak economy, for instance? Was it killed by central banks, with high interest rates the murder weapon? Or is it not dead at all but just lurking, soon to return with a vengeance?
Like any good murder mystery, this one has a twist. What if the apparent defeat of inflation blew back on the central bankers themselves by making them appear expendable? Far from being lauded for a job well done, they’re under populist attack. “If the Fed had done its job properly, which it has not, the Stock Market would have been up 5000 to 10,000 additional points, and GDP would have been well over 4% instead of 3% … with almost no inflation,” President Donald Trump tweeted on April 14. On April 5, channeling Freddie Mercury of Queen, he said “you would see a rocket ship” if the central bank eased up.
The irony of Trump’s criticism of the Federal Reserve is that by historical standards, the bank is remarkably dovish—that is, inclined to keep rates low. After decades of working to tamp down inflation, even at the cost of inducing recessions, and finally succeeding, central bankers in developed economies have spent most of the past 10 years reversing course and trying to reignite it, with very little success. At a press conference on March 20, Fed Chairman Jerome Powell said low inflation is “one of the major challenges of our time.”
This “Is Inflation Dead?” cover story was published just a couple days after I published a detailed piece called “Where Is Inflation Hiding? In Asset Prices.” In that piece, I explained that the economics world was being fooled into believing a very dangerous fallacy over the last several years, which is the idea that there is very little inflation in the U.S. economy. I went on to explain how inflation is concentrated in asset prices (including stocks and bonds) rather than in consumer prices in this particular unusual economic cycle. Belief in the “low inflation” myth stems from the overly rigid reliance on conventional inflation indicators while completely ignoring the inflation in asset prices, which has resulted in extremely large and dangerous bubbles that will ultimately burst with disastrous consequences. As the chart below shows, assets such as global stocks and bonds have risen at a much higher rate than global real economy prices since the current bull market began in March 2009.
The people who are currently scratching their heads about low inflation while ignoring the massive asset bubbles that are growing right under their noses are the same ones who didn’t see the housing bubble’s warning signs in the mid-2000s. They were the ones justifying the growth of the housing bubble by saying “housing prices are rising because our population is growing,” “Americans are becoming wealthier and want larger, more luxurious homes,” and so on. During a bubble, the “crowd” will always tell themselves lies so that they don’t have to acknowledge the scary implications of the bubble and its coming burst. Once the bubble pops, they claim it was a freak occurrence that “nobody could have seen coming!” We’re making the same mistakes that we made during the housing bubble, but it’s just occurring in different industries, assets, and countries.
Where Is Inflation Hiding? In Asset Prices
A very dangerous fallacy has taken the world of economics by storm over the last several years: the idea that there is very little inflation in the U.S. economy, therefore interest rates should remain at unusually low levels for an even longer period of time. As I will prove in this piece, the people who believe in the “low inflation” myth are being fooled by the fact that inflation in this unusual, central bank-driven economic cycle is concentrated in asset prices rather than in consumer prices. By holding interest rates too low for too long, a massive asset bubble has inflated and is poised to inflate even further as long as economists and central banks like the Fed continue to be fooled by the “low inflation” myth. Unfortunately, the ultimate bursting of this unprecedented asset bubble is going to throw the U.S. and global economy into another depression.
One of the most fervent believers in the “low inflation” myth is President Donald Trump himself. Trump has complained many times about the Fed’s interest rate hikes that have occurred during his presidency. Over the past three years, the Fed hiked rates from 0% to 2.5%, which is still extremely low considering that rates above 5% were common throughout history. As Trump said earlier this month –
“Well I personally think the Fed should drop rates,” Mr. Trump said. “I think they really slowed us down. There’s no inflation. I would say in terms of quantitative tightening, it should actually now be quantitative easing. Very little if any inflation. And I think they should drop rates, and they should get rid of quantitative tightening. You would see a rocket ship. Despite that, we’re doing very well.”
Trump reiterated his “no inflation” belief in a tweet yesterday:
Neel Kashkari, president of the Federal Reserve Bank of Minneapolis, recently summarized the Fed’s position that inflation is still low and even believes that the Fed should let inflation run above its target for a few years:
Many prominent financial journalists and commentators including my friend Pedro da Costa believe that the Fed has been hiking interest rates too aggressively:
The well-known investing pundit and host of CNBC’s “Mad Money” TV show Jim Cramer is a vocal Fed rate hike critic and believer in the “low inflation” myth:
“Memo to Powell: keep listening. Be patient. Enjoy the employment gains. Let’s keep the strength going by waiting a little and not being too judgmental about rate hikes like some of your colleagues,” Cramer said.
The “Mad Money ” host reiterated his distaste in some Fed officials’ tendency to stick to traditional metrics when gauging how the economy is doing.
“How can you claim to be data-dependent if you’ve made up your mind before you see the data that you need one or two more rate hikes to get back to normal?” he asked. “Normal is where the data says you should go. Normal is the natural progression of jobs being created without a lot of inflation. Normal is not a percent.”
Belief in the “low inflation” myth stems from the overly rigid reliance on conventional inflation indicators even though we have been in an unconventional economic cycle since 2009 (because it has been driven by record low interest rates and trillions of dollars worth of quantitative easing). In this type of environment, it is wise to think outside of the box and to consider all information available, but most economists are still stuck in the past as if we are in a garden-variety business cycle in the twentieth century.
The Federal Reserve’s preferred inflation indicator is the core personal consumption expenditure price index (excluding volatile food and energy), which tracks the prices of U.S. consumer goods and services. The Fed has an official target of 2% annual inflation, but inflation has been running cooler than that since the Great Recession according to the core PCE index.
The inflation index most commonly referenced in the financial media is the core Consumer Price Index or CPI (excluding volatile food and energy). The core PCI tells a similar message as the core PCE index: consumer price inflation has been tepid since the Great Recession.
Wage growth has also been quite low since the Great Recession:
Overly rigid reliance on conventional inflation indicators has made the mainstream economics community completely blind to the elephant in the room, which is the fact that inflation has been concentrated in asset prices rather than consumer prices. As the chart below shows (which I’ve recreated from a chart made by Goldman Sachs a couple years ago), assets such as global stocks and bonds have risen at a much higher rate than global real economy prices since the current bull market began in March 2009.
Consumer price inflation has remained low while asset price inflation has exploded because asset prices have been acting like a relief valve for inflationary pressures that have been created by record low global interest rates and the pumping of trillions of dollars worth of liquidity into the global financial system. This doesn’t mean that we don’t have an inflation problem; we have a tremendous inflation problem on our hands, but you need to know where to look.
This Wikipedia entry explains how relief valves work in the mechanical world –
A relief valve or pressure relief valve (PRV) is a type of safety valve used to control or limit the pressure in a system; pressure might otherwise build up and create a process upset, instrument or equipment failure, or fire. The pressure is relieved by allowing the pressurised fluid to flow from an auxiliary passage out of the system. The relief valve is designed or set to open at a predetermined set pressure to protect pressure vessels and other equipment from being subjected to pressures that exceed their design limits. When the set pressure is exceeded, the relief valve becomes the “path of least resistance” as the valve is forced open and a portion of the fluid is diverted through the auxiliary route. The diverted fluid (liquid, gas or liquid–gas mixture) is usually routed through a piping system known as a flare header or relief header to a central, elevated gas flare where it is usually burned and the resulting combustion gases are released to the atmosphere. As the fluid is diverted, the pressure inside the vessel will stop rising. Once it reaches the valve’s reseating pressure, the valve will close.
As discussed earlier, the U.S. is currently experiencing a massive asset bubble due to the Fed’s aggressive, unconventional monetary policies during and after the Great Recession. The first of these policies is known as zero interest rate policy or ZIRP. The Fed cut its benchmark interest rate (the Fed Funds rate) to virtually zero and held rates at record low levels for a record length of time. Asset and credit bubbles often form when central banks cut interest rates to artificially low levels because it becomes much cheaper to borrow, low rates discourage saving and encourage speculation in riskier assets & endeavors, and because they encourage higher rates of inflation, to name a few examples. The dot-com and U.S. housing bubbles formed during relatively low interest rate periods as well.
In addition to ZIRP, the Fed utilized an unconventional monetary policy known as quantitative easing or QE, which pumped $3.5 trillion dollars worth of liquidity into the U.S. financial system from 2008 to 2014. When conducting QE, the Fed creates new money digitally for the purpose of buying bonds and other assets, which helps to boost the financial markets. The chart below shows the growth of the Fed’s balance sheet since QE started in 2008:
The Fed’s ZIRP and QE policies caused the S&P 500 to surge over 300% from its 2009 low:
The chart below compares the Fed’s balance sheet to the S&P 500. Notice how each expansion of the Fed’s balance sheet led to a corresponding increase in the S&P 500.
As a result of the Fed’s aggressive inflation of the stock market in the past decade, the S&P 500 rose much faster than earnings and is now at 1929-like valuations, which means that a painful correction is inevitable one way or another:
The Fed’s aggressive inflation of stocks and other assets has created a dangerous bubble in U.S. household wealth (see my presentation about this). U.S. household net worth has hit record levels relative to the GDP in recent years, which is a sign that household wealth is overly inflated and heading for an inevitable crash. The last two times household wealth became so stretched relative to the GDP were during the dot-com bubble and housing bubble, both of which ended in disaster. Terrifyingly, the current household wealth bubble blows the last two out of the water. There is a direct link between how large our current household wealth bubble is and how interest rates have been at record low levels for a record length of time. Unfortunately, the coming household wealth crash will be proportional to the run-up. (The Fed-driven household wealth bubble is also the main driver of growing U.S. wealth inequality, as I explained in Forbes recently.)
In addition to the fact that U.S. consumer price inflation has been low since the Great Recession because inflation has been concentrated in asset prices, there are many reasons to believe that consumer price inflation is actually running a lot hotter than mainstream economists think it is (or want you to think it is). According to John Williams, the proprietor of Shadow Government Statistics, the U.S. CPI formula has been changed over the years for the purpose of understating inflation.
For example, if we use the same CPI formula as we did in 1980 (blue line), it shows that inflation has been running at a nearly 10% annual rate for the past decade rather than the roughly 2% annual rate that today’s CPI (red line) indicates:
Similarly, the 1990 CPI formula (blue line) shows that inflation has been running at a roughly 5% annual rate rather than 2%:
One of the primary ways that our modern CPI formula understates inflation is through hedonic quality adjustments. In simple terms, consumer goods that experience technological improvements are considered to have fallen in price when calculating the CPI even if the price has stayed the same or even increased in real life. For example, if a computer with an eight-core processor costs $1,000 today and most computers have sixteen-core processors but cost $1,300 in two years from now, it may get recorded as only costing $800 for the purpose of calculating the CPI. Of course, that’s no consolation to the consumer who actually has to pay $1,300.
Because so many high-tech consumer products have entered our lives over the past forty years and those products have improved at a rapid rate, they have masked the very real inflation that has occurred in big ticket necessities like housing, healthcare, childcare, and higher education. Sure, it’s great that laptops, cell phones, and big screen TVs have been falling in price while gaining more features, but that doesn’t help Americans who are going bankrupt due to exorbitant medical bills, being crushed under the weight of student loans, and can’t find affordable housing anywhere.
The chart below from the American Enterprise Institute shows the dichotomy between high-tech consumer products, which have been falling in price, and big ticket necessities that have surged in price and are becoming increasingly out of reach for many Americans:
To summarize, America has a very real inflation problem, but it’s not where everyone is looking. The pervasive, but wrong belief that interest rates should remain at ultra-low levels will only serve to further inflate the asset bubbles that the mainstream economics world is ignoring or in denial of. Unfortunately, these bubbles are eventually going to burst and will cause an economic depression. We should not expect a different outcome when the same characters who completely missed the housing bubble’s obvious warning signs are still employed at the Fed, the big banks, investment firms, academia, and financial media.
Economic Theories & Debt Driven Realities
One of the most highly debated topics over the past few months has been the rise of Modern Monetary Theory (MMT). The economic theory has been around for quite some time but was shoved into prominence recently by Congressional Representative Alexandria Ocasio-Cortez’s “New Green Deal” which is heavily dependent on massive levels of Government funding.
There is much debate on both sides of the argument but, as is the case with all economic theories, supporters tend to latch onto the ideas they like, ignore the parts they don’t, and aggressively attack those who disagree with them. However, what we should all want is a robust set of fiscal and monetary policies which drive long-term economic prosperity for all.
Here is the problem with all economic theories – they sound great in theory, but in practice, it has been a vastly different outcome. For example, when it comes to deficits, John Maynard Keynes contended that:
“A general glut would occur when aggregate demand for goods was insufficient, leading to an economic downturn resulting in losses of potential output due to unnecessarily high unemployment, which results from the defensive (or reactive) decisions of the producers.”
In other words, when there is a lack of demand from consumers due to high unemployment, then the contraction in demand would force producers to take defensive actions to reduce output. Such a confluence of actions would lead to a recession.
In such a situation, Keynesian economics states that government policies could be used to increase aggregate demand, thus increasing economic activity and reducing unemployment and deflation. Investment by government injects income, which results in more spending in the general economy, which in turn stimulates more production and investment involving still more income and spending and so forth. The initial stimulation starts a cascade of events, whose total increase in economic activity is a multiple of the original investment.
Unfortunately, as shown below, economists, politicians, and the Federal Reserve have simply ignored the other part of the theory which states that when economic activity returns to normal, the Government should return to a surplus. Instead, the general thesis has been:
“If a little deficit is good, a bigger one should be better.”
As shown, politicians have given up be concerned with deficit reduction in exchange for the ability to spend without constraint.
However, as shown below, the theory of continued deficit spending has failed to produce a rising trend of economic growth.
When it comes to MMT, once again we see supporters grasping onto the aspects of the theory they like and ignoring the rest. The part they “like” sounds a whole lot like a “Turbotax” commercial:
The part they don’t like is:
“The only constraint on MMT is inflation.”
That constraint would come as, the theory purports, full employment causes inflationary pressures to rise. Obviously, at that point, the government could/would reduce its support as the economy would theoretically be self-sustaining.
However, as we questioned previously, the biggest issue is HOW EXACTLY do we measure inflation?
This is important because IF inflation is the ONLY constraint on debt issuance and deficits, then an accurate measure of inflation, by extension, is THE MOST critical requirement of the theory.
In other words:
“Where is the point where the policy must be reversed BEFORE you cause serious, and potentially irreversible, negative economic consequences?”
This is the part supporters dislike as it imposes a “limit” on spending whereas the idea of unconstrained debt issuance is far more attractive.
Again, there is no evidence that increasing debts or deficits, inflation or not, leads to stronger economic growth.
However, there is plenty of evidence which shows that rising debts and deficits lead to price inflation. (The chart below uses the consumer price index (CPI) which has been repeatedly manipulated and adjusted since the late 90’s to suppress the real rate of inflationary pressures in the economy. The actual rate of inflation adjusted for a basket of goods on an annual basis is significantly higher.)
Of course, given the Government has already been running a “quasi-MMT” program for the last 30-years, the real impact has been a continued shift of dependency on the Government anyway. Currently, one-in-four households in the U.S. have some dependency on government subsidies with social benefits as a percentage of real disposable income at record highs.
If $22 trillion in debt, and a deficit approaching $1 trillion, can cause a 20% dependency on government support, just imagine the dependency that could be created at $40 trillion?
If the goal of economic policy is to create stronger rates of economic growth, then any policy which uses debt to solve a debt problem is most likely NOT the right answer.
This is why proponents of Austrian economics suggest trying something different – less debt. Austrian economics suggests that a sustained period of low interest rates and excessive credit creation results in a volatile and unstable imbalance between saving and investment. In other words, low interest rates tend to stimulate borrowing from the banking system which in turn leads, as one would expect, to the expansion of credit. This expansion of credit then creates an expansion of the supply of money.
Therefore, as one would ultimately expect, the credit-sourced boom becomes unsustainable as artificially stimulated borrowing seeks out diminishing investment opportunities. Finally, the credit-sourced boom results in widespread malinvestments. When the exponential credit creation can no longer be sustained a “credit contraction” occurs which ultimately shrinks the money supply and the markets finally “clear” which causes resources to be reallocated back towards more efficient uses.
Time To Wake Up
For the last 30 years, each Administration, along with the Federal Reserve, have continued to operate under Keynesian monetary and fiscal policies believing the model worked. The reality, however, has been most of the aggregate growth in the economy has been financed by deficit spending, credit expansion and a reduction in savings. In turn, the reduction of productive investment into the economy has led to slowing output. As the economy slowed and wages fell the consumer was forced to take on more leverage which also decreased savings. As a result of the increased leverage, more of their income was needed to service the debt.
Secondly, most of the government spending programs redistribute income from workers to the unemployed. This, Keynesians argue, increases the welfare of many hurt by the recession. What their models ignore, however, is the reduced productivity that follows a shift of resources toward redistribution and away from productive investment.
In its essential framework, MMT suggests correctly that debts and deficits don’t matter as long as the money being borrowed and spent is used for productive purposes. Such means that the investments being made create a return greater than the carrying cost of the debt used to finance the projects.
Again, this is where MMT supporters go astray. Free healthcare, education, childcare, living wages, etc., are NOT a productive investments which have a return greater than the carrying cost of the debt. In actuality, history suggests these welfare supports have a negative multiplier effect in the economy.
What is most telling is the inability for the current economists, who maintain our monetary and fiscal policies, to realize the problem of trying to “cure a debt problem with more debt.”
This is why the policies that have been enacted previously have all failed, be it “cash for clunkers” to “Quantitative Easing”, because each intervention either dragged future consumption forward or stimulated asset markets. Dragging future consumption forward leaves a “void” in the future which must be continually filled, This is why creating an artificial wealth effect decreases savings which could, and should have been, used for productive investment.
The Keynesian view that “more money in people’s pockets” will drive up consumer spending, with a boost to GDP being the end result, has been clearly wrong. It hasn’t happened in 30 years.
MMT supporters have the same view that if the government hands out money it will create stronger economic growth. There is not evidence which supports such is actually the case.
It’s time for those driving both monetary and fiscal policy to wake up. The current path we are is unsustainable. The remedies being applied today is akin to using aspirin to treat cancer. Sure, it may make you feel better for the moment, but it isn’t curing the problem.
Unfortunately, the actions being taken today have been repeated throughout history as those elected into office are more concerned about “satiating the mob with bread and games” rather than suffering the short-term pain for the long-term survivability of the empire. In the end, every empire throughout history fell to its knees under the weight of debt and the debasement of their currency.
It’s time we wake up and realize that we too are on the same path.
We respect your privacy and will only send you email that is related to what you subscribed to and why you subscribed. You can unsubscribe whenever you want with just a click of your mouse. For more information please see... Disclosure & Privacy Policy.


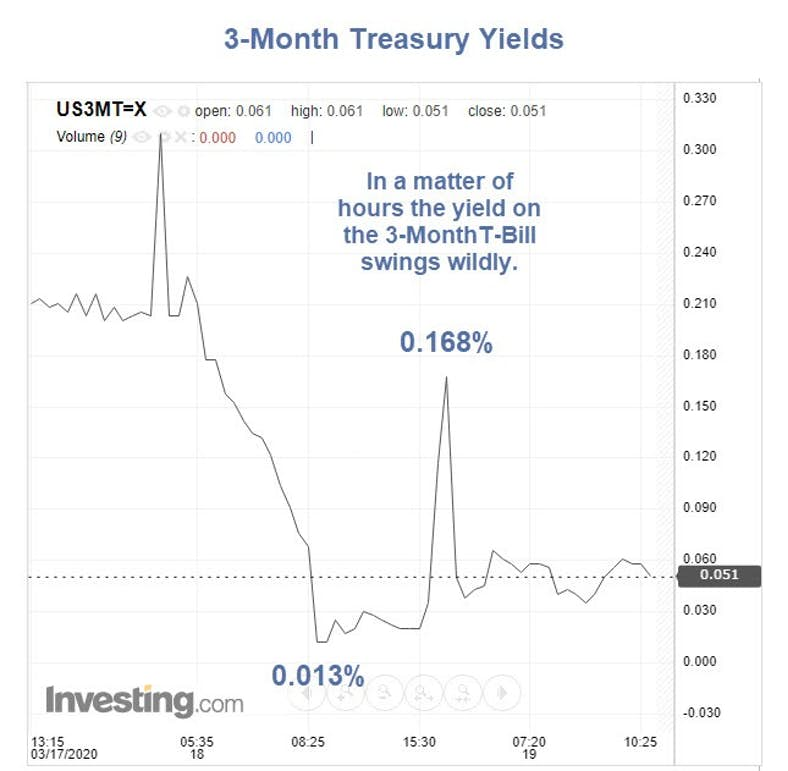


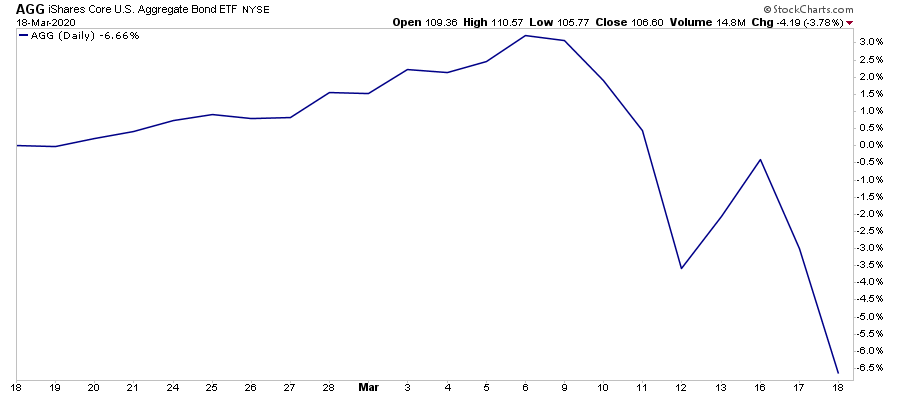
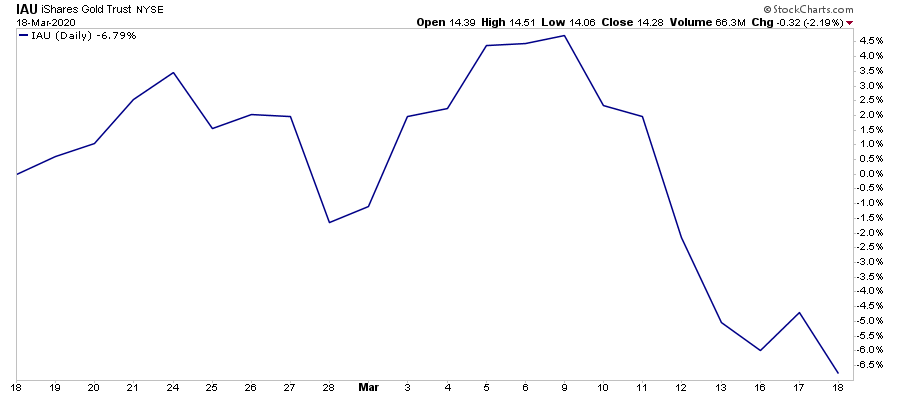
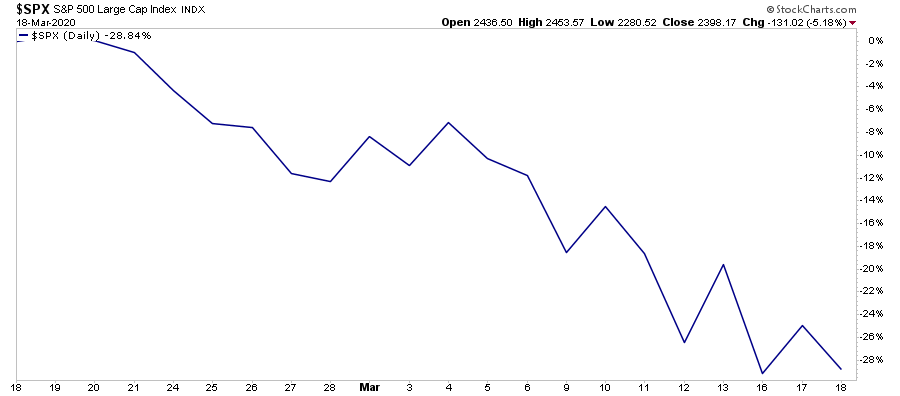
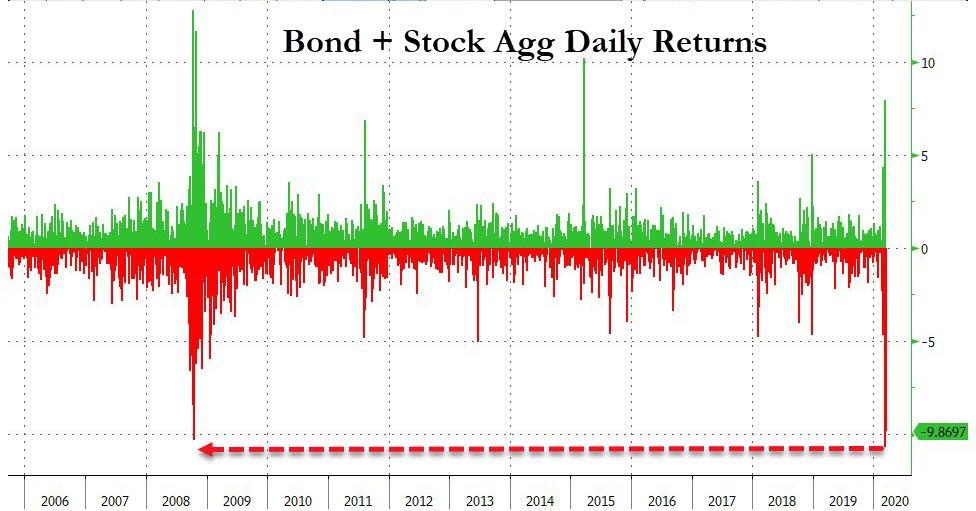

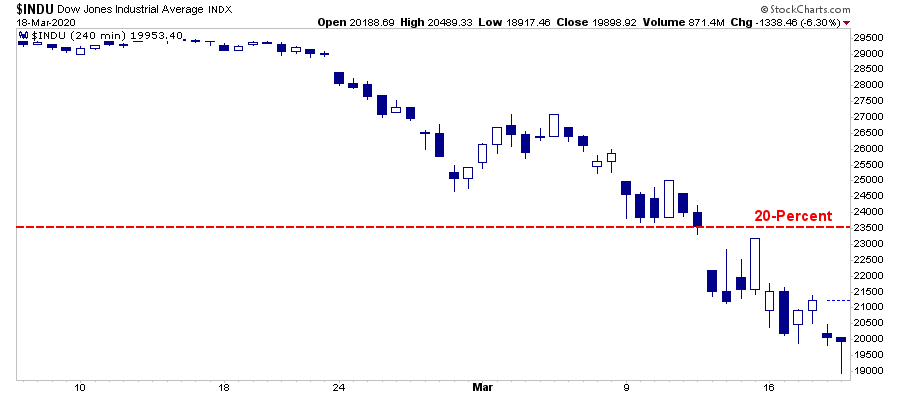
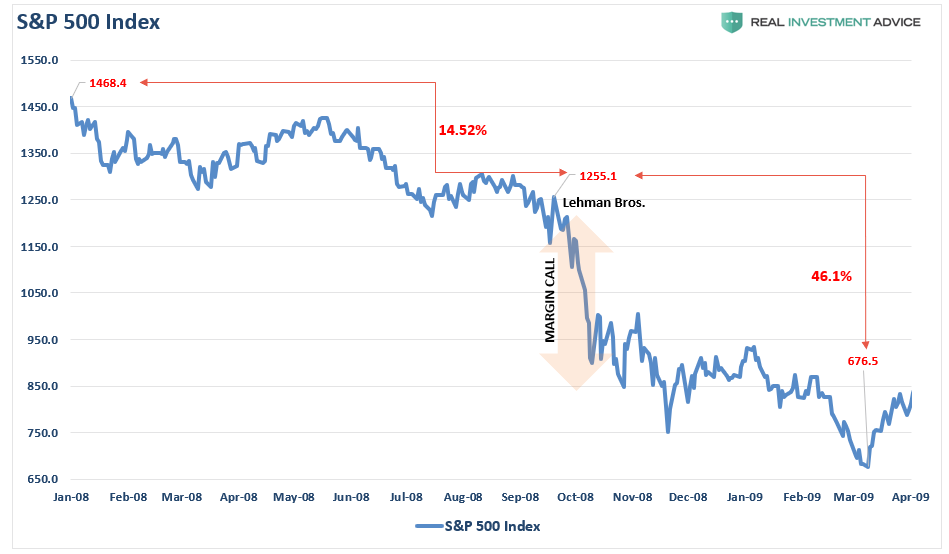
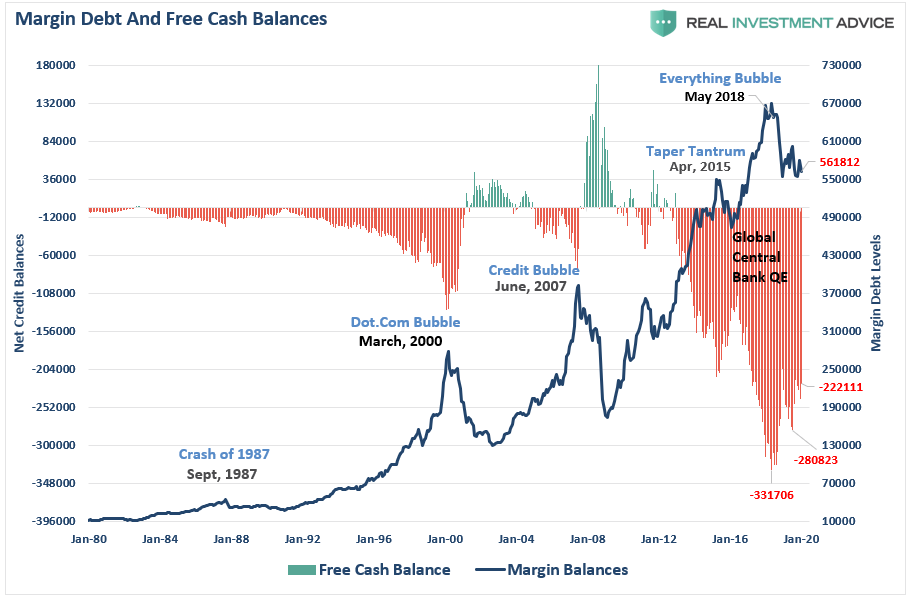
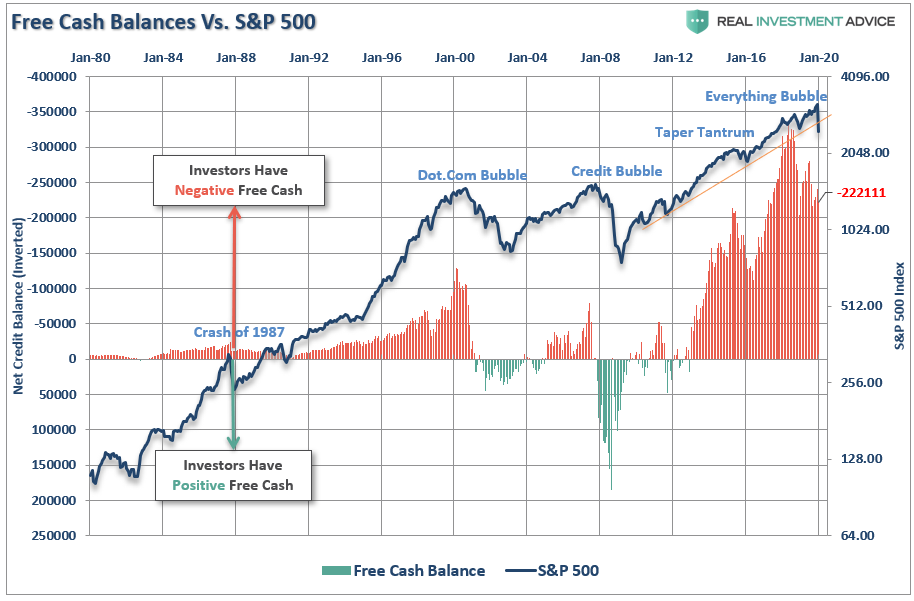
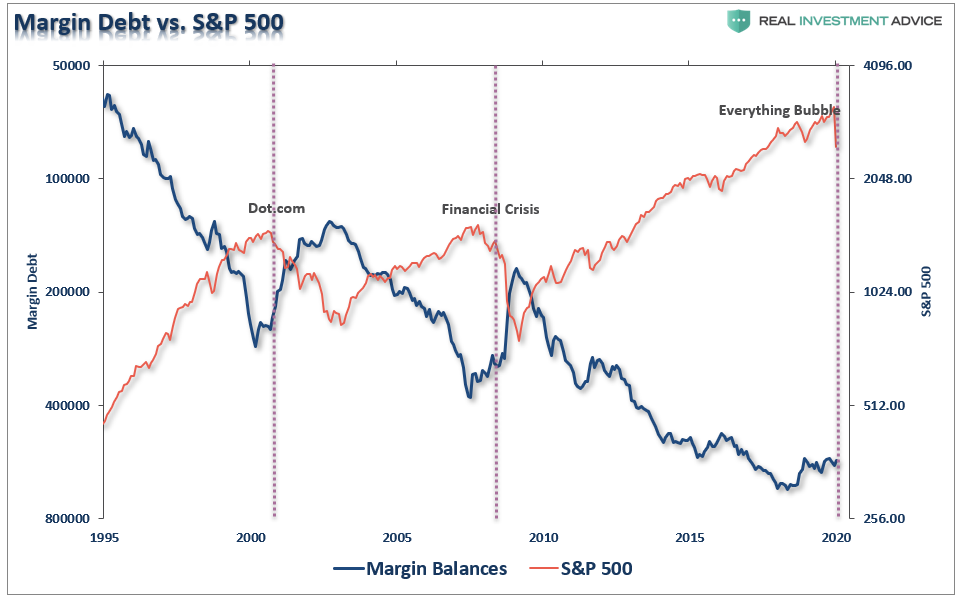

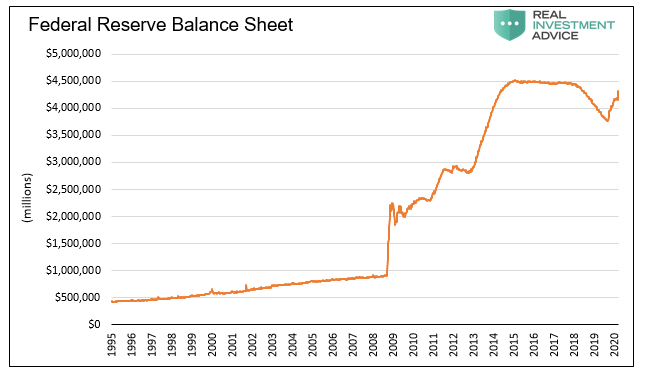

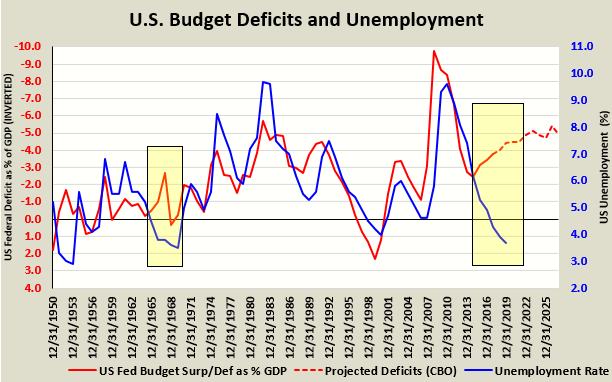
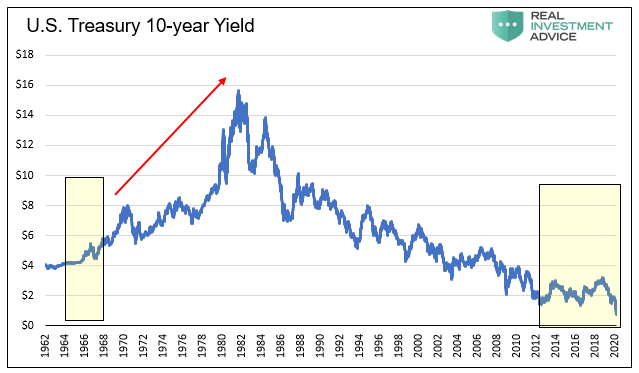


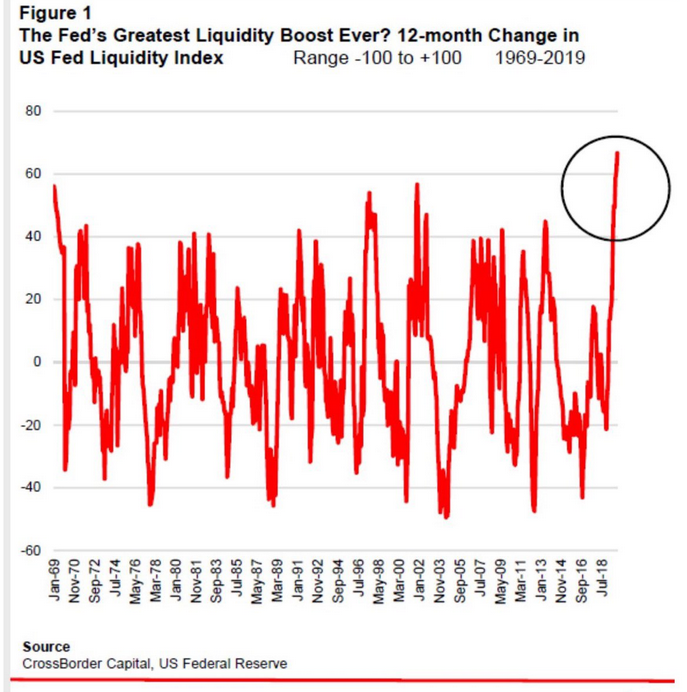
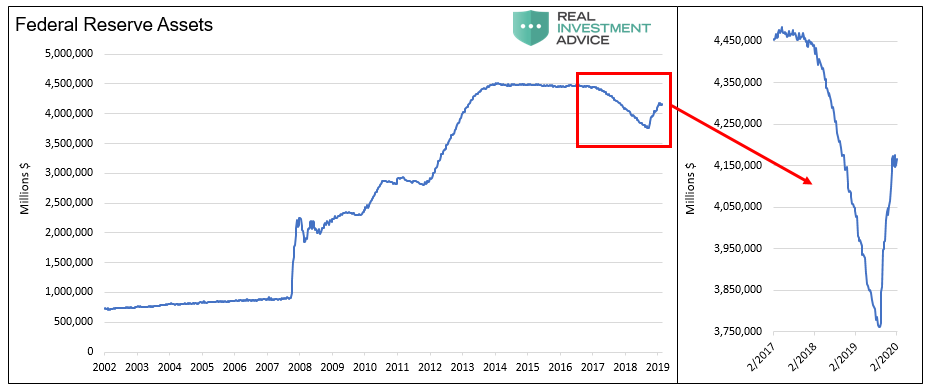
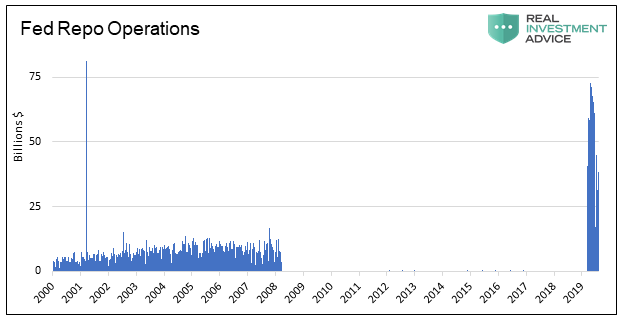
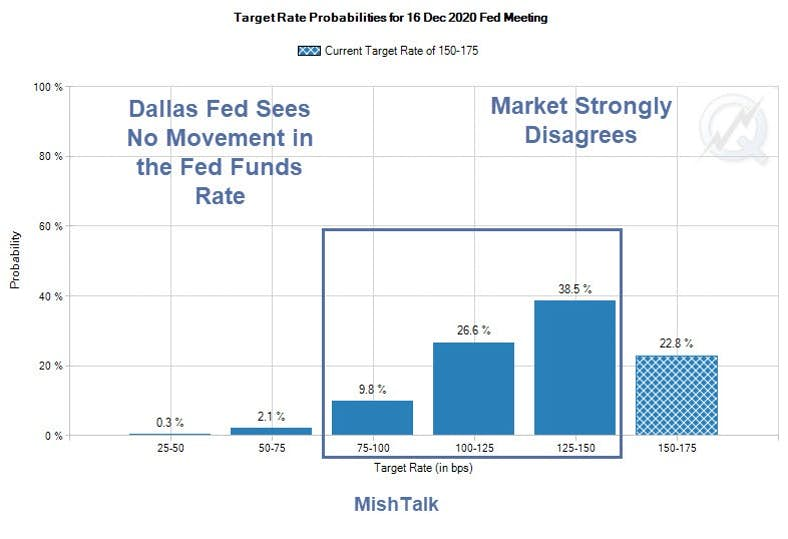
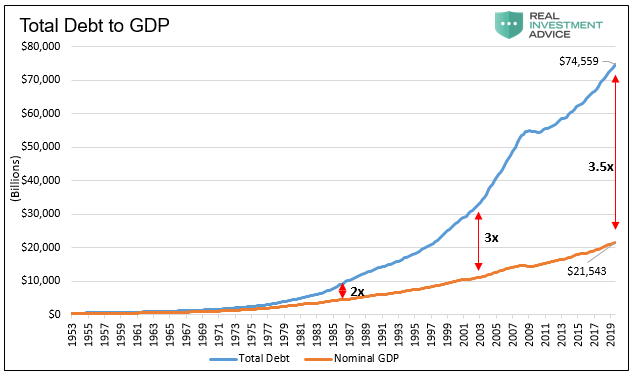
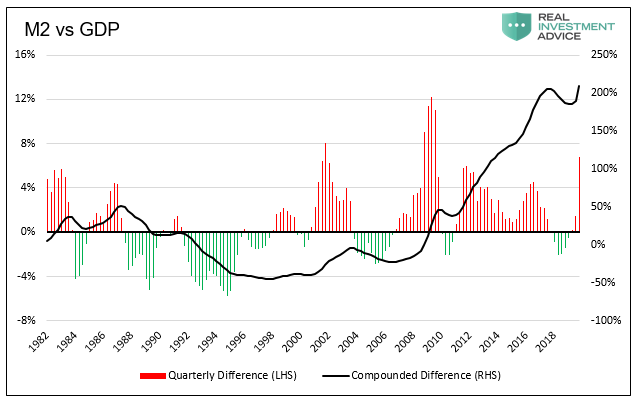
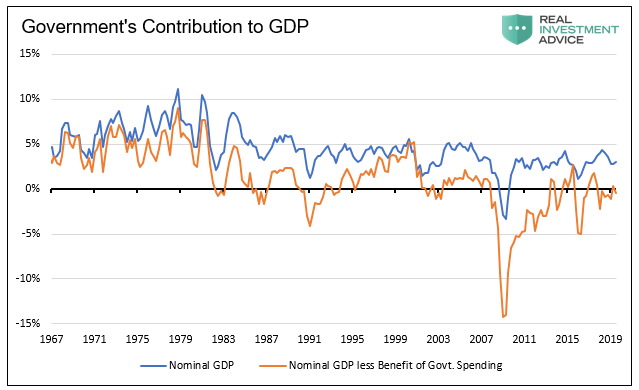
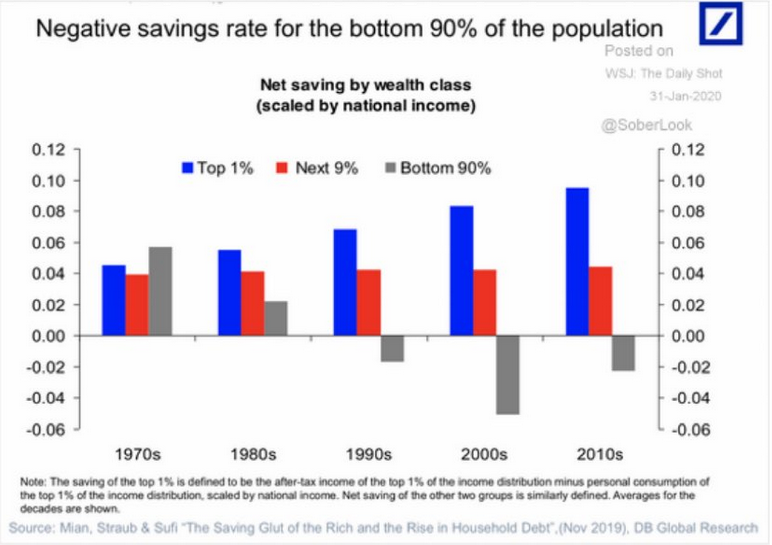
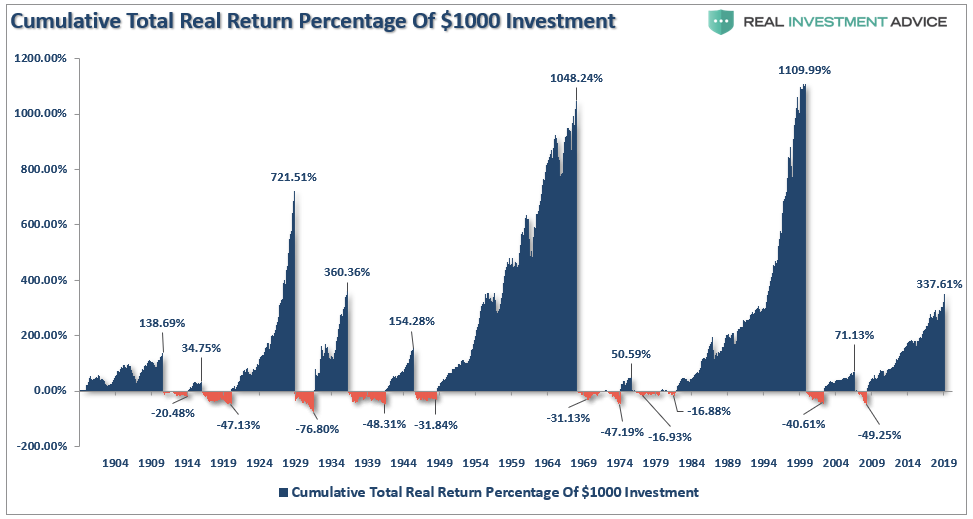


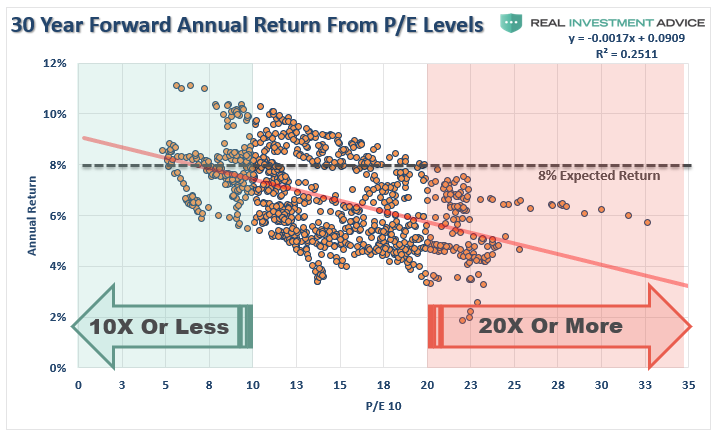
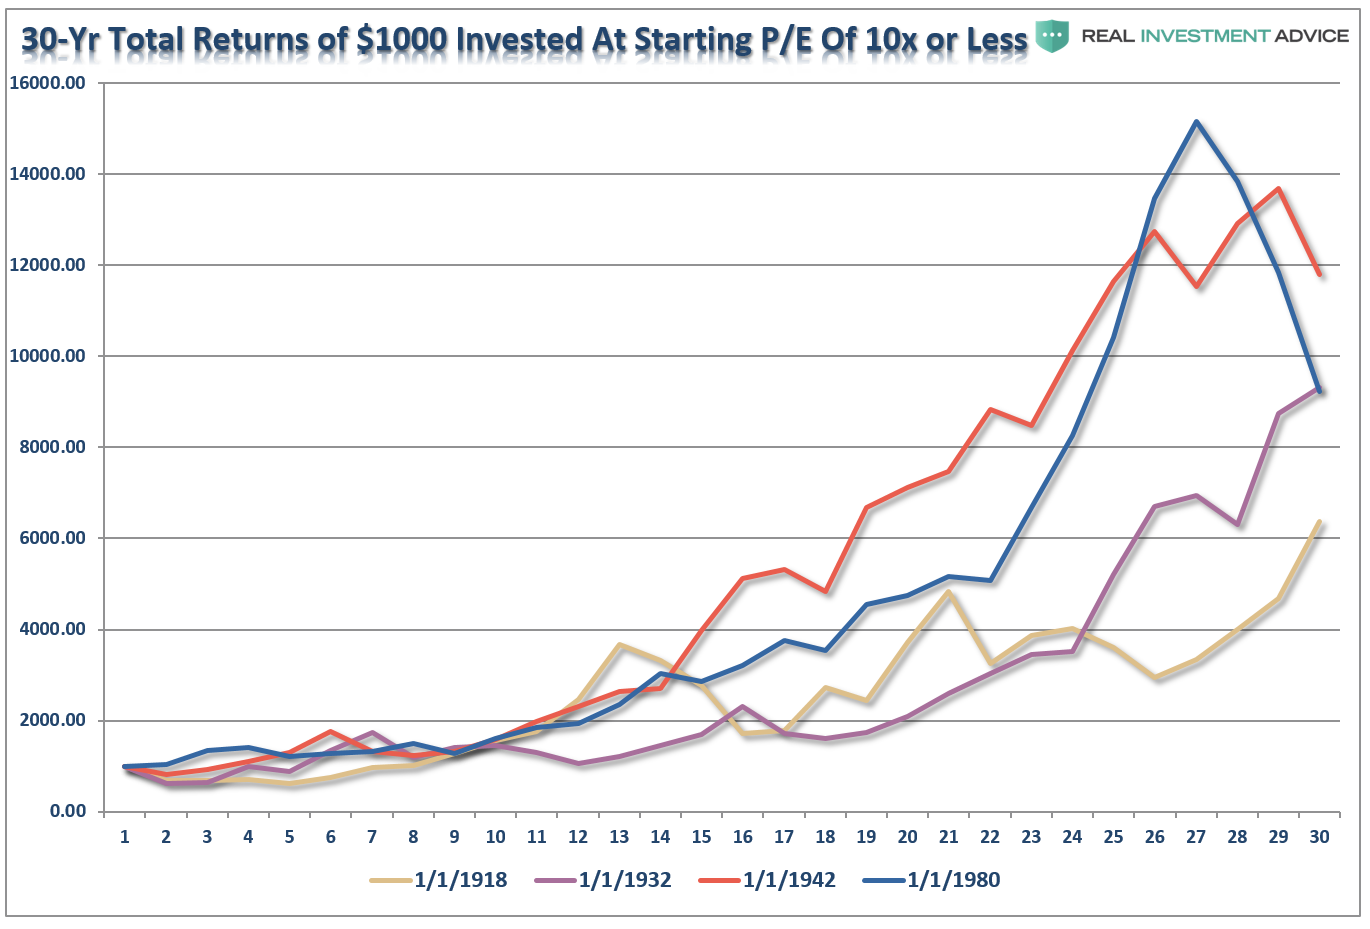
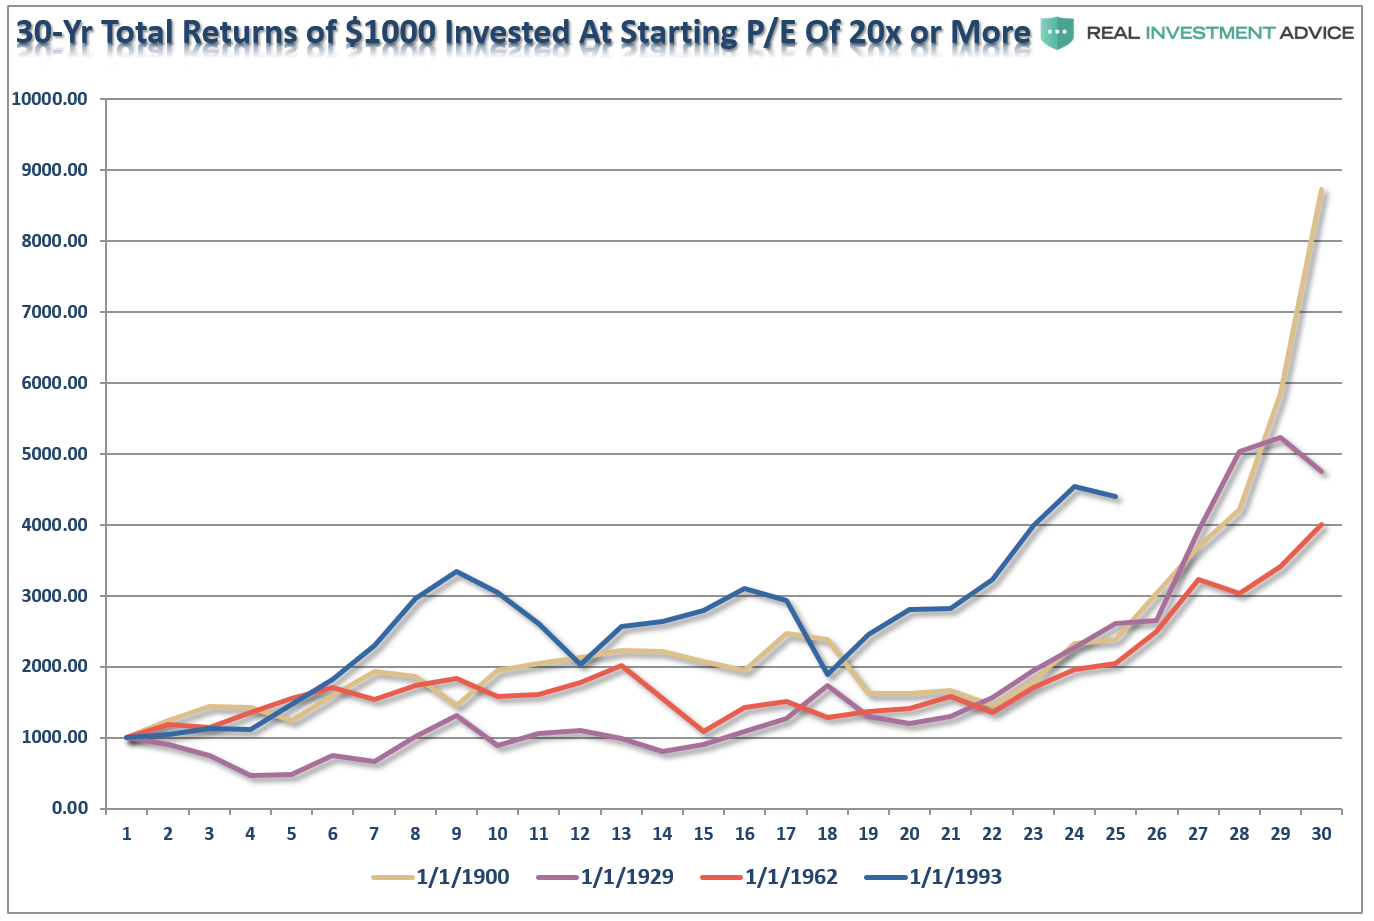
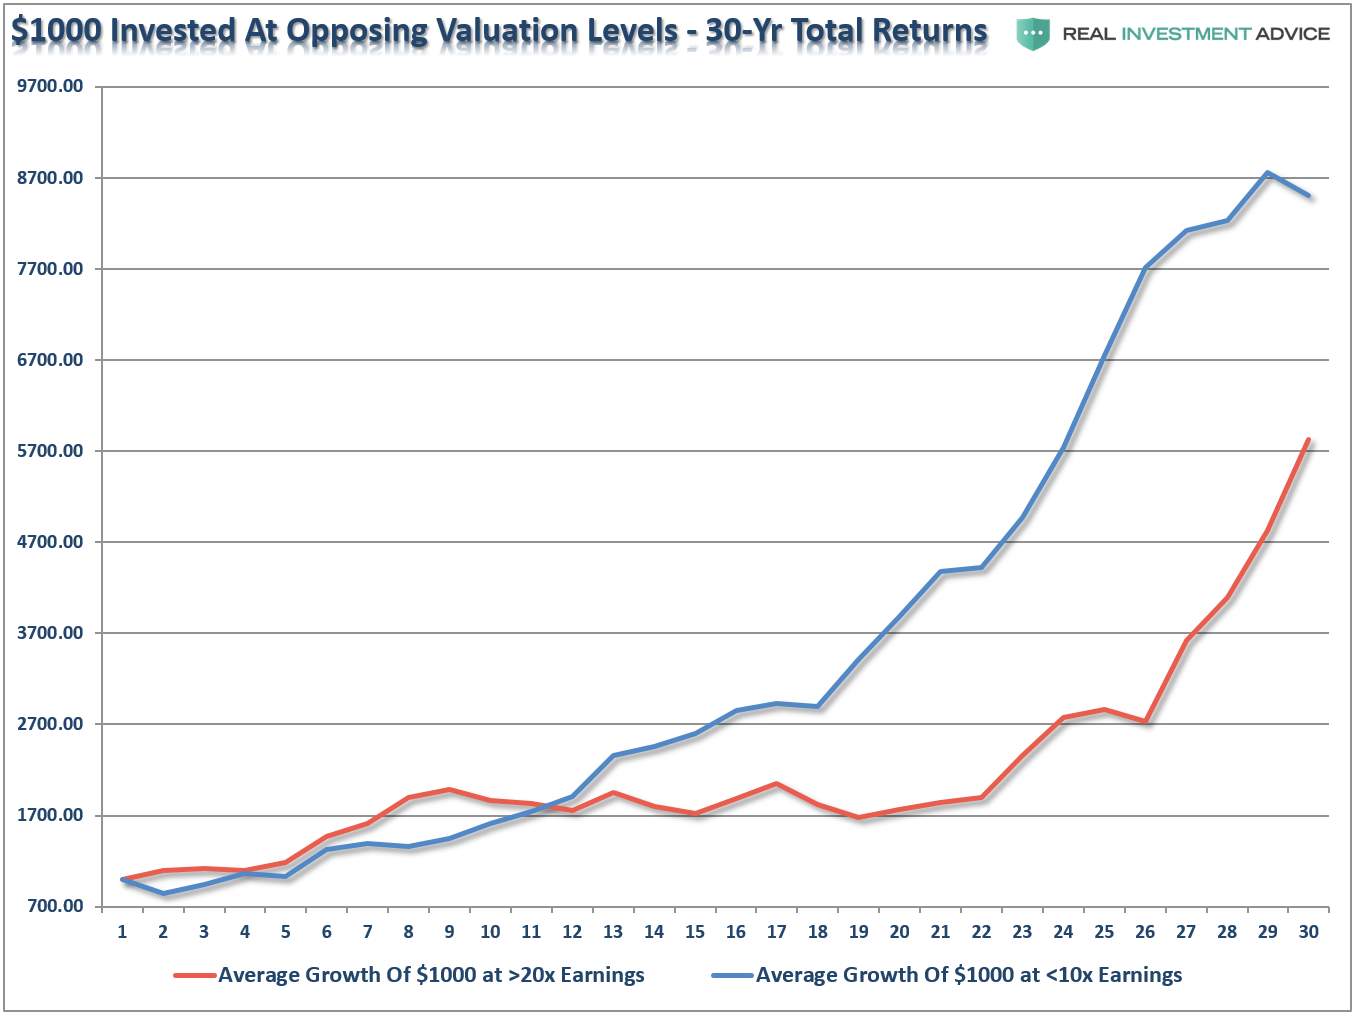
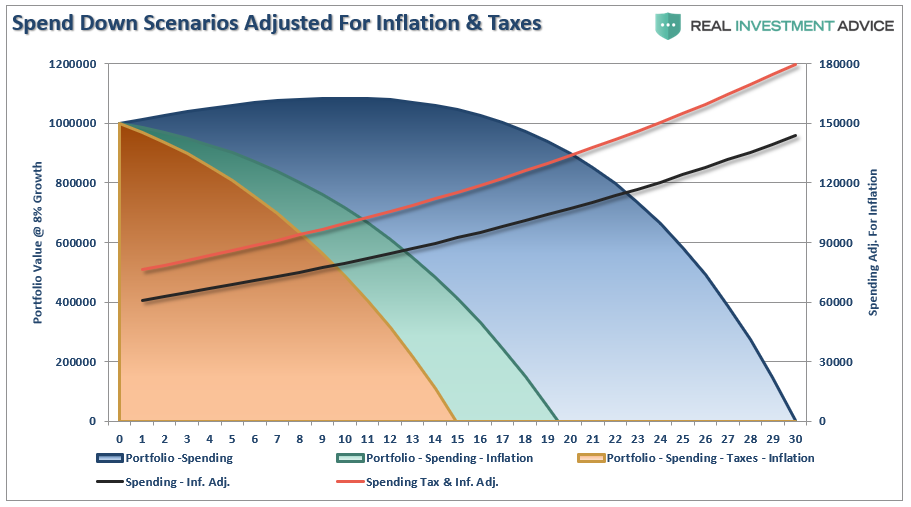
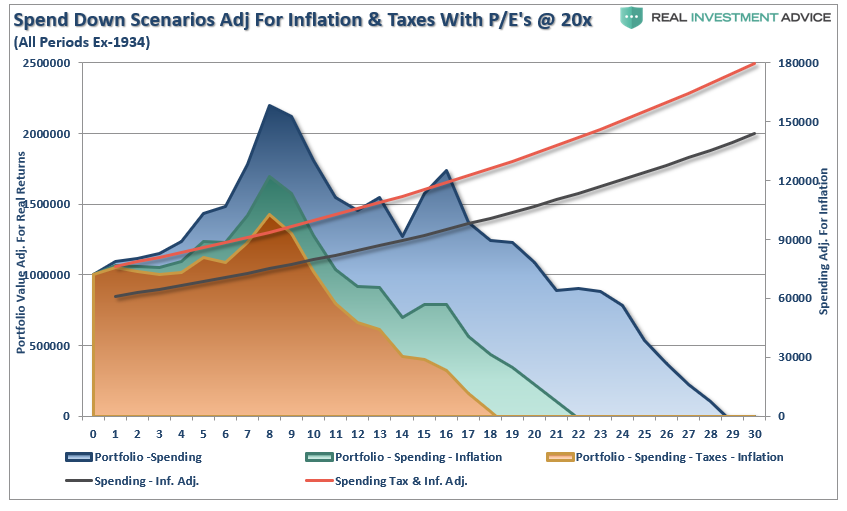


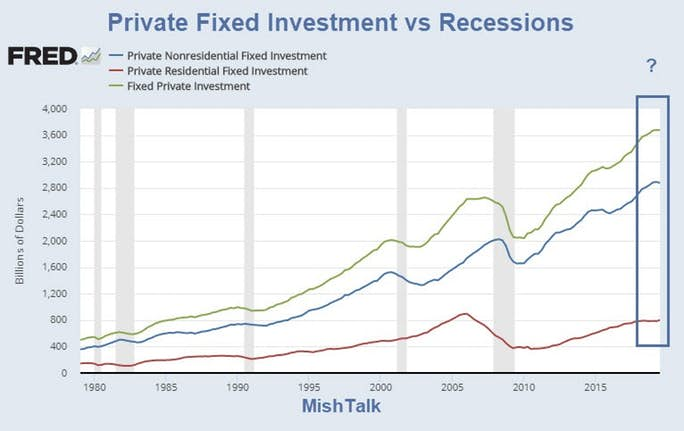


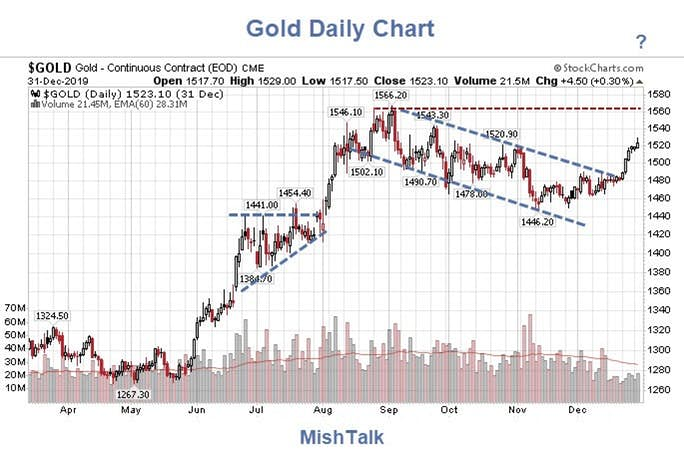


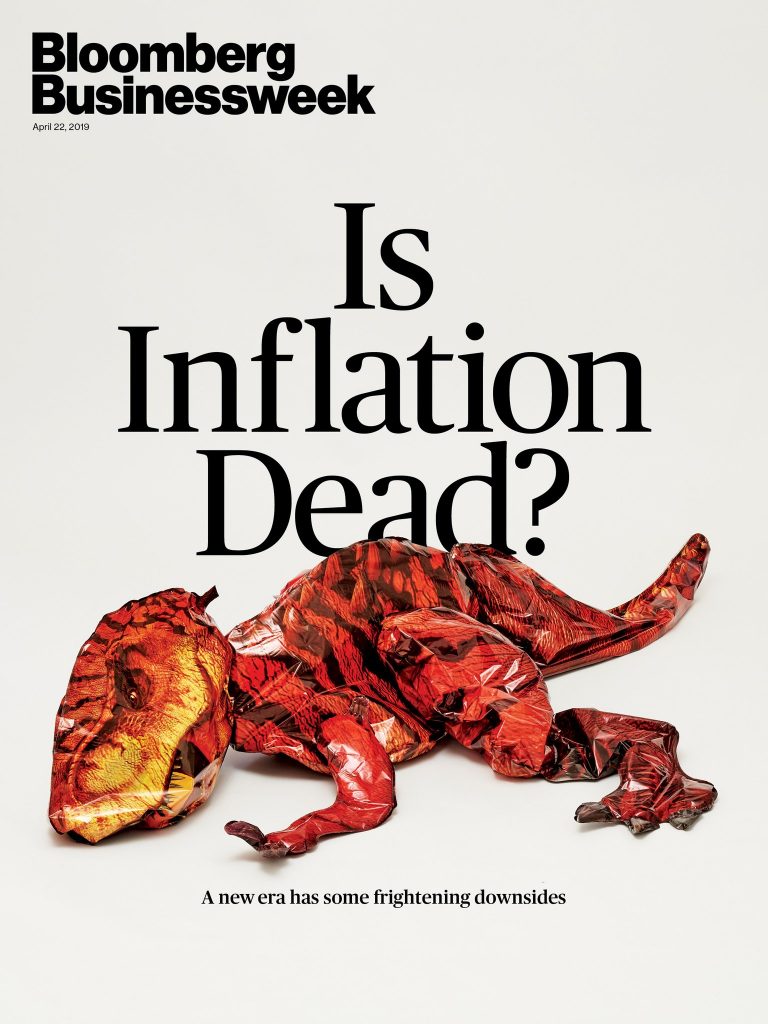

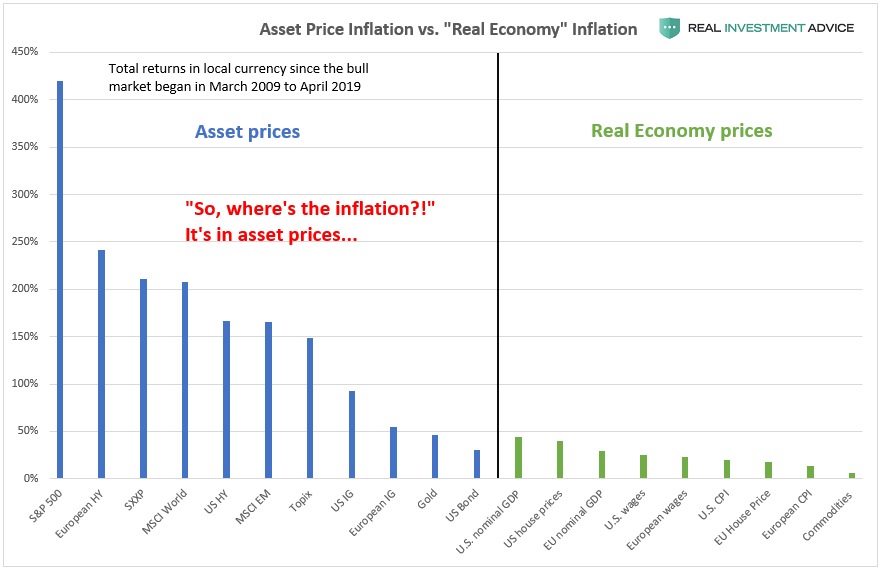

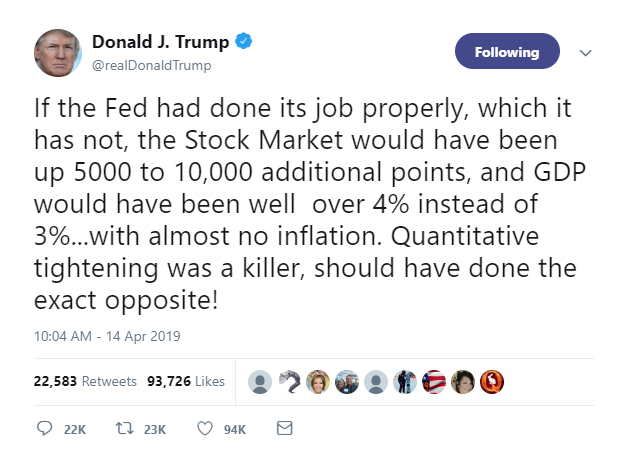
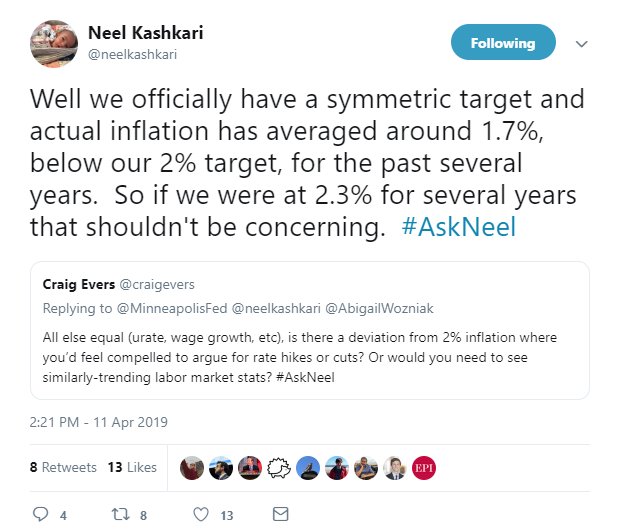
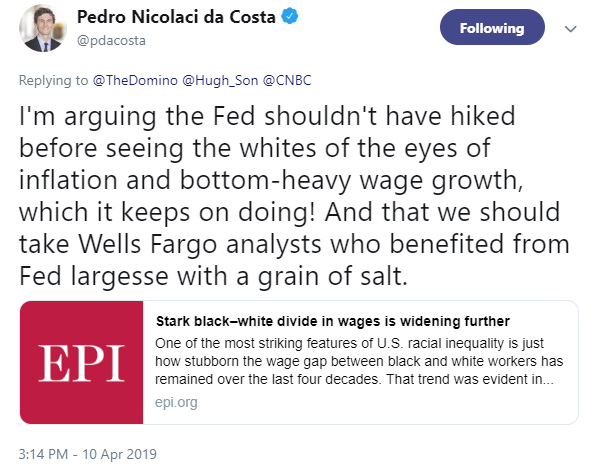
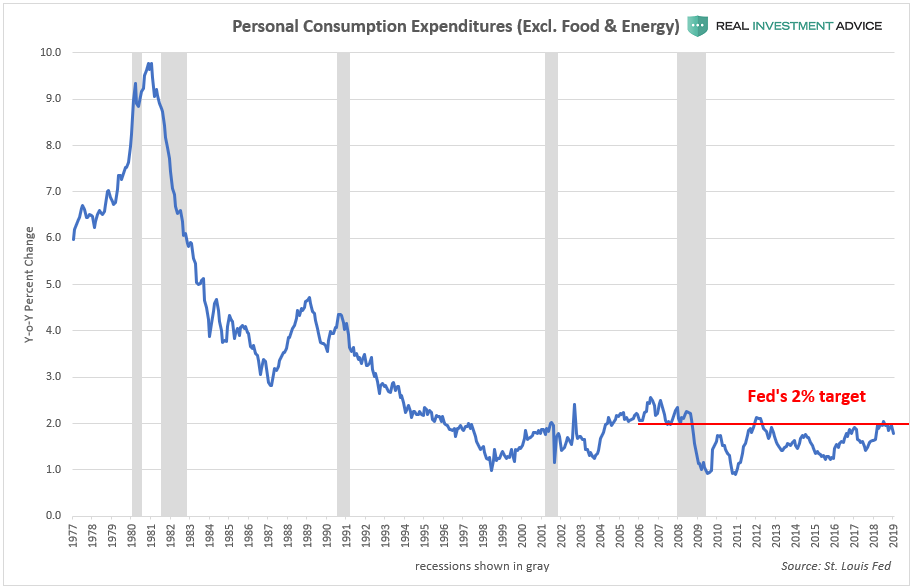
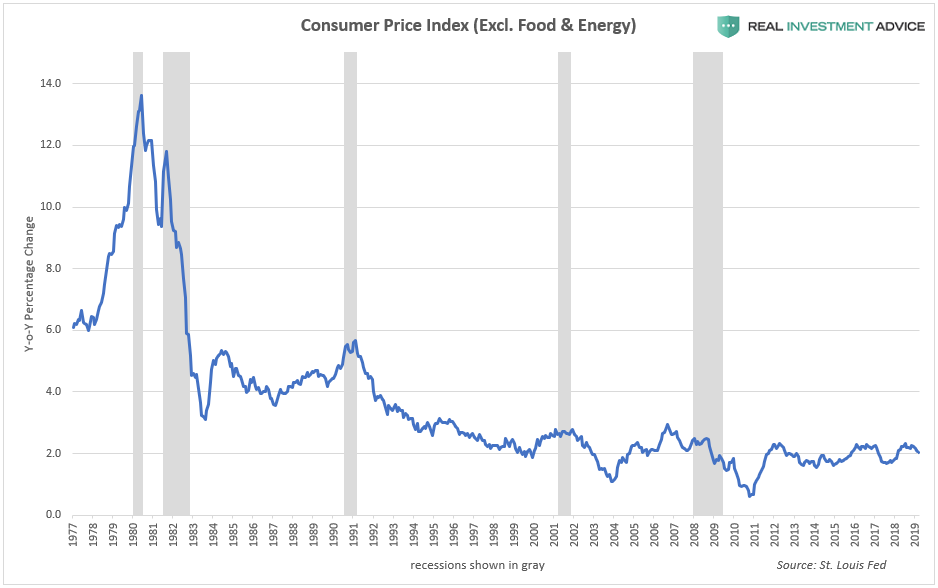
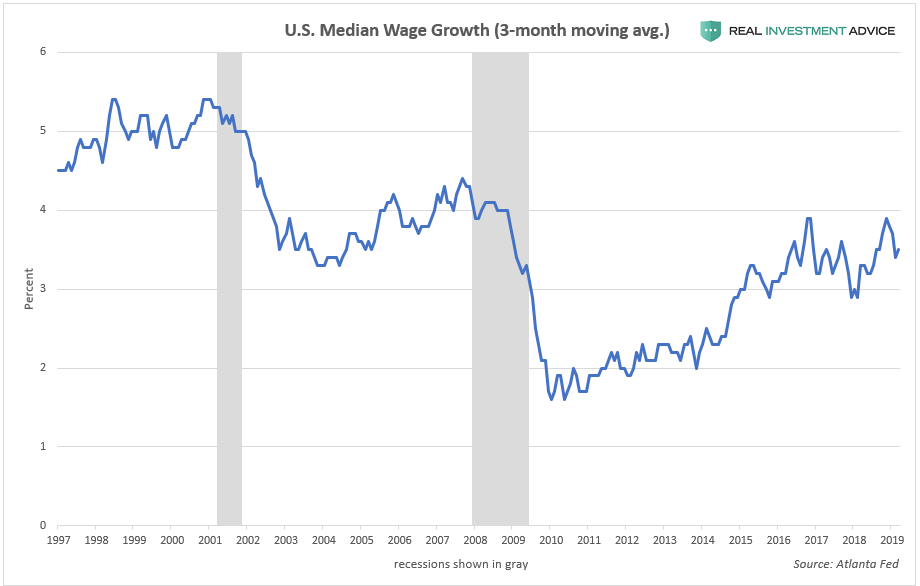


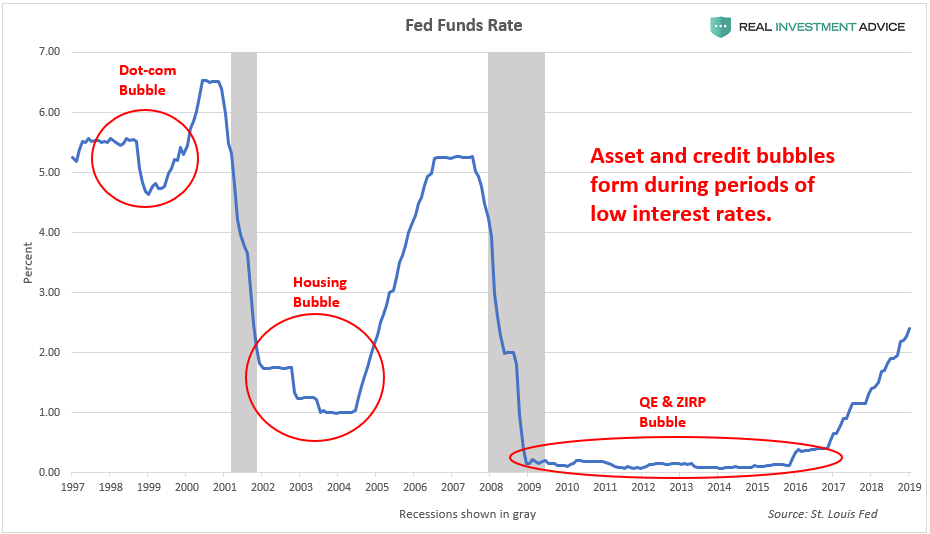
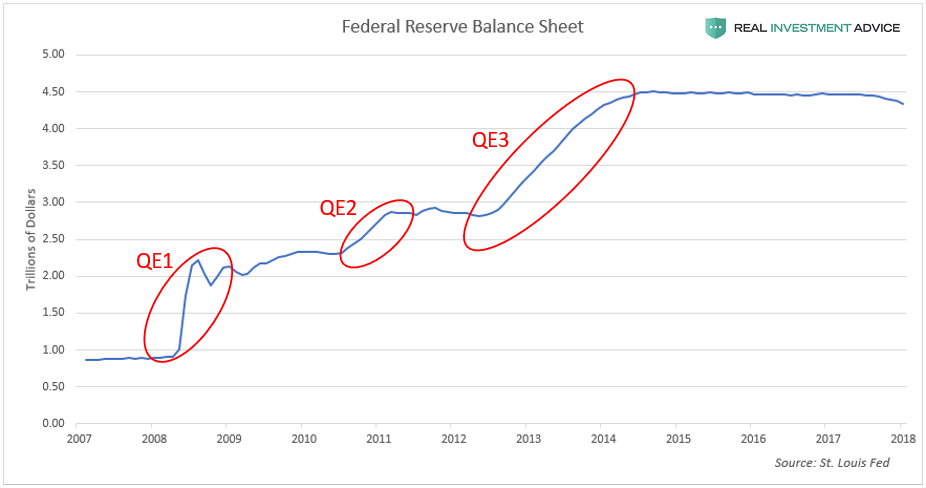
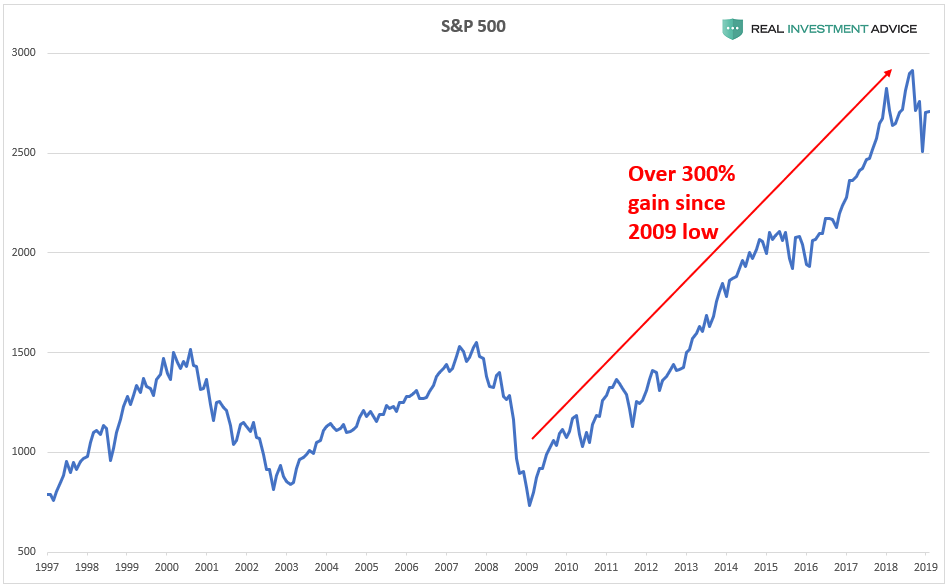
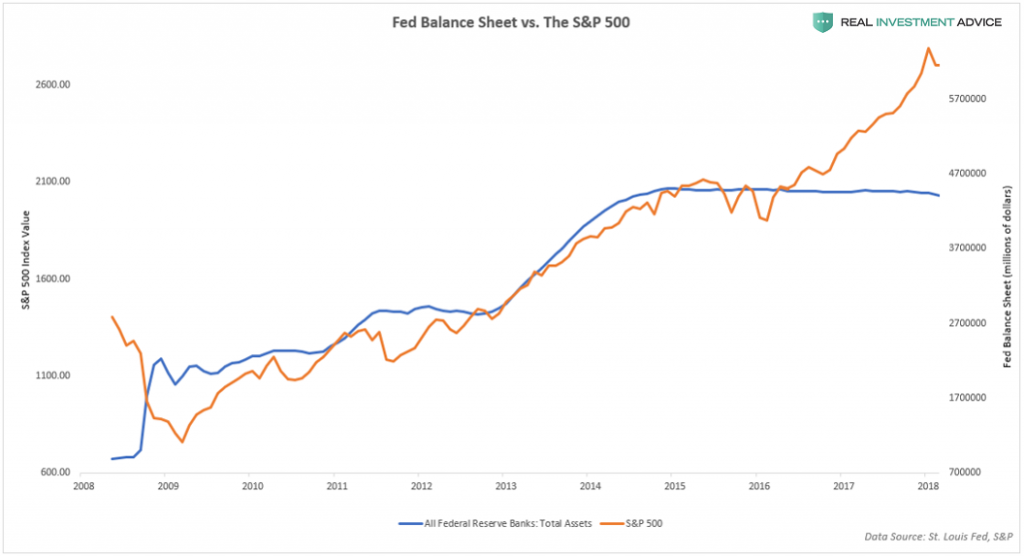

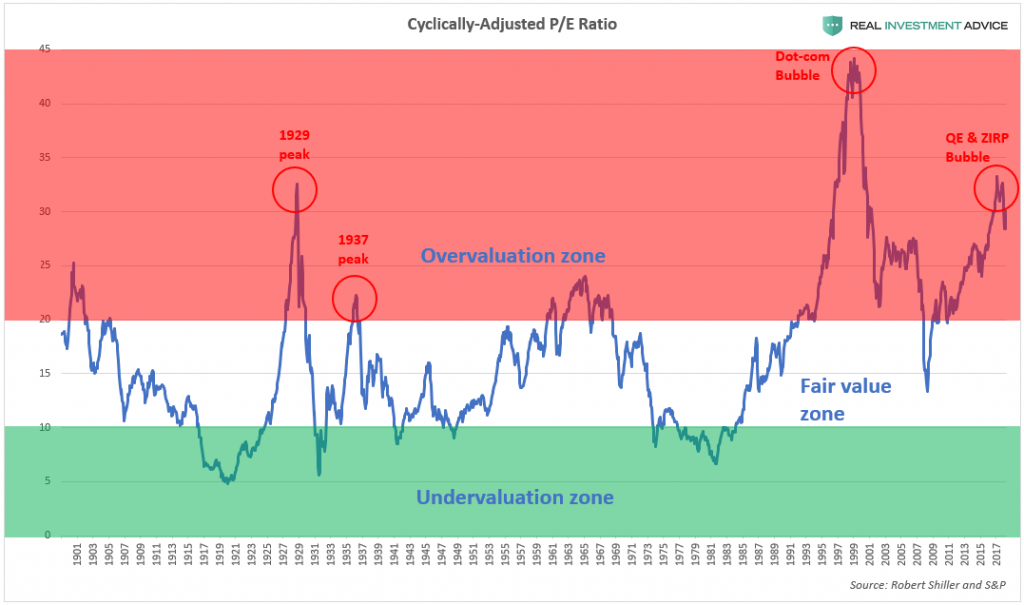
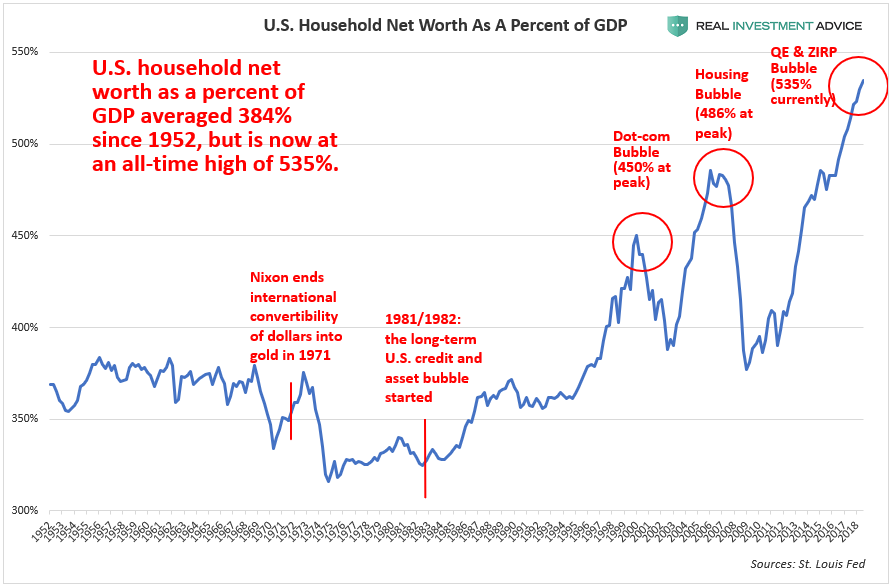
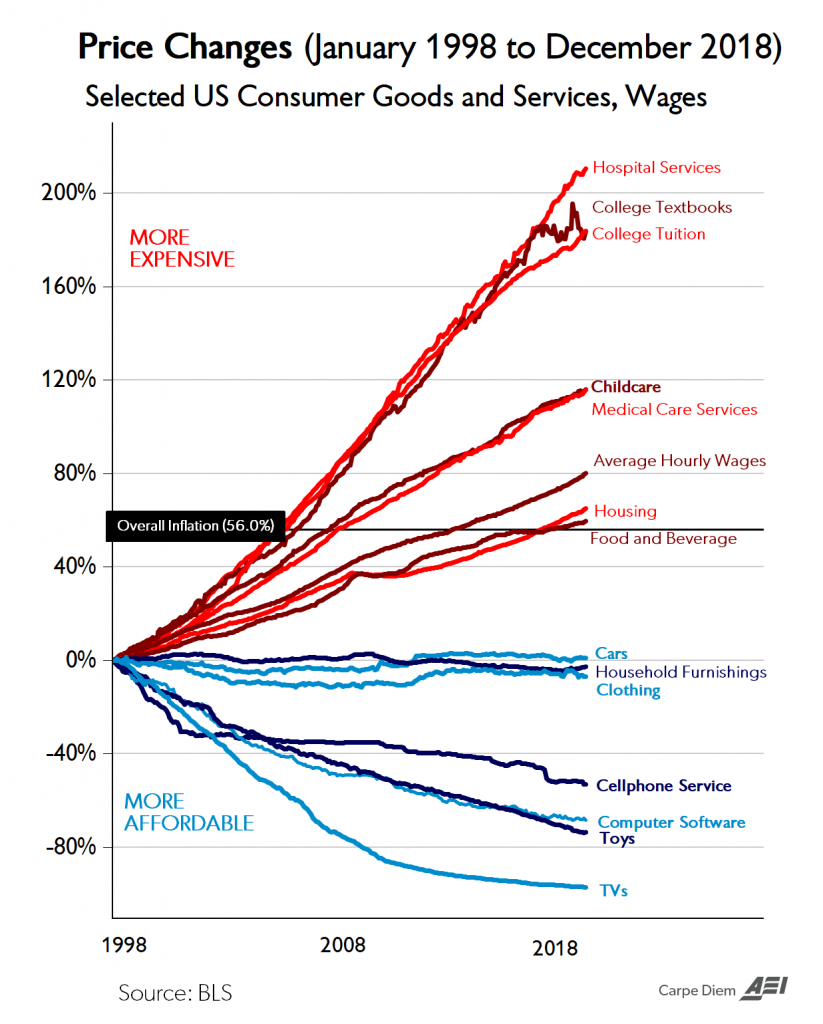

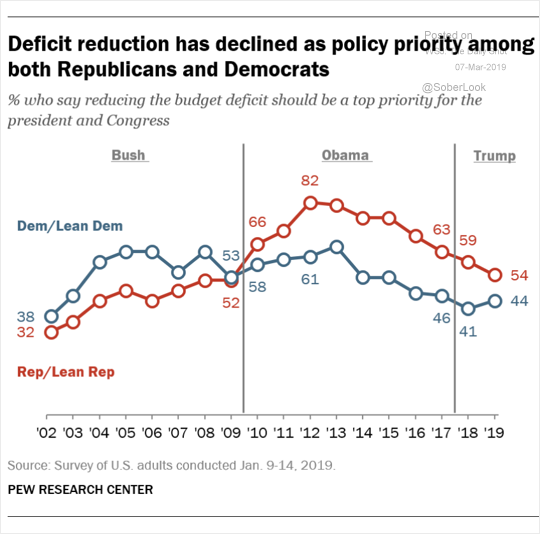
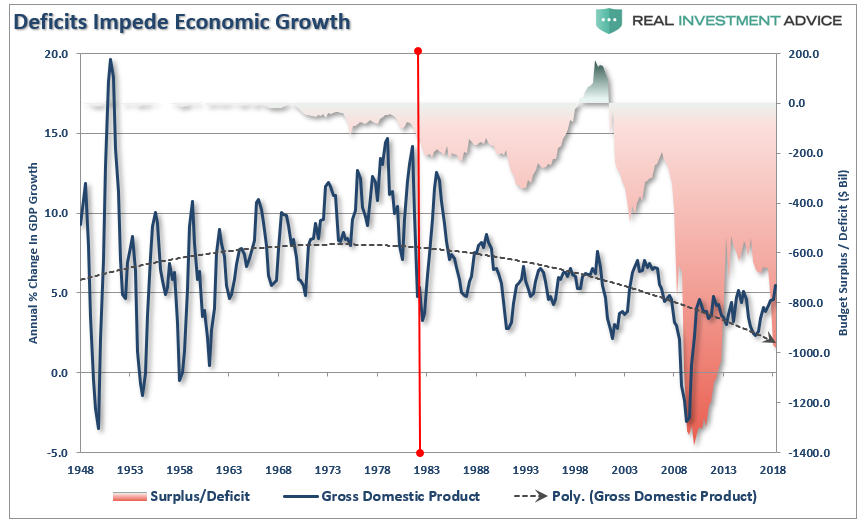

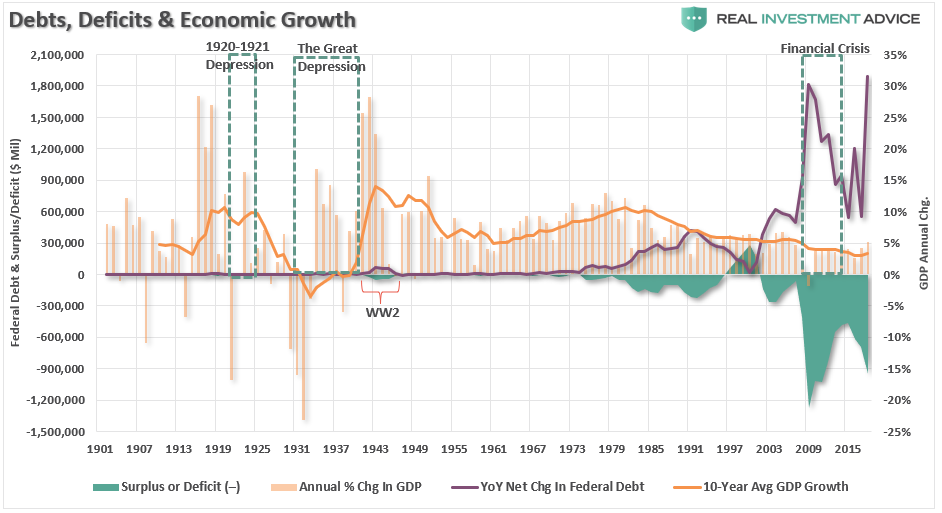
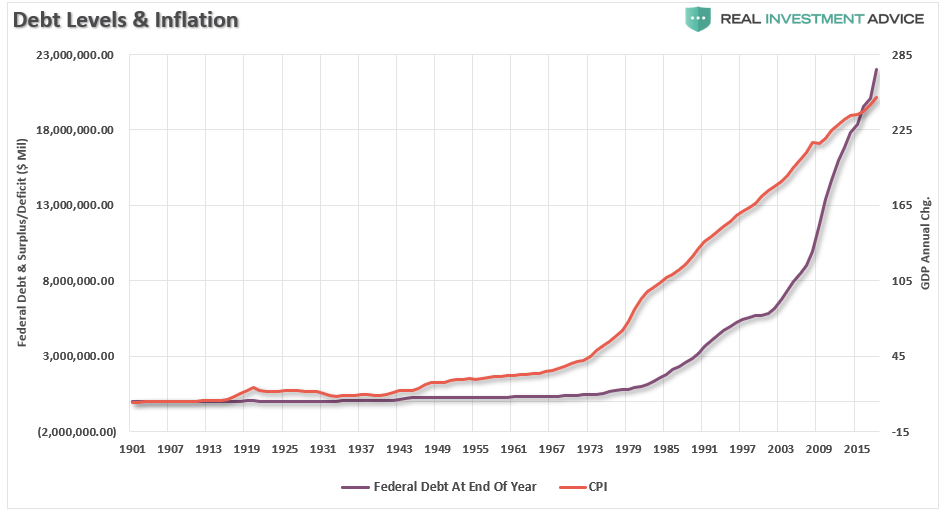
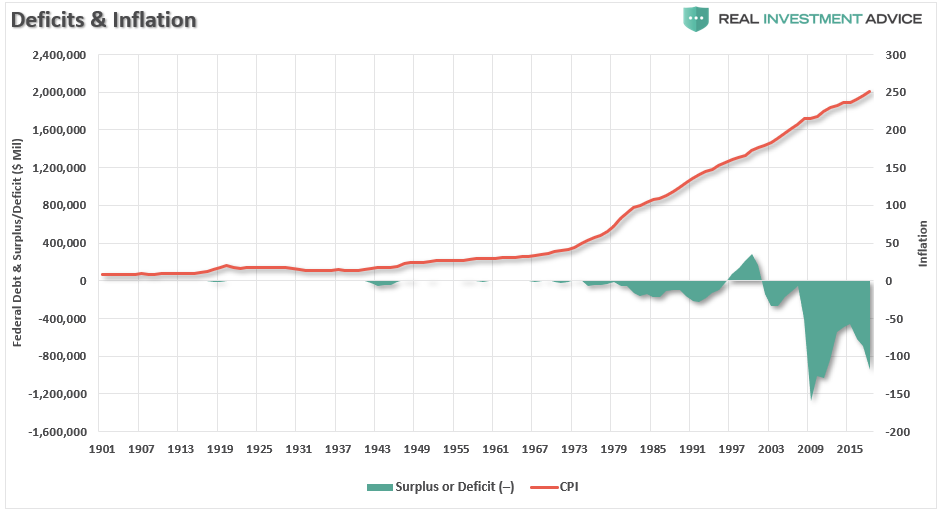
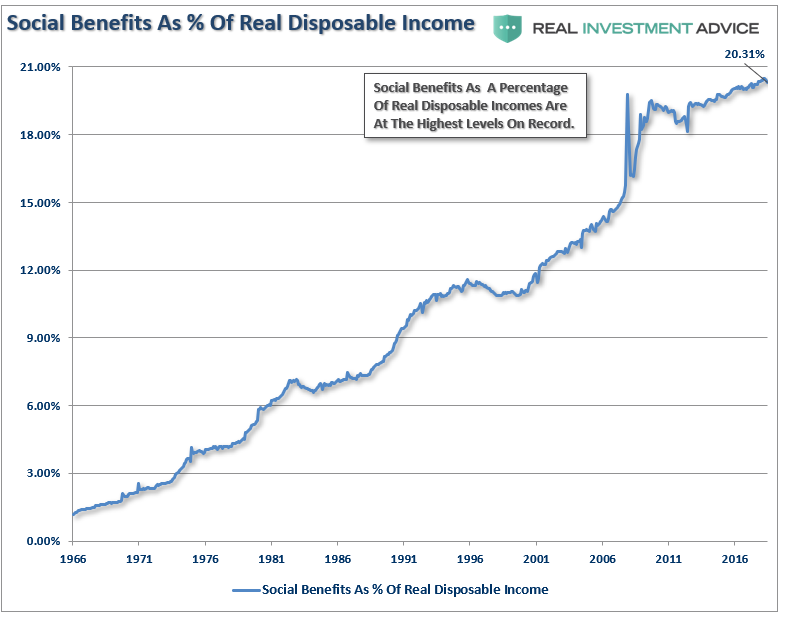
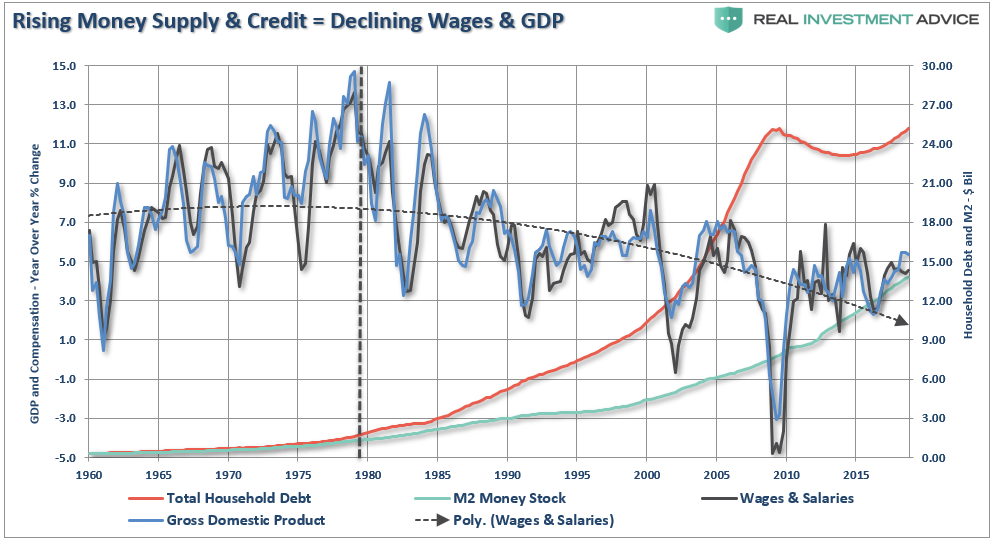
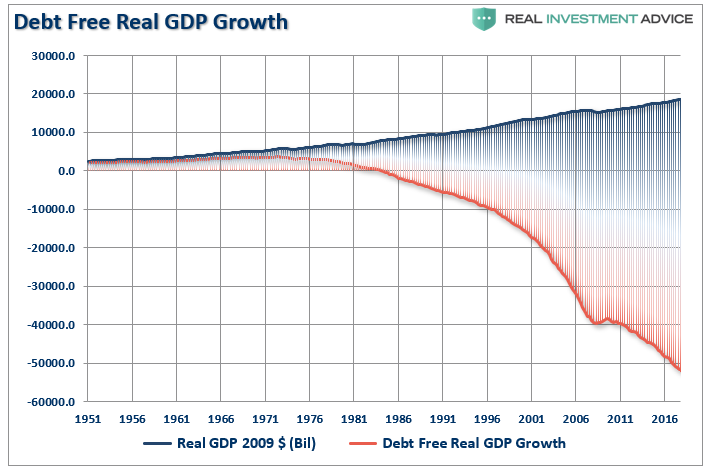


