Tag Archives: employment

Previous Employment Concerns Becoming An Ugly Reality

Last week, we saw the first glimpse of the employment fallout caused by the shutdown of the economy due to the virus. To wit:

“On Thursday, initial jobless claims jumped by 3.3 million. This was the single largest jump in claims ever on record. The chart below shows the 4-week average to give a better scale.”

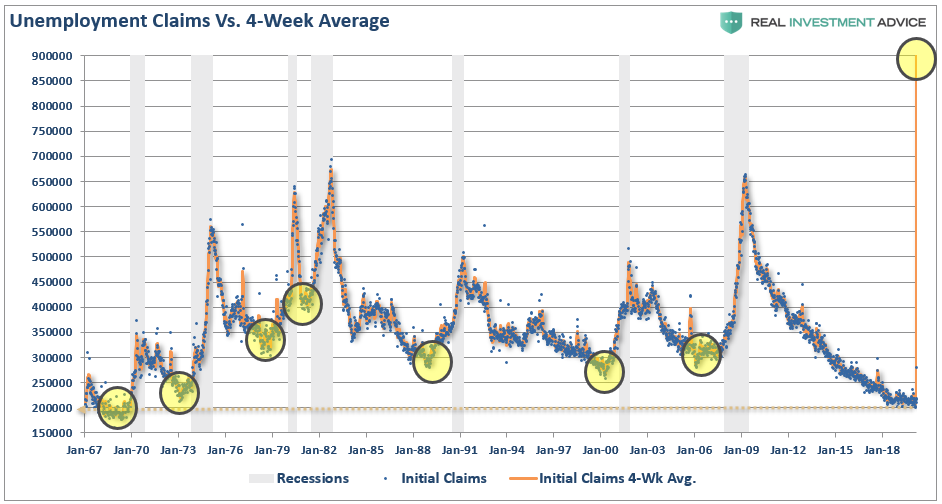
This number will be MUCH worse when claims are reported later this morning, as many individuals were slow to file claims, didn’t know how, and states were slow to report them.

The importance is that unemployment rates in the U.S. are about to spike to levels not seen since the “Great Depression.” Based on the number of claims being filed, we can estimate that unemployment will jump to 15-20% over the next quarter as economic growth slides 8%, or more. (I am probably overly optimistic.)

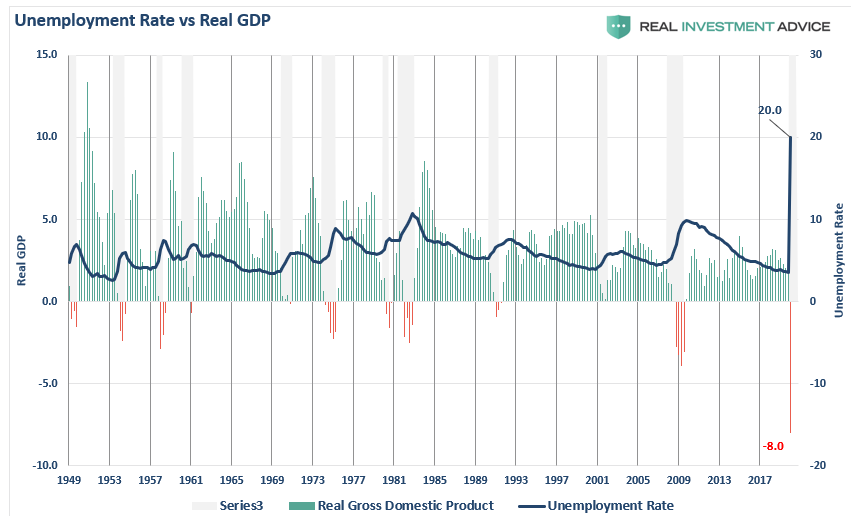
The erosion in employment will lead to a sharp deceleration in economic and consumer confidence, as was seen Tuesday in the release of the Conference Board’s consumer confidence index, which plunged from 132.6 to 120 in March.

This is a critical point. Consumer confidence is the primary factor of consumptive behaviors, which is why the Federal Reserve acted so quickly to inject liquidity into the financial markets. While the Fed’s actions may prop up financial markets in the short-term, it does little to affect the most significant factor weighing on consumers – their jobs.

The chart below is our “composite” confidence index, which combines several confidence surveys into one measure. Notice that during each of the previous two bear market cycles, confidence dropped by an average of 58 points.

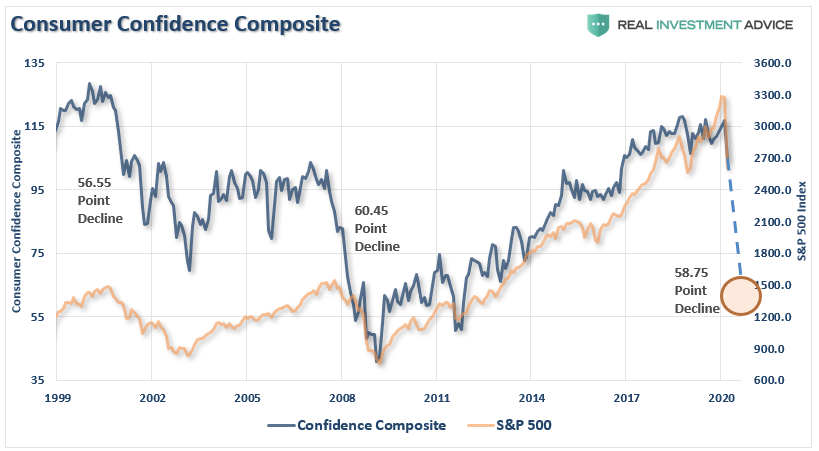
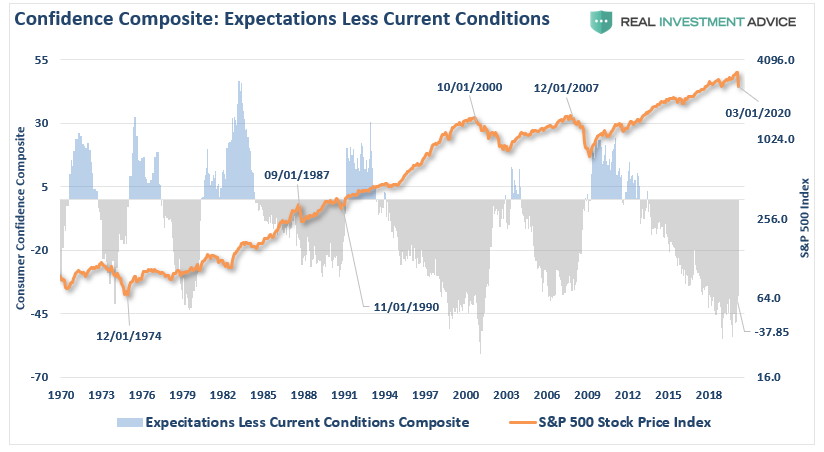
With consumer confidence just starting its reversion from high levels, it suggests that as job losses rise, confidence will slide further, putting further pressure on asset prices. Another way to analyze confidence data is to look at the composite consumer expectations index minus the current situation index in the reports.

Similarly, given we have only started the reversion process, bear markets end when deviations reverse. The differential between expectations and the current situation, as you can see below, is worse than the last cycle, and only slightly higher than before the “dot.com” crash.

If you are betting on a fast economic recovery, I wouldn’t.

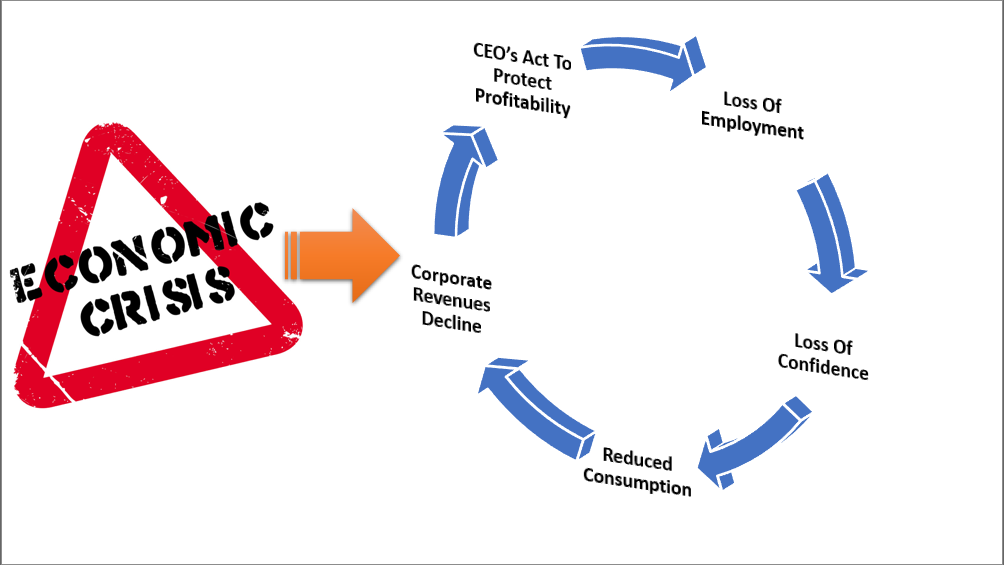
There is a fairly predictable cycle, starting with CEO’s moving to protect profitability, which gets worked through until exhaustion is reached.

As unemployment rises, we are going to begin to see the faults in the previous employment numbers that I have repeatedly warned about over the last 18-months. To wit:

“There is little argument the streak of employment growth is quite phenomenal and comes amid hopes the economy is beginning to shift into high gear. But while most economists focus at employment data from one month to the next for clues as to the strength of the economy, it is the ‘trend’ of the data, which is far more important to understand.”

That “trend” of employment data has been turning negative since President Trump was elected, which warned the economy was actually substantially weaker than headlines suggested. More than once, we warned that an “unexpected exogenous event” would exposure the soft-underbelly of the economy.

The virus was just such an event.

While many economists and media personalities are expecting a “V”-shaped recovery as soon as the virus passes, the employment data suggests an entirely different outcome.

The chart below shows the peak annual rate of change for employment prior to the onset of a recession. The current cycle peaked at 2.2% in 2015, and has been on a steady decline ever since. At 1.3%, which predated the virus, it was the lowest level ever preceding a recessionary event. All that was needed was an “event” to start the dominoes falling. When we see the first round of unemployment data, we are likely to test the lows seen during the financial crisis confirming a recession has started. 

No Recession In 2020?

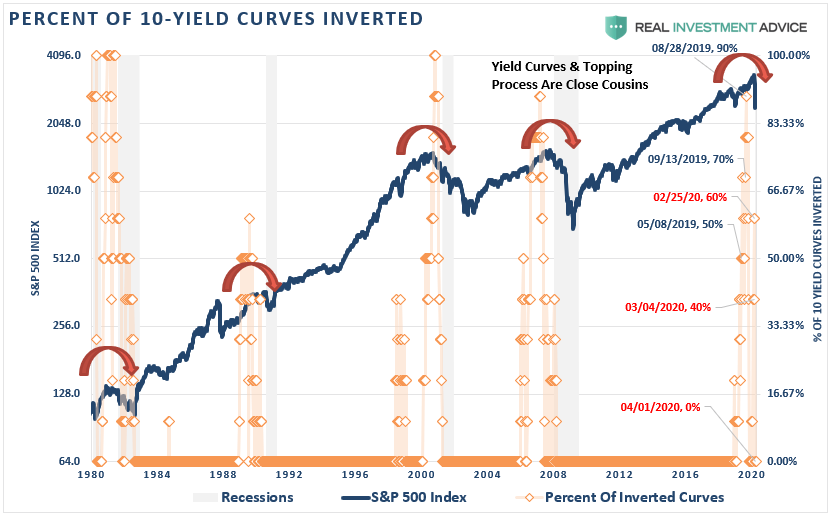
It is worth noting that NO mainstream economists, or mainstream media, were predicting a recession in 2020. However, as we noted in 2019, the inversion of the “yield curve,” predicted exactly that outcome.

“To CNBC’s point, based on this lagging, and currently unrevised, economic data, there is ‘NO recession in sight,’ so you should be long equities, right?

Which indicator should you follow? The yield curve is an easy answer.

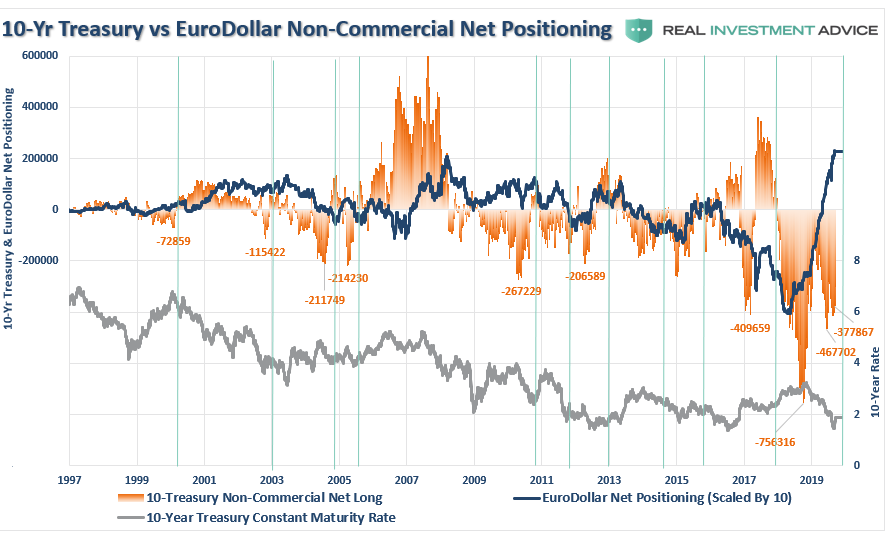
While everybody is ‘freaking out’ over the ‘inversion,’it is when the yield-curve ‘un-inverts’ that is the most important.

The chart below shows that when the Fed is aggressively cutting rates, the yield curve un-inverts as the short-end of the curve falls faster than the long-end. (This is because money is leaving ‘risk’ to seek the absolute ‘safety’ of money markets, i.e. ‘market crash.’)”

I have dated a few of the key points of the “inversion of the curve.” As of today, the yield-curve is now fully un-inverted, denoting a recession has started.

While recent employment reports were slightly above expectations, the annual rate of growth has been slowing. The 3-month average of the seasonally-adjusted employment report, also confirms that employment was already in a precarious position and too weak to absorb a significant shock. (The 3-month average smooths out some of the volatility.)

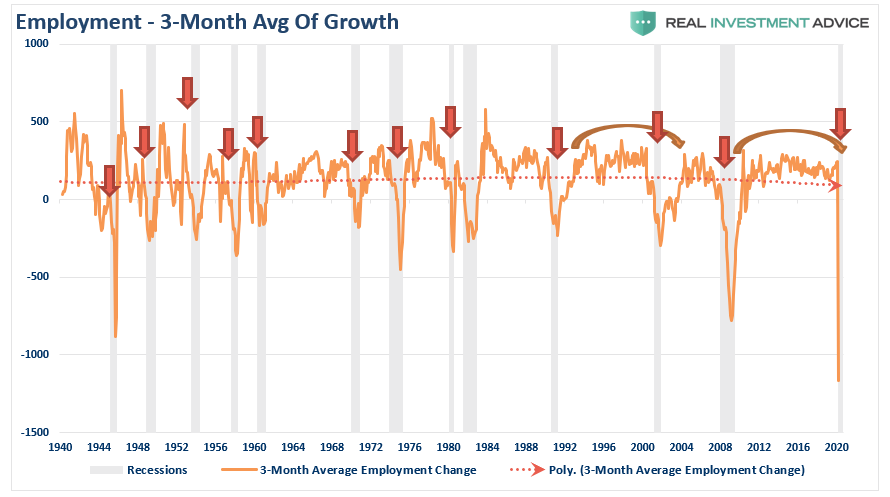
What we will see in the next several employment reports are vastly negative numbers as the economy unwinds.

Lastly, while the BLS continually adjusts and fiddles with the data to mathematically adjust for seasonal variations, the purpose of the entire process is to smooth volatile monthly data into a more normalized trend. The problem, of course, with manipulating data through mathematical adjustments, revisions, and tweaks, is the risk of contamination of bias.

We previously proposed a much simpler method to use for smoothing volatile monthly data using a 12-month moving average of the raw data as shown below.

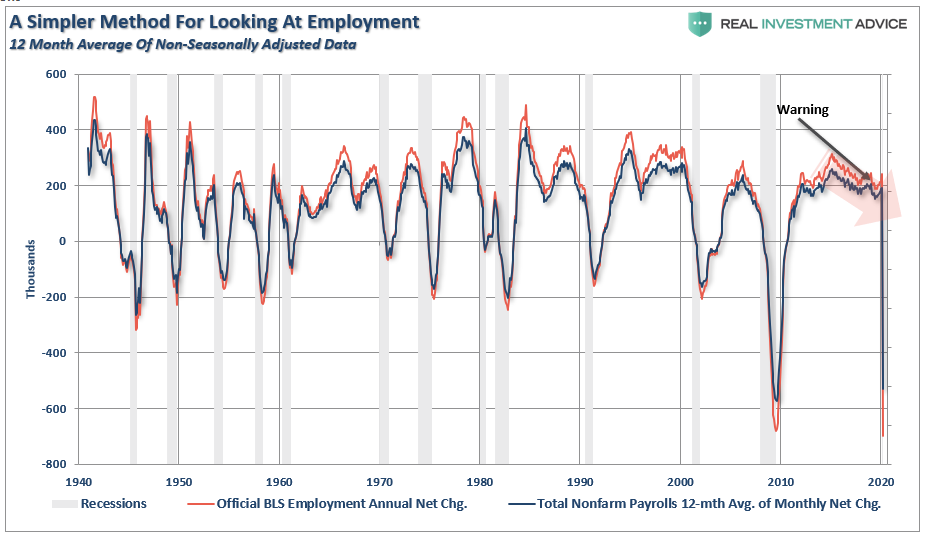
Notice that near peaks of employment cycles the BLS employment data deviates from the 12-month average, or rather “overstates” the reality. However, as we will now see to be the case, the BLS data will rapidly reconnect with 12-month average as reality emerges.

Sometimes, “simpler” gives us a better understanding of the data.

Importantly, there is one aspect to all the charts above which remains constant. No matter how you choose to look at the data, peaks in employment growth occur prior to economic contractions, rather than an acceleration of growth. 

“Okay Boomer”

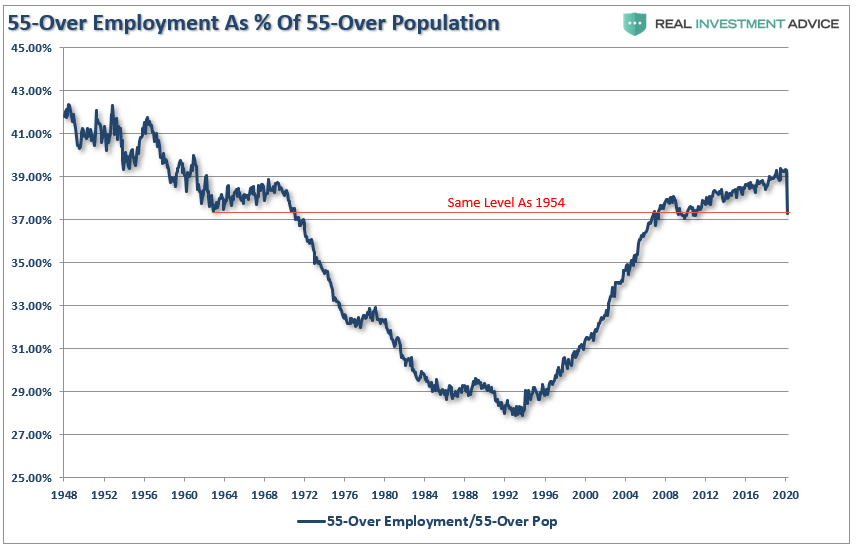
Just as “baby boomers” were finally getting back to the position of being able to retire following the 2008 crash, the “bear market” has once again put those dreams on hold. Of course, there were already more individuals over the age of 55, as a percentage of that age group, in the workforce than at anytime in the last 50-years. However, we are likely going to see a very sharp drop in those numbers as “forced retirement” will surge.

The group that will to be hit the hardest are those between 25-54 years of age. With more than 15-million restaurant workers being terminated, along with retail, clerical, leisure, and hospitality workers, the damage to this demographic will be the heaviest.

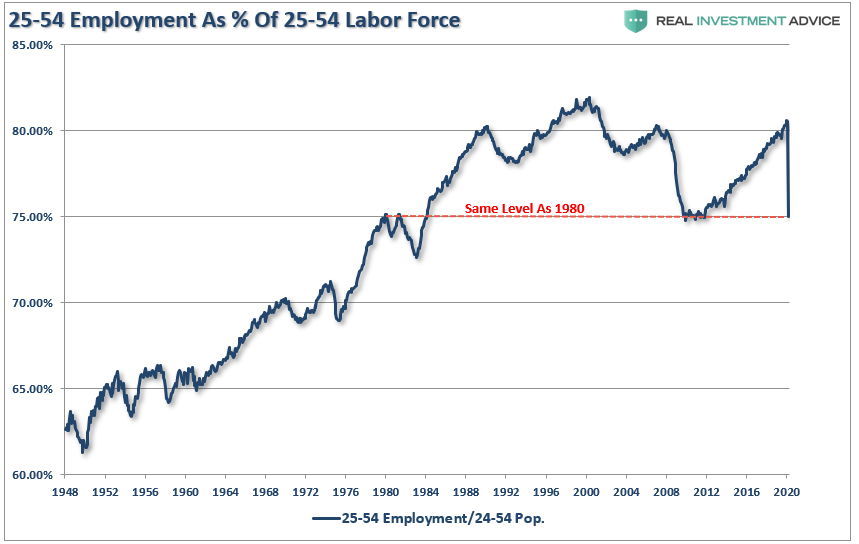
There is a decent correlation between surges in the unemployment rate and the decline in the labor-force participation rate of the 25-54 age group. Given the expectation of a 15%, or greater, unemployment rate, the damage to this particular age group is going to be significant.

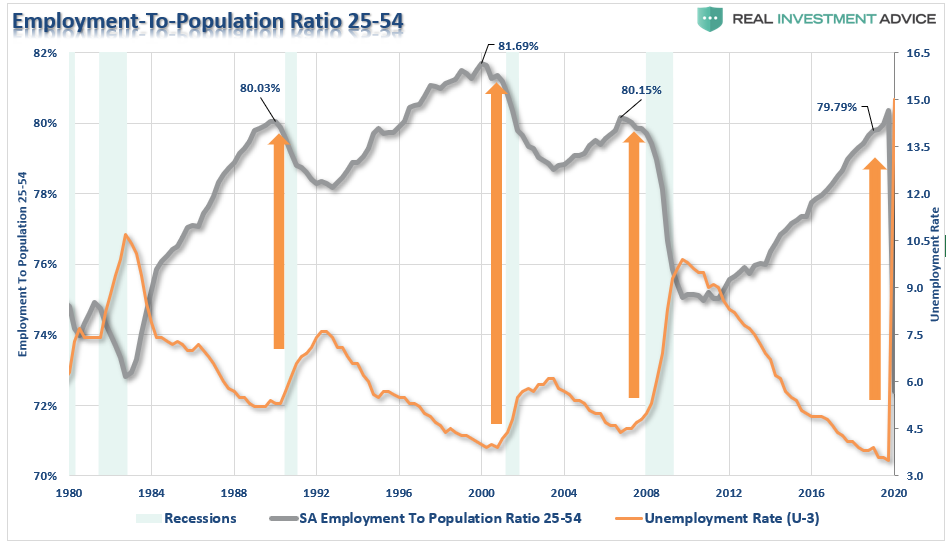
Unfortunately, the prime working-age group of labor force participants had only just returned to pre-2008 levels, and the same levels seen previously in 1988. Unfortunately, it may be another decade before we see those employment levels again.

Why This Matters

The employment impact is going to felt for far longer, and will be far deeper, than the majority of the mainstream media and economists expect. This is because they are still viewing this as a “singular” problem of a transitory virus.

It isn’t.

The virus was simply the catalyst which started the unwind of a decade-long period of debt accumulation and speculative excesses. Businesses, both small and large, will now go through a period of “culling the herd,” to lower operating costs and maintain profitability.

There are many businesses that will close, and never reopen. Most others will cut employment down to the bone and will be very slow to rehire as the economy begins to recover. Most importantly, wage growth was already on the decline, and will be cut deeply in the months to come.

Lower wage growth, unemployment, and a collapse in consumer confidence is going to increase the depth and duration of the recession over the months to come. The contraction in consumption will further reduce revenues and earnings for businesses which will require a deeper revaluation of asset prices. 

I just want to leave you with a statement I made previously:

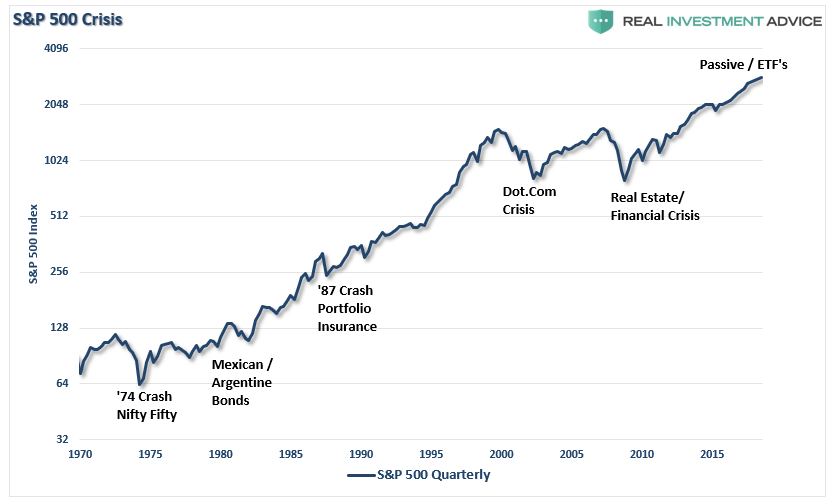
“Every financial crisis, market upheaval, major correction, recession, etc. all came from one thing – an exogenous event that was not forecast or expected.

This is why bear markets are always vicious, brutal, devastating, and fast. It is the exogenous event, usually credit-related, which sucks the liquidity out of the market, causing prices to plunge. As prices fall, investors begin to panic-sell driving prices lower which forces more selling in the market until, ultimately, sellers are exhausted.

It is the same every time.”

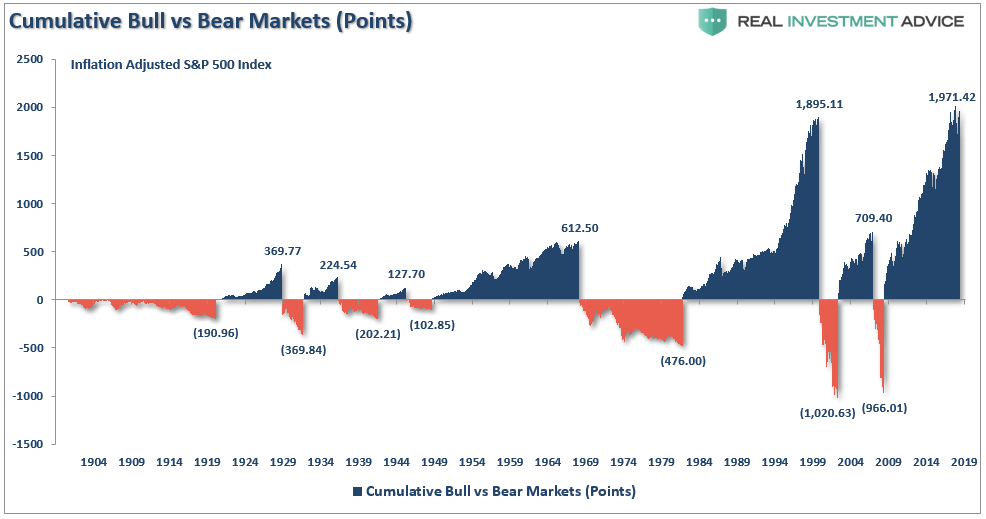
Over the last several years, investors have insisted the markets were NOT in a bubble. We reminded them that everyone thought the same in 1999 and 2007.

Throughout history, financial bubbles have only been recognized in hindsight when their existence becomes “apparently obvious” to everyone. Of course, by that point is was far too late to be of any use to investors and the subsequent destruction of invested capital.

It turned out, “this time indeed was not different.” Only the catalyst, magnitude, and duration was.

Pay attention to employment and wages. The data suggests the current “bear market” cycle has only just begun.

Shedlock: Recession Will Be Deeper Than The Great Financial Crisis

Economists at IHS Markit downgraded their economic forecast to a deep recession.

Please consider COVID-19 Recession to be Deeper Than That of 2008-2009

Our interim global forecast is the second prepared in March and is much more pessimistic than our 17 March regularly scheduled outlook. It is based on major downgrades to forecasts of the US economy and oil prices. The risks remain overwhelmingly on the downside and further downgrades are almost assured.

IHS Markit now believes the COVID-19 recession will be deeper than the one following the global financial crisis in 2008-09. Real world GDP should plunge 2.8% in 2020 compared with a drop of 1.7% in 2009. Many key economies will see double-digit declines (at annualized rates) in the second quarter, with the contraction continuing into the third quarter.

It will likely take two to three years for most economies to return to their pre-pandemic levels of output. More troubling is the likelihood that, because of the negative effects of the uncertainty associated with the virus on capital spending, the path of potential GDP will be lower than before. This happened in the wake of the global financial crisis.

Six Key Points

  1. Based on recent data and developments, IHS Markit has slashed the US 2020 forecast to a contraction of 5.4%.
  2. Because of the deep US recession and collapsing oil prices, IHS Markit expects Canada’s economy to contract 3.3% this year, before seeing a modest recovery in 2021.
  3. Europe, where the number of cases continues to grow rapidly and lockdowns are pervasive, will see some of the worst recessions in the developed world, with 2020 real GDP drops of approximately 4.5% in the eurozone and UK economies. Italy faces a decline of 6% or more. The peak GDP contractions expected in the second quarter of 2020 will far exceed those at the height of the global financial crisis.
  4. Japan was already in recession, before the pandemic. The postponement of the summer Tokyo Olympics will make the downturn even deeper. IHS Markit expects a real GDP contraction of 2.5% this year and a very weak recovery next year.
  5. China’s economic activity is expected to have plummeted at a near-double-digit rate in the first quarter. It will then recover sooner than other countries, where the spread of the virus has occurred later. IHS Markit predicts growth of just 2.0% in 2020, followed by a stronger-than-average rebound in 2021, because of its earlier recovery from the pandemic.
  6. Emerging markets growth will also be hammered. Not only are infection rates rising rapidly in key economies, such as India, but the combination of the deepest global recession since the 1930s, plunging commodity prices, and depreciating currencies (compounding already dangerous debt burdens) will push many of these economies to the breaking point.

No V-Shaped Recovery

With that, Markit came around to my point of view all along. Those expecting a V-shaped recovery are sadly mistaken.

I have been amused by Goldman Sachs and Morgan Stanley predictions of a strong rebound in the third quarter.

For example Goldman Projects a Catastrophic GDP Decline Worse than Great Depression followed by a fantasyland recovery.

  • Other GDP Estimates
  • Delusional Forecast
  • Advice Ignored by Trump
  • Fast Rebound Fantasies

I do not get these fast rebound fantasies, and neither does Jim Bianco. He retweeted a Goldman Sachs estimate which is not the same as endorsing it.

I do not know how deep this gets, but the rebound will not be quick, no matter what.

Fictional Reserve Lending

Please note that Fictional Reserve Lending Is the New Official Policy

The Fed officially cut reserve requirements of banks to zero in a desperate attempt to spur lending.

It won’t help. As I explain, bank reserves were effectively zero long ago.

US Output Drops at Fastest Rate in a Decade

Meanwhile US Output Drops at Fastest Rate in a Decade

In Europe, we see Largest Collapse in Eurozone Business Activity Ever.

Lies From China

If you believe the lies (I don’t), China is allegedly recovered.

OK, precisely who will China be delivering the goods to? Demand in the US, Eurozone, and rest of the world has collapse.

We have gone from praying China will soon start delivering goods to not wanting them even if China can produce them.

Nothing is Working Now: What’s Next for America?

On March 23, I wrote Nothing is Working Now: What’s Next for America?

I noted 20 “What’s Next?” things.

It’s a list of projections from an excellent must see video presentation by Jim Bianco. I added my own thoughts on the key points.

The bottom line is don’t expect a v-shaped recovery. We will not return to the old way of doing business.

Globalization is not over, but the rush to globalize everything is. This will impact earnings for years to come.

Finally, stimulus checks are on the way, but there will be no quick return to buying cars, eating out, or traveling as much.

Boomers who felt they finally had enough retirement money just had a quarter of it or more wiped out.

It will take a long time, if ever, for the same sentiment to return. Spending will not recover. Boomers will die first, and they are the ones with the most money.

Shedlock: Fed Trying To Save The Bond Market As Unemployment Explodes

Bond market volatility remains a sight to behold, even at the low end of the curve.

Bond Market Dislocations Remain

The yield on a 3-month T-Bill fell to 1.3 basis points then surged to 16.8 basis points in a matter of hours. The yield then quickly crashed to 3 basis points and now sits at 5.1 basis points.

The Fed is struggling even with the low end of the Treasury curve.

$IRX 3-Month Yield

Stockcharts shows the 3-month yield ($IRX) dipping below zero but Investing.Com does not show the yield went below zero.

Regardless, these swings are not normal.

Cash Crunch

Bloomberg reports All the Signs a Cash Crunch Is Gripping Markets and the Economy

In a crisis, it is said, all correlations go to one. Threats get so overwhelming that everything reacts in unison. And the common thread running through all facets of financial markets and the real economy right now is simple: a global cash crunch of epic proportions.

Investors piled $137 billion into cash-like assets in the five days ending March 11, according to a Bank of America report citing EPFR Global data. Its monthly fund manager survey showed the fourth-largest monthly jump in allocations to cash ever, from 4% to 5.1%.

“Cash has become the king as the short-term government funds have had massive deposits, with ~$13 billion inflows last week (a 10-standard deviation move),” adds Maneesh Dehspande, head of equity derivatives strategy at Barclays.

4th Largest Jump in History

It’s quite telling that a jump of a mere 1.1 percentage point to 5.1% cash is the 4th largest cash jump in history.

Margin and Short Covering

“In aggregate, the market saw a large outflow, with $9 billion of long liquidation and $6 billion of short covering,” said Michael Haigh, global head of commodity research at Societe Generale. “This general and non-directional closure of money manager positions could be explained by a need for cash to pay margin calls on other derivatives contracts.

The comment is somewhat inaccurate. Sideline cash did not change “in aggregate” although cash balances t various fund managers did.

This is what happens when leveraged longs get a trillion dollar derivatives margin call or whatever the heck it was.

Need a Better Hedge

With the S&P 500 down more than 12% in the five sessions ending March 17, the Japanese yen is weaker against the greenback, the 10-year Treasury future is down, and gold is too.

That’s another sign dollars are top of mind, and investors are selling not only what they want to, but also what they have to.

Dash to Cash

It’s one thing to see exchange-traded products stuffed full of relatively illiquid corporate bonds trade below the purported sum of the value of their holdings. It’s quite another to see such a massive discount develop in a more plain-vanilla product like the Vanguard Total Bond Market ETF (BND) as investors ditched the product to raise cash despite not quite getting their money’s worth.

The fund closed Tuesday at a discount of nearly 2% to its net asset value, which blew out to above 6% last week amid accelerating, record outflows. That exceeded its prior record discount from 2008.

It is impossible for everyone to go to cash at the same time.

Someone must hold every stock, every bond and every dollar.

Fed Opens More Dollar Swap Lines

Moments ago Reuters reported Fed Opens Dollar Swap Lines for Nine Additional Foreign Central Banks.

The Fed said the swaps, in which the Fed accepts other currencies in exchange for dollars, will for at least the next six months allow the central banks of Australia, Brazil, South Korea, Mexico, Singapore, Sweden, Denmark, Norway and New Zealand to tap up to a combined total of $450 billion, money to ensure the world’s dollar-dependent financial system continues to function.

The new swap lines “like those already established between the Federal Reserve and other central banks, are designed to help lessen strains in global U.S. dollar funding markets, thereby mitigating the effects of these strains on the supply of credit to households and businesses, both domestically and abroad,” the Fed said in a statement.

The central banks of South Korea, Singapore, Mexico and Sweden all said in separate statements they intended to use them.

Fed Does Another Emergency Repo and Relaunches Commercial Paper Facility

Yesterday I commented Fed Does Another Emergency Repo and Relaunches Commercial Paper Facility

Very Deflationary Outcome Has Begun: Blame the Fed

The Fed is struggling mightily to alleviate the mess it is largely responsible for.

I previously commented a Very Deflationary Outcome Has Begun: Blame the Fed

The Fed blew three economic bubbles in succession. A deflationary bust has started. They blew bubbles trying to prevent “deflation” defined as falling consumer prices.


BIS Deflation Study

The BIS did a historical study and found routine price deflation was not any problem at all.

“Deflation may actually boost output. Lower prices increase real incomes and wealth. And they may also make export goods more competitive,” stated the BIS study.

For a discussion of the study, please see Historical Perspective on CPI Deflations: How Damaging are They?

Deflation is not really about prices. It’s about the value of debt on the books of banks that cannot be paid back by zombie corporations and individuals.

Blowing bubbles in absurd attempts to arrest “price deflation” is crazy. The bigger the bubbles the bigger the resultant “asset bubble deflation”. Falling consumer prices do not have severe negative repercussions. Asset bubble deflations are another matter.

Assessing the Blame

Central banks are not responsible for the coronavirus. But they are responsible for blowing economic bubbles prone to crash.

The equities bubbles before the coronavirus hit were the largest on record.

Dollar Irony

The irony in this madness is the US will be printing the most currency and have the biggest budget deficits as a result. Yet central banks can’t seem to get enough dollars. In that aspect, the dollar ought to be sinking.

But given the US 10-year Treasury yield at 1.126% is among the highest in the world, why not exchange everything one can for dollars earning positive yield.

This is all such circular madness, it’s hard to say when or how it ends.

Unemployment Set To Explode

A SurveyUSA poll reveals 9% of the US is out of a job due to the coronavirus.

Please consider the Results of SurveyUSA Coronavirus News Poll.

Key Findings

  1. 9% of Working Americans (14 Million) So Far Have Been Laid Off As Result of Coronavirus; 1 in 4 Workers Have Had Their Hours Reduced;
  2. 2% Have Been Fired; 20% Have Postponed a Business Trip; Shock Waves Just Now Beginning to Ripple Through Once-Roaring US Economy:
  3. Early markers on the road from recession to depression as the Coronavirus threatens to stop the world from spinning on its axis show that 1 in 4 working Americans have had their hours reduced as a result of COVID-19, according to SurveyUSA’s latest time-series tracking poll conducted 03/18/20 and 03/19/20.
  4. Approximately 160 million Americans were employed in the robust Trump economy 2 months ago. If 26% have had their hours reduced, that translates to 41 million Americans who this week will take home less money than last, twice as many as SurveyUSA found in an identical poll 1 week ago. Time-series tracking graphs available here.
  5. 9% of working Americans, or 14 million of your friends and neighbors, will take home no paycheck this week, because they were laid off, up from 1% in an identical SurveyUSA poll 1 week ago. Time-series tracking graphs available here.
  6. Unlike those laid-off workers who have some hope of being recalled once the worst of the virus has past, 2% of Americans say they have lost their jobs altogether as a result of the virus, up from 1% last week.
  7. Of working Americans, 26% are working from home either some days or every day, up from 17% last week. A majority, 56%, no longer go to their place of employment, which means they are not spending money on gasoline or transit tokens.

About: SurveyUSA interviewed 1,000 USA adults nationwide 03/18/20 through 03/19/20. Of the adults, approximately 60% were, before the virus, employed full-time or part-time outside of the home and were asked the layoff and reduced-hours questions. Approximately half of the interviews for this survey were completed before the Big 3 Detroit automakers announced they were shutting down their Michigan assembly lines. For most Americans, events continue to unfold faster than a human mind is able to process the consequences.

Grim Survey of Reduced Hours

Current Unemployment Stats

Data from latest BLS Jobs Report.

If we assume the SurveyUSA numbers are accurate and will not get worse, we can arrive at some U3 and U6 unemployment estimates.

Baseline Unemployment Estimate (U3)

  • Unemployed: 5.787 million + 14 million = 19.787 million unemployed
  • Civilian Labor Force: 164.546 million (unchanged)
  • Unemployment Rate: 19.787 / 164.546 = 12.0%

That puts my off the top of the head 15.0% estimate a few days in the ballpark.

Underemployment Estimate (U6)

  • Employed: 158.759 million.
  • 26% have hours reduced = 41.277 million
  • Part Time for Economic Reasons: 4.318 million + 41.277 million = 45.595 million underemployed
  • 45.595 million underemployed + 19.787 million unemployed = 65.382 million
  • Civilian Labor Force: 164.546 million (unchanged)
  • U6 Unemployment Rate: 65.382 / 164.546 = 39.7%

Whoa Nellie

Wow, that’s not a recession. A depression is the only word.

Note that economists coined a new word “recession” after the 1929 crash and stopped using the word depression assuming it would never happen again.

Prior to 1929 every economic slowdown was called a depression. So if you give credit to the Fed for halting depressions, they haven’t. Ity’s just a matter of semantics.

Depression is a very fitting word if those numbers are even close to what’s going to happen.

Meanwhile, It’s no wonder the Fed Still Struggles to Get a Grip on the Bond Market and there is a struggled “Dash to Cash”.

Very Deflationary Outcome Has Begun: Blame the Fed

The Fed is struggling mightily to alleviate the mess it is largely responsible for.

I previously commented a Very Deflationary Outcome Has Begun: Blame the Fed

The Fed blew three economic bubbles in succession. A deflationary bust has started. They blew bubbles trying to prevent “deflation” defined as falling consumer prices.

BIS Deflation Study

The BIS did a historical study and found routine price deflation was not any problem at all.

“Deflation may actually boost output. Lower prices increase real incomes and wealth. And they may also make export goods more competitive,” stated the BIS study.

For a discussion of the study, please see Historical Perspective on CPI Deflations: How Damaging are They?

Deflation is not really about prices. It’s about the value of debt on the books of banks that cannot be paid back by zombie corporations and individuals.

Blowing bubbles in absurd attempts to arrest “price deflation” is crazy. The bigger the bubbles the bigger the resultant “asset bubble deflation”. Falling consumer prices do not have severe negative repercussions. Asset bubble deflations are another matter.

Assessing the Blame

Central banks are not responsible for the coronavirus. But they are responsible for blowing economic bubbles prone to crash.

The equities bubbles before the coronavirus hit were the largest on record.

Dollar Irony

The irony in this madness is the US will be printing the most currency and have the biggest budget deficits as a result. Yet central banks can’t seem to get enough dollars. In that aspect, the dollar ought to be sinking.

But given the US 10-year Treasury yield at 1.126% is among the highest in the world, why not exchange everything one can for dollars earning positive yield.

This is all such circular madness, it’s hard to say when or how it ends.

Shedlock: Supply And Demand Shocks Coming Up

Dual economic shocks are underway simultaneously. There are shortages of some things and lack of demand for others.

Rare Supply-Demand Shocks

Bloomberg has an excellent article on how the Global Economy Is Gripped by Rare Twin Supply-Demand Shock.

The coronavirus is delivering a one-two punch to the world economy, laying it low for months to come and forcing investors to reprice equities and bonds to account for lower company earnings.

From one side, the epidemic is hammering the capacity to produce goods as swathes of Chinese factories remain shuttered and workers housebound. That’s stopping production of goods there and depriving companies elsewhere of the materials they need for their own businesses.

With the virus no longer contained to China, increasingly worried consumers everywhere are reluctant to shop, travel or eat out. As a result, companies are likely not only to send workers home, but to cease hiring or investing — worsening the hit to spending.

How the two shocks will reverberate has sparked some debate among economists, with Harvard University Professor Kenneth Rogoff writing this week that a 1970s style supply-shortage-induced inflation jolt can’t be ruled out. Others contend another round of weakening inflation is pending.

Some economists argue that what’s happened is mostly a supply side shock, others have highlighted the wallop to demand as well, to the degree that the distinction matters.

Slowest Since the Financial Crisis


Inflationary or Deflationary?

In terms of prices, it’s a bit of both, but mostly the latter.

There’s a run on sanitizers, face masks, toilet paper ect. Prices on face masks, if you can find them, have gone up.

But that is dwarfed by the demand shock coming from lack of wages for not working, not traveling, not eating out etc.

The lost wages for 60 million people in China locked in will be a staggering hit alone.

That has also hit Italy. It will soon hit the US.

Next add in the fear from falling markets. People, especially boomers proud of their accounts (and buying cars like mad) will stop doing so.

It will be sudden.

Bad Timing

Stockpiling

Deflation Risk Rising

Another Reason to Avoid Stores – Deflationary

Hugely Deflationary – Weak Demand

This was the subject of a Twitter thread last week. I agreed with Robin Brooks’ take and did so in advance but I cannot find the thread.

I did find this.

Deflation is not really about prices. It’s about the value of debt on the books of banks that cannot be paid back by zombie corporations and individuals.

That is what the Fed fears. It takes lower and lower yields to prevent a debt crash. But it is entirely counterproductive and it does not help the consumer, only the asset holders. Fed (global central bank) policy is to blame.

These are the important point all the inflationistas miss.

Dallas Fed President Sees “No Move” In Fed Funds Rate

Dallas Fed President Robert Kaplan made some interesting comments today on interest rates, repos, and the coronavirus.


Dallas Fed President Robert Kaplan was on panel discussion today at the University of Texas McCombs School of Business on the “2020 Business Outlook: Real Estate and the Texas Economy” in Austin, Texas.

Bloomberg Econoday Synopsis

  1. Dallas Fed President Robert Kaplan is neutral right now on monetary policy, saying neither a rate cut nor a rate hike are necessary in the medium term. “My base case is no movement up or down in the Fed funds rate [in 2020], but I’ll be monitoring [things] carefully … this year,” Kaplan said in a panel discussion.
  2. Kaplan believes the outlook for the economy has stabilized and if anything has “firmed”, and though he now has “a more confident outlook” he isn’t ready to commit to a rate hike saying it’s “too soon to judge if a hike is coming, and you’ve got a number of [risky] factors going on.”
  3. Regarding a so-called “coronavirus cut” to reassure markets, Kaplan doesn’t see justification yet adding, however, that he is carefully watching how the virus unfolds and that he will have a better sense of its effects over the next few months. Kaplan also noted that he will be watching the first-half impact of the Boeing 737 production shutdown.
  4. On repo operations, Kaplan described the rise in the Fed’s balance sheet through year-end as “substantial” but he sees slowing growth through June. “I’d be hopeful and expect that as we continue bill purchases during the second quarter, the repo usage will begin to decline and the headline net balance-sheet growth for the Fed will moderate – certainly far more moderate than what’s we’ve seen to this period.”
  5. On inflation, Kaplan’s base case is an upward trend toward 2 percent in the medium term. Kaplan said the Fed is debating whether to lengthen out its look at inflation from a one-year average to perhaps a two-year average. “We look at a variety of factors to make our judgment.”

Regarding no interest rate movement, the market disagrees, and so do I.

On inflation, the entire fed is clueless about what it is.

In regards to a firming economic outlook, Kaplan may wish to ponder Coronavirus Deaths Surge, No Containment In Sight.

The supply chains disruptions will be massive. A “Made in China” Economic Hit is coming right up.

On repo operations, yep, it’s entirely believable the Fed will keep ballooning its balance sheet risking even bigger bubbles.

The yield curve is inverted once again. And that’s flashing another recession signal. On Average, How Long From Inversion to Recession?

Recession Arithmetic: What Would It Take?

David Rosenberg explores Recession Arithmetic in today’s Breakfast With Dave. I add a few charts of my own to discuss.

Rosenberg notes “Private fixed investment has declined two quarters in a row as of 2019 Q3. Since 1980, this has only happened twice outside of a recession.”

Here is the chart he presented.

Fixed Investment, Imports, Government Share of GDP


Since 1980 there have been five recessions in the U.S.and only once, after the dotcom bust in 2001, was there a recession that didn’t feature an outright decline in consumption expenditures in at least one quarter. Importantly, even historical comparisons are complicated. The economy has changed over the last 40 years. As an example, in Q4 of 1979, fixed investment was 20% of GDP, while in 2019 it makes up 17%. Meanwhile, imports have expanded from 10% of GDP to 15% and the consumer’s role has risen from 61% to 68% of the economy. All that to say, as the structure of the economy has evolved so too has its susceptibility to risks. The implication is that historical shocks would have different effects today than they did 40 years ago.

So, what similarities exist across time? Well, every recession features a decline in fixed investment (on average -9.8% from the pre-recession period), and an accompanying decline in imports (coincidentally also about -9.5% from the pre-recession period). Given the persistent trade deficit, it’s not surprising that declines in domestic activity would result in a drawdown in imports (i.e. a boost to GDP).

So, what does all of this mean for where we are in the cycle? Private fixed investment has declined two quarters in a row as of 2019 Q3. Since 1980, this has only happened two other times outside of a recession. The first was in the year following the burst of the dotcom bubble, as systemic overinvestment unwound itself over the course of eight quarters. The second was in 2006, as the housing market imploded… and we all know how that story ended.Small sample bias notwithstanding, we can comfortably say that this is not something that should be dismissed offhand.

For now, the consumer has stood tall. Real consumption expenditures contributed 3.0% to GDP in Q2, and 2.1% in Q3. Whether the consumer can keep the economy from tipping into recession remains to be seen.

Dave’s comments got me thinking about the makeup of fixed investment. It does not take much of a slowdown to cause a recession. But there are two components and they do not always move together.

Fixed Investment Year-Over-Year

One thing easily stands out. Housing marked the bottom in 12 of 13 recessions. 2001 was the exception.

Fixed Investment Year-Over-Year Detail

Fixed Investment Tipping Point

We are very close to a tipping point in which residential and nonresidential fixed investment are near the zero line. The above chart shows recessions can happen with fixed investment still positive year-over-year.

Manufacturing Has Peaked This Economic Cycle

The above charts are ominous given the view Manufacturing Has Peaked This Economic Cycle

Key Manufacturing Details

  • For the first time in history, manufacturing production is unlikely to take out the previous pre-recession peak.
  • Unlike the the 2015-2016 energy-based decline, the current manufacturing decline is broad-based and real.
  • Manufacturing production is 2.25% below the peak set in december 2007 with the latest Manufacturing ISM Down 5th Month to Lowest Since June 2009.

Other than the 2015-2016 energy-based decline, every decline in industrial production has led or accompanied a recession.

Manufacturing Jobs

After a manufacturing surge in November due to the end of the GM strike, Manufacturing Sector Jobs Shrank by 12,000 in December.

PPI Confirmation

Despite surging crude prices, the December Producer Price Inflation was Weak and Below Expectations

Shipping Confirmation

Finally, please note that the Cass Year-Over-Year Freight Index Sinks to a 12-Year Low

Manufacturing employment, shipping, industrial production, and the PPI are all screaming the same word.

In case you missed the word, here it is: Recession.

Gold: How High Will It Go In 2020?


Gold broke out of a six year consolidation. Things look up in 2020.

Gold Monthly Chart 2004-Present

Gold Monthly Chart 2010-Present


Smart Money Shorts

I ignore short-term COT “smart money” warnings although I would prefer there to be fewer bulls.

For discussion of “smart money“, please see Investigating Alleged Smart Money Positions in Gold.

Pater Tenebrarum at the Acting Man blog pinged me with this idea: The only caveat remains the large net speculative long position, but at the moment this strikes me almost as a “bear hook” that is keeping people on the sidelines waiting for the “inevitable” pullback while the train is leaving the station.

With the 6-year consolidation over, there is every reason fundamentally and technically for gold to continue up.

So, be my guest if you want to time gold to COT positions.

Technically Speaking

Technically, there is short-term monthly resistance between here and $1566. Perhaps there’s a pullback now, but with technical and fundamentals otherwise aligned why bet on it?

The next technical resistance area is the $1700 to $1800 area so any move above $1566 is likely to be a fast, strong one, perhaps with a retest of the $1566 area from above that.

Gold Fundamentals

Gold fundamentals are in excellent shape as I noted in How Does Gold React to Interest Rate Policy?

Much of the alleged “fundamentals” are noise, not fundamental price factors.

Not Fundamentally Important

  • Mine supply
  • Central Bank Buying
  • ETF analysis
  • The ever popular jewelry buying in India discussion

Aso, gold does not follow the dollar except superficially and in short-term time frames.

Gold vs the Dollar

Many people believe gold reacts primarily to changes in the US dollar.

Last week, I rebutted than notion in Gold’s vs the US Dollar: Correlation Is Not What Most Think.

True Supply of Gold and Reservation Demand

It is important to note that nearly every ounce of gold ever mined is still in existence. A small fraction of that mined gold has been lost, and other small fractions sit in priceless statues in museums etc., and is thus not available for sale.

Otherwise, someone has to hold every ounce of gold ever mined, 100% of the time. That is the true supply. Jewelry buying and mine output are insignificant in comparison. We are not about to run out of gold as some gold shills suggest.

Mises refers to the desire to hold gold as “Reservation Demand“, that is the desire of people to hold their gold coins, bullion, bars, and jewelry rather than trading it for something else.

If we strike out jewelry buying, central bank buying, the dollar, and mine supply, what then determines “Reservation Demand” to own gold vs some other asset?

Faith in Central Banks

Talk of normalization was nonsense, as were various “Dot Plots” that suggested the Fed was on a major hiking cycle.

For an amusing chart of where the Fed projected interest rates would be in 2020, please see Dot Plot Fantasyland Projections.

The market did not believe the Fed, neither did I, and neither did gold.

Once again we are back to my central gold theme question.

Is everything under control or not?

The Fed & The Stability/Instability Paradox

“Only those that risk going too far can possibly find out how far one can go.” – T.S. Eliot

Well, this certainly seems to be the path that the Federal Reserve, and global Central Banks, have decided take.

Yesterday, the Fed lowered interest rates by a quarter-point and maintained their “dovish” stance but suggested they are open to “allowing the balance sheet to grow.” While this isn’t anything more than just stopping Q.T. entirely, the markets took this as a sign that Q.E. is just around the corner.

That expectation is likely misguided as the Fed seems completely unconcerned of any recessionary impact in the near-term. However, such has always been the case, historically speaking, just before the onset of a recession. This is because the Fed, and economists in general, make predictions based on lagging data which is subject to large future revisions. Regardless, the outcome of the Fed’s monetary policies has always been, without exception, either poor, or disastrous.

“In the U.S., the Federal Reserve has been the catalyst behind every preceding financial event since they became ‘active,’ monetarily policy-wise, in the late 70’s. As shown in the chart below, when the Fed has lifted the short-term lending rates to a level higher than the 2-year rate, bad ‘stuff’ has historically followed.”

The idea of pushing limits to extremes also applies to stock market investors. As we pointed out on Tuesday, the risks of a liquidity-driven event have increased markedly in recent months. Yet, despite the apparent risk, investors have virtually “no fear.” (Bullish advances are supported by extremely low levels of volatility below the long-term average of 19.)

First, “record levels” of anything are records for a reason. It is where the point where previous limits were reached. Therefore, when a ‘record level’ is reached, it is NOT THE BEGINNING, but rather an indication of the MATURITY of a cycle. While the media has focused on employment, record stock market levels, etc. as a sign of an ongoing economic recovery, history suggests caution.”

In the “rush to be bullish” this a point often missed. When markets are hitting “record levels,” it is when investors get “the most bullish.” That is the case currently with retail investors “all in.”

Conversely, they are the most “bearish” at the lows.

It is just human nature.

“What we call the beginning is often the end. And to make an end is to make a beginning. The end is where we start from.” – T.S. Eliot

The point here is that “all things do come to an end.” The further from the “mean” something has gotten, the greater the reversion is going to be. The two charts below illustrate this point clearly.

Bull markets, with regularity, are almost entirely wiped out by the subsequent bear market.

Despite the best of intentions, market participants never act rationally.

Neither do consumers.

The Instability Of Stability

This is the problem facing the Fed.

Currently, investors have been led to believe that no matter what happens, the Fed can bail out the markets and keep the bull market going for a while longer. Or rather, as Dr. Irving Fisher once uttered:

“Stocks have reached a permanently high plateau.”

Interestingly, the Fed is dependent on both market participants, and consumers, believing in this idea. As we have noted previously, with the entirety of the financial ecosystem now more heavily levered than ever, due to the Fed’s profligate measures of suppressing interest rates and flooding the system with excessive levels of liquidity, the “instability of stability” is now the most significant risk.

The “stability/instability paradox” assumes that all players are rational and such rationality implies an avoidance of complete destruction. In other words, all players will act rationally, and no one will push “the big red button.”

The Fed is highly dependent on this assumption as it provides the “room” needed, after more than 10-years of the most unprecedented monetary policy program in U.S. history, to try and navigate the risks that have built up in the system.

Simply, the Fed is dependent on “everyone acting rationally.”

Unfortunately, that has never been the case.

The behavioral biases of individuals is one of the most serious risks facing the Fed. Throughout history, as noted above, the Fed’s actions have repeatedly led to negative outcomes despite the best of intentions.

  • In the early 70’s it was the “Nifty Fifty” stocks,
  • Then Mexican and Argentine bonds a few years after that
  • “Portfolio Insurance” was the “thing” in the mid -80’s
  • Dot.com anything was a great investment in 1999
  • Real estate has been a boom/bust cycle roughly every other decade, but 2006 was a doozy
  • Today, it’s ETF’s and “Passive Investing,” and levered credit.

As noted Tuesday, the risk to this entire house of cards is a credit-related event.

Anyone wonder what might happen should passive funds become large net sellers of credit risk? In that event, these indiscriminate sellers will have to find highly discriminating buyers who–you guessed it–will be asking lots of questions. Liquidity for the passive universe–and thus the credit markets generally–may become very problematic indeed.

The recent actions by Central Banks certainly suggest risk has risen. Whether this was just an anomalous event, or an early warning, it is too soon to know for sure. However, if there is a liquidity issue, the risk to ‘uniformed investors’ is substantially higher than most realize. 

Risk concentration always seems rational at the beginning, and the initial successes of the trends it creates can be self-reinforcing. That is, until suddenly, and often without warning, it all goes “pear\-shaped.”

In November and December of last year, it was the uniformity of the price moves which revealed the fallacy “passive investing” as investors headed for the door all at the same time. While, that rout was quickly forgotten as markets stormed back to all-time highs, on “hopes” of Central Bank liquidity and “trade deals.”

The difference today, versus then, are the warning signs of deterioration in areas which pose a direct threat to everyone “acting rationally.” 

“While yields going to zero] certainly sounds implausible at the moment, just remember that all yields globally are relative. If global sovereign rates are zero or less, it is only a function of time until the U.S. follows suit. This is particularly the case if there is a liquidity crisis at some point.

It is worth noting that whenever Eurodollar positioning has become this extended previously, the equity markets have declined along with yields. Given the exceedingly rapid rise in the Eurodollar positioning, it certainly suggests that ‘something has broken in the system.’” 

Risk is clearly elevated as the Fed is cutting rates despite the “economic data” not supporting it. This is clearly meant to keep everyone acting rationally for now.

The problem comes when they don’t.

The Single Biggest Risk To Your Money

All of this underscores the single biggest risk to your investment portfolio.

In extremely long bull market cycles, investors become “willfully blind,” to the underlying inherent risks. Or rather, it is the “hubris” of investors they are now “smarter than the market.”

Yet, the list of concerns remains despite being completely ignored by investors and the mainstream media.

  • Growing economic ambiguities in the U.S. and abroad: peak autos, peak housing, peak GDP.
  • Political instability and a crucial election.
  • The failure of fiscal policy to ‘trickle down.’
  • An important pivot towards easing in global monetary policy.
  • Geopolitical risks from Trade Wars to Iran 
  • Inversions of yield curves
  • Deteriorating earnings and corporate profit margins.
  • Record levels of private and public debt.
  •  More than $3 trillion of covenant light and/or sub-prime corporate debt. (now larger and more pervasive than the size of the subprime mortgages outstanding in 2007)

For now, none of that matters as the Fed seems to have everything under control.

The more the market rises, the more reinforced the belief “this time is different” becomes.

Yes, our investment portfolios remain invested on the long-side for now. (Although we continue to carry slightly higher levels of cash and hedges.)

However, that will change, and rapidly so, at the first sign of the “instability of stability.” 

Unfortunately, by the time the Fed realizes what they have done, it has always been too late.