Tag Archives: deficits

#MacroView: Japan, The Fed, & The Limits Of QE

This past week saw a couple of interesting developments.

On Wednesday, the Fed released the minutes from their January meeting with comments which largely bypassed overly bullish investors.

“… several participants observed that equity, corporate debt, and CRE valuations were elevated and drew attention to  high levels of corporate indebtedness and weak underwriting standards in leveraged loan markets. Some participants expressed the concern that financial imbalances-including overvaluation and excessive indebtedness-could amplify an adverse shock to the economy …”

“… many participants remarked that the Committee should not rule out the possibility of adjusting the stance of monetary policy to mitigate financial stability risks, particularly when those risks have important implications for the economic outlook and when macroprudential tools had been or were likely to be ineffective at mitigating those risks…”

The Fed recognizes their ongoing monetary interventions have created financial risks in terms of asset bubbles across multiple asset classes. They are also aware that the majority of the policy tools are likely ineffective at mitigating financial risks in the future. This leaves them being dependent on expanding their balance sheet as their primary weapon.

Interestingly, the weapon they are dependent on may not be as effective as they hope. 

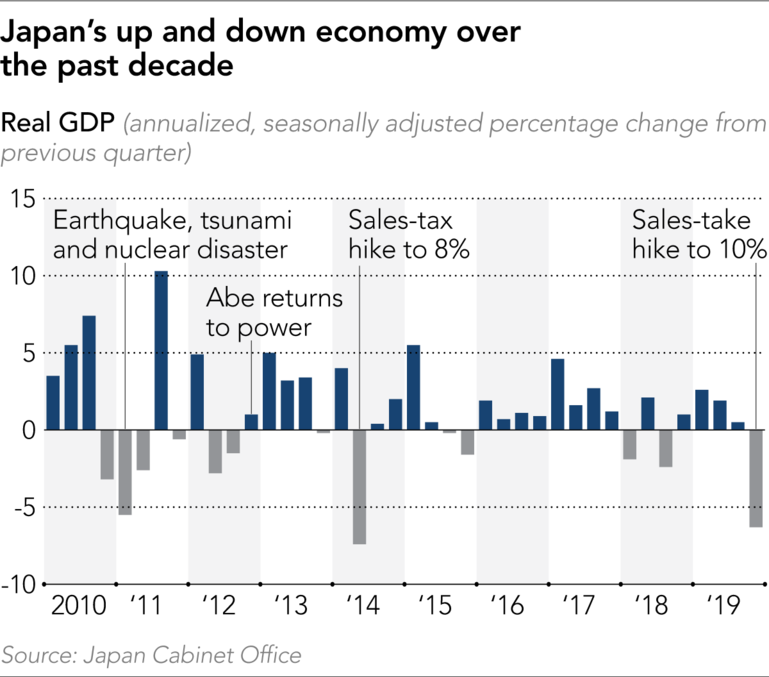
This past week, Japan reported a very sharp drop in economic growth in their latest reported quarter as a further increase in the sales-tax hit consumption. While the decline was quickly dismissed by the markets, this was a pre-coronovirus impact, which suggests that Japan will enter into an “official” recession in the next quarter.

There is more to this story.

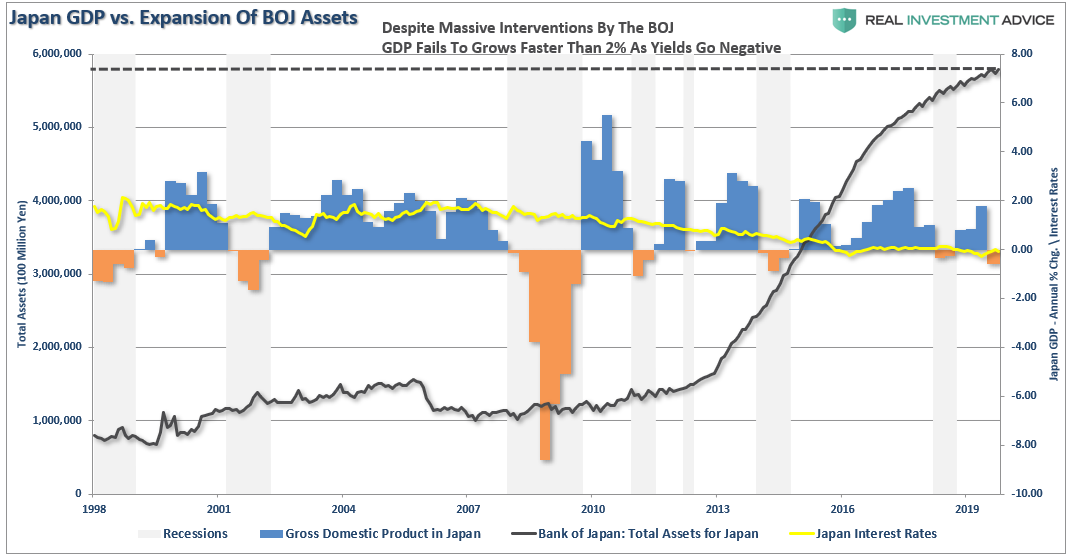
Since the financial crisis, Japan has been running a massive “quantitative easing” program which, on a relative basis, is more than 3-times the size of that in the U.S. However, while stock markets have performed well with Central Bank interventions, economic prosperity is only slightly higher than it was prior to the turn of century.

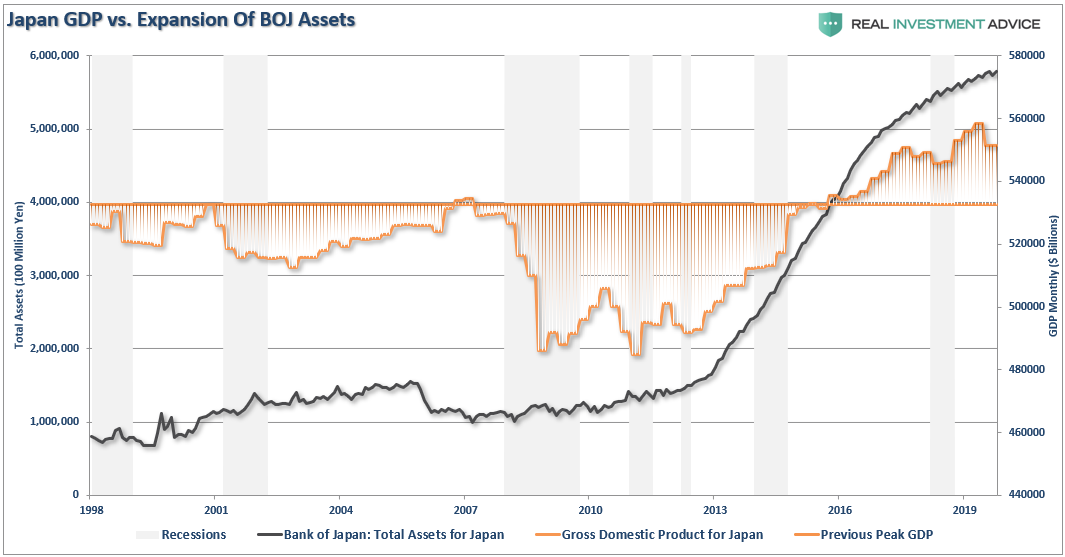
Furthermore, despite the BOJ’s balance sheet consuming 80% of the ETF markets, not to mention a sizable chunk of the corporate and government debt market, Japan has been plagued by rolling recessions, low inflation, and low-interest rates. (Japan’s 10-year Treasury rate fell into negative territory for the second time in recent years.)

Why is this important? Because Japan is a microcosm of what is happening in the U.S. As I noted previously:
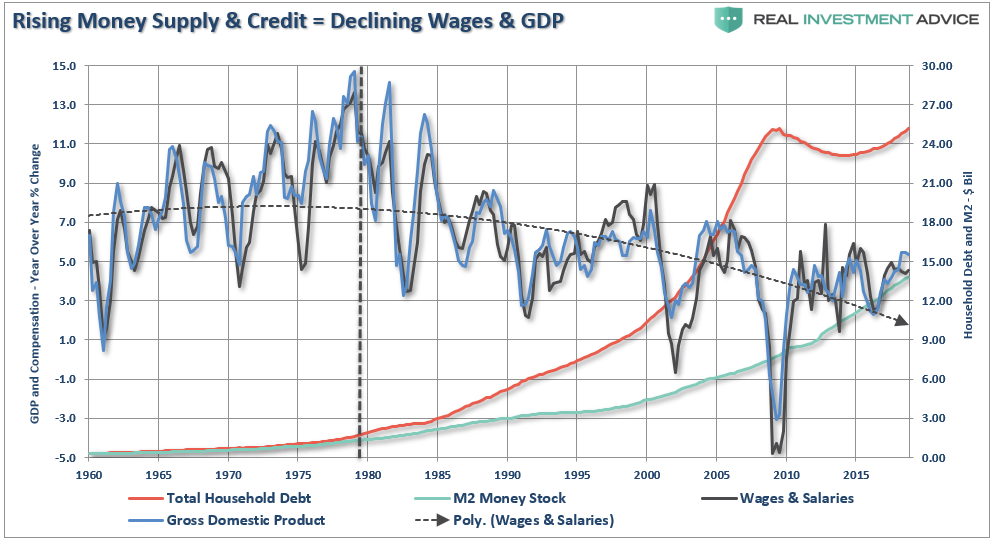
The U.S., like Japan, is caught in an ongoing ‘liquidity trap’ where maintaining ultra-low interest rates are the key to sustaining an economic pulse. The unintended consequence of such actions, as we are witnessing in the U.S. currently, is the battle with deflationary pressures. The lower interest rates go – the less economic return that can be generated. An ultra-low interest rate environment, contrary to mainstream thought, has a negative impact on making productive investments, and risk begins to outweigh the potential return.

Most importantly, while there are many calling for an end of the ‘Great Bond Bull Market,’ this is unlikely the case. As shown in the chart below, interest rates are relative globally. Rates can’t increase in one country while a majority of economies are pushing negative rates. As has been the case over the last 30-years, so goes Japan, so goes the U.S.”

As my colleague Doug Kass recently noted, Japan is a template of the fragility of global economic growth. 

“Global growth continues to slow and the negative impact on demand and the broad supply interruptions will likely expose the weakness of the foundation and trajectory of worldwide economic growth. This is particularly dangerous as the monetary ammunition has basically been used up.

As we have observed, monetary growth (and QE) can mechanically elevate and inflate the equity markets. For example, now in the U.S. market, basic theory is that in practice a side effect is that via the ‘repo’ market it is turned into leveraged trades into the equity markets. But, again, authorities are running out of bullets and have begun to question the efficacy of monetary largess.

Bigger picture takeaway is beyond the fact that financial engineering does not help an economy, it probably hurts it. If it helped, after mega-doses of the stuff in every imaginable form, the Japanese economy would be humming. But the Japanese economy is doing the opposite. Japan tried to substitute monetary policy for sound fiscal and economic policy. And the result is terrible.

While financial engineering clearly props up asset prices, I think Japan is a very good example that financial engineering not only does nothing for an economy over the medium to longer-term, it actually has negative consequences.” 

This is a key point.

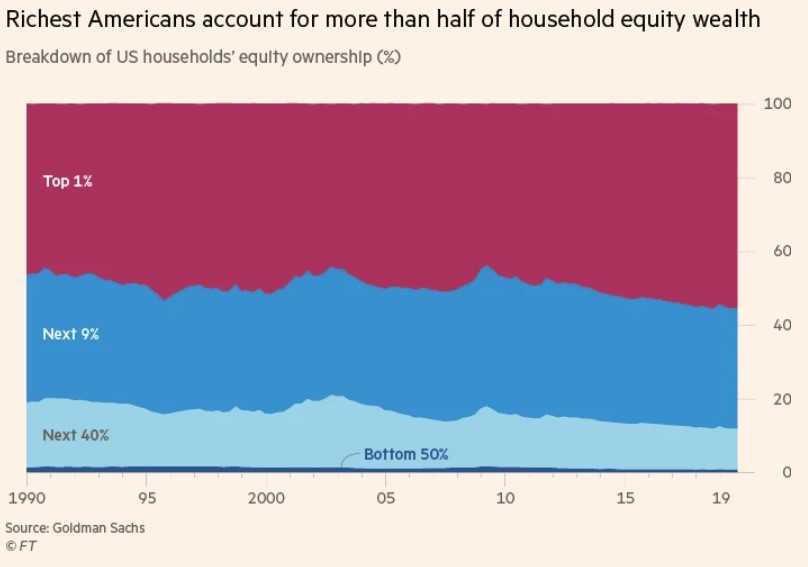
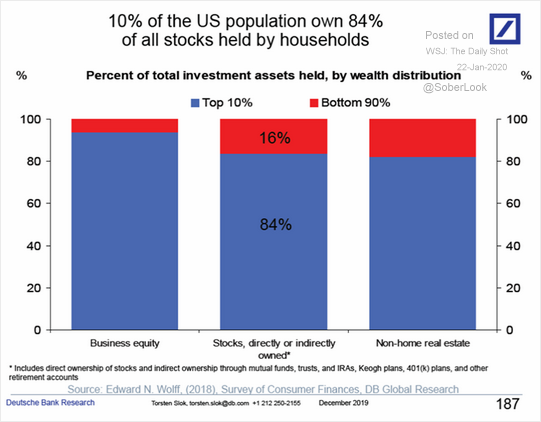
The “Stock Market” Is NOT The “Economy.”

Roughly 90% of the population gets little, or no, direct benefit from the rise in stock market prices.

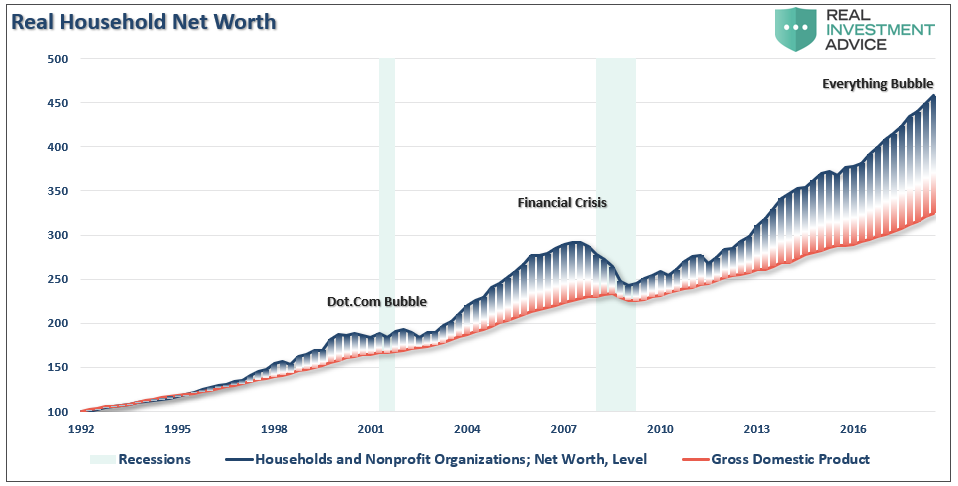
Another way to view this issue is by looking at household net worth growth between the top 10% to everyone else.

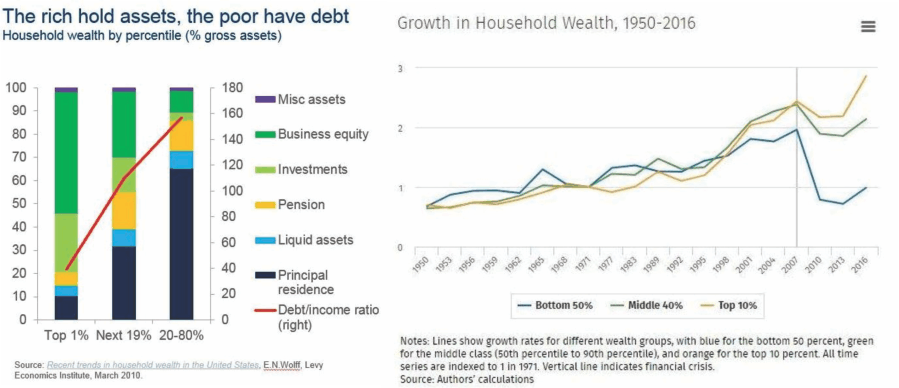
Since 2007, the ONLY group that has seen an increase in net worth is the top 10% of the population.


“This is not economic prosperity.

This is a distortion of economics.”


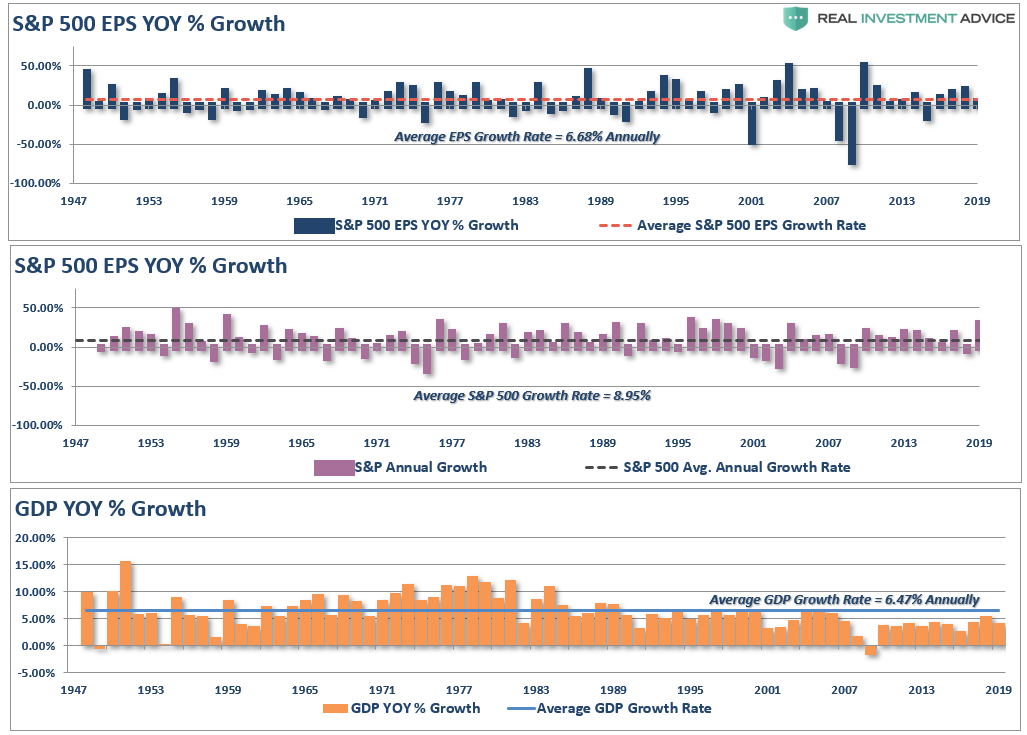
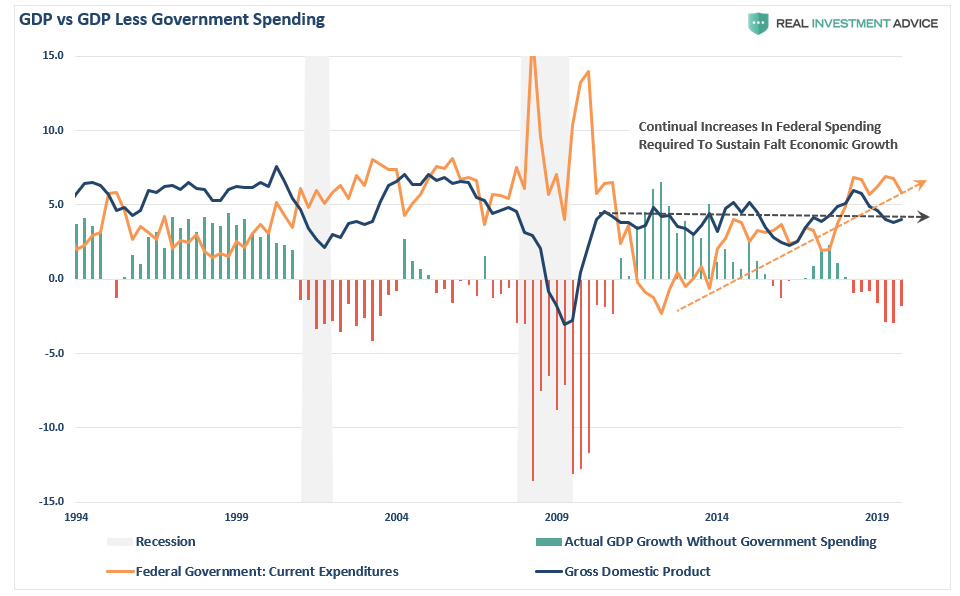
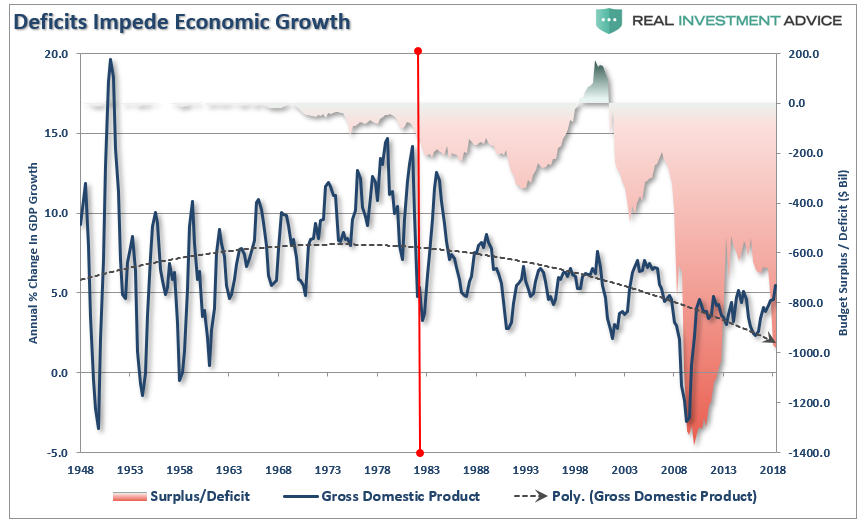
From 2009-2016, the Federal Reserve held rates at 0%, and flooded the financial system with 3-consecutive rounds of “Quantitative Easing” or “Q.E.” During that period, average real rates of economic growth rates never rose much above 2%.

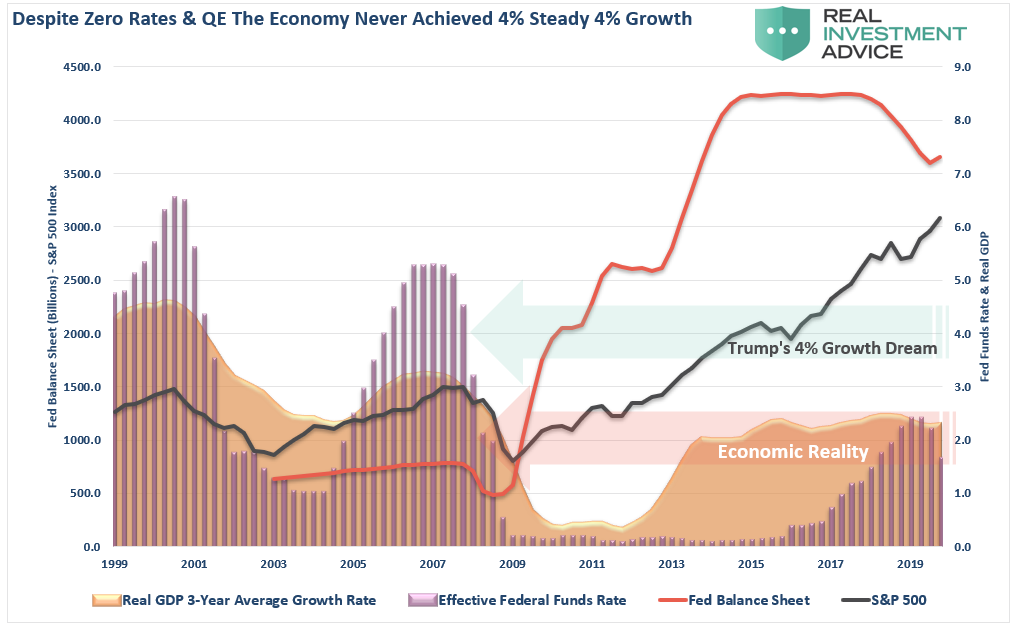
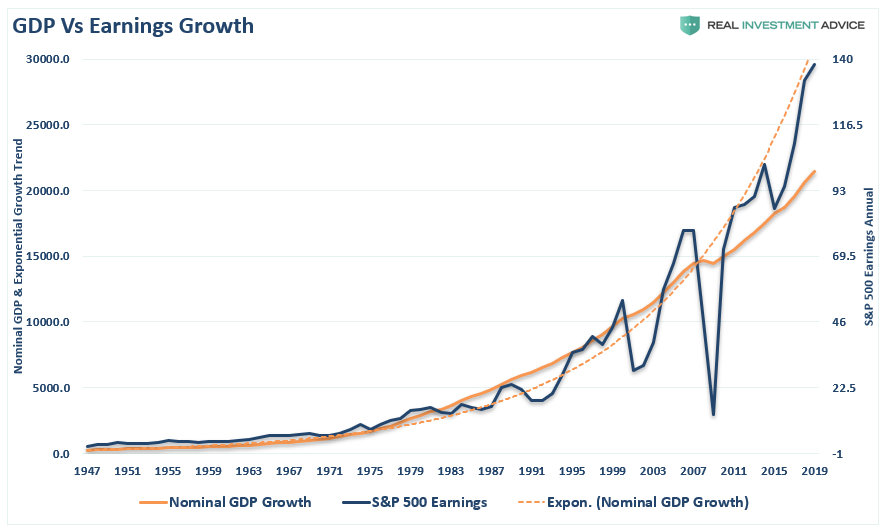
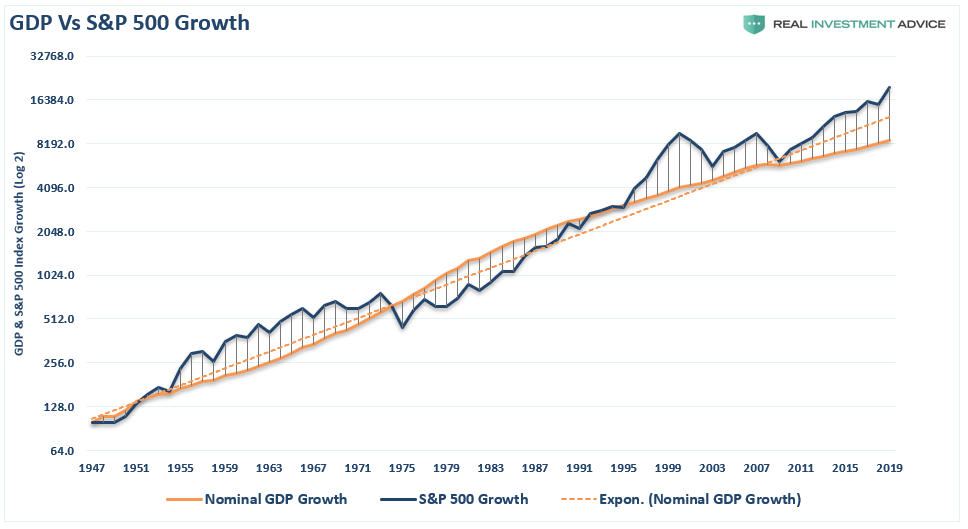
Yes, asset prices surged as liquidity flooded the markets, but as noted above “Q.E.” programs did not translate into economic activity. The two 4-panel charts below shows the entirety of the Fed’s balance sheet expansion program (as a percentage) and its relative impact on various parts of the real economy. (The orange bar shows now many dollars of increase in the Fed’s balance sheet that it took to create an increase in each data point.)

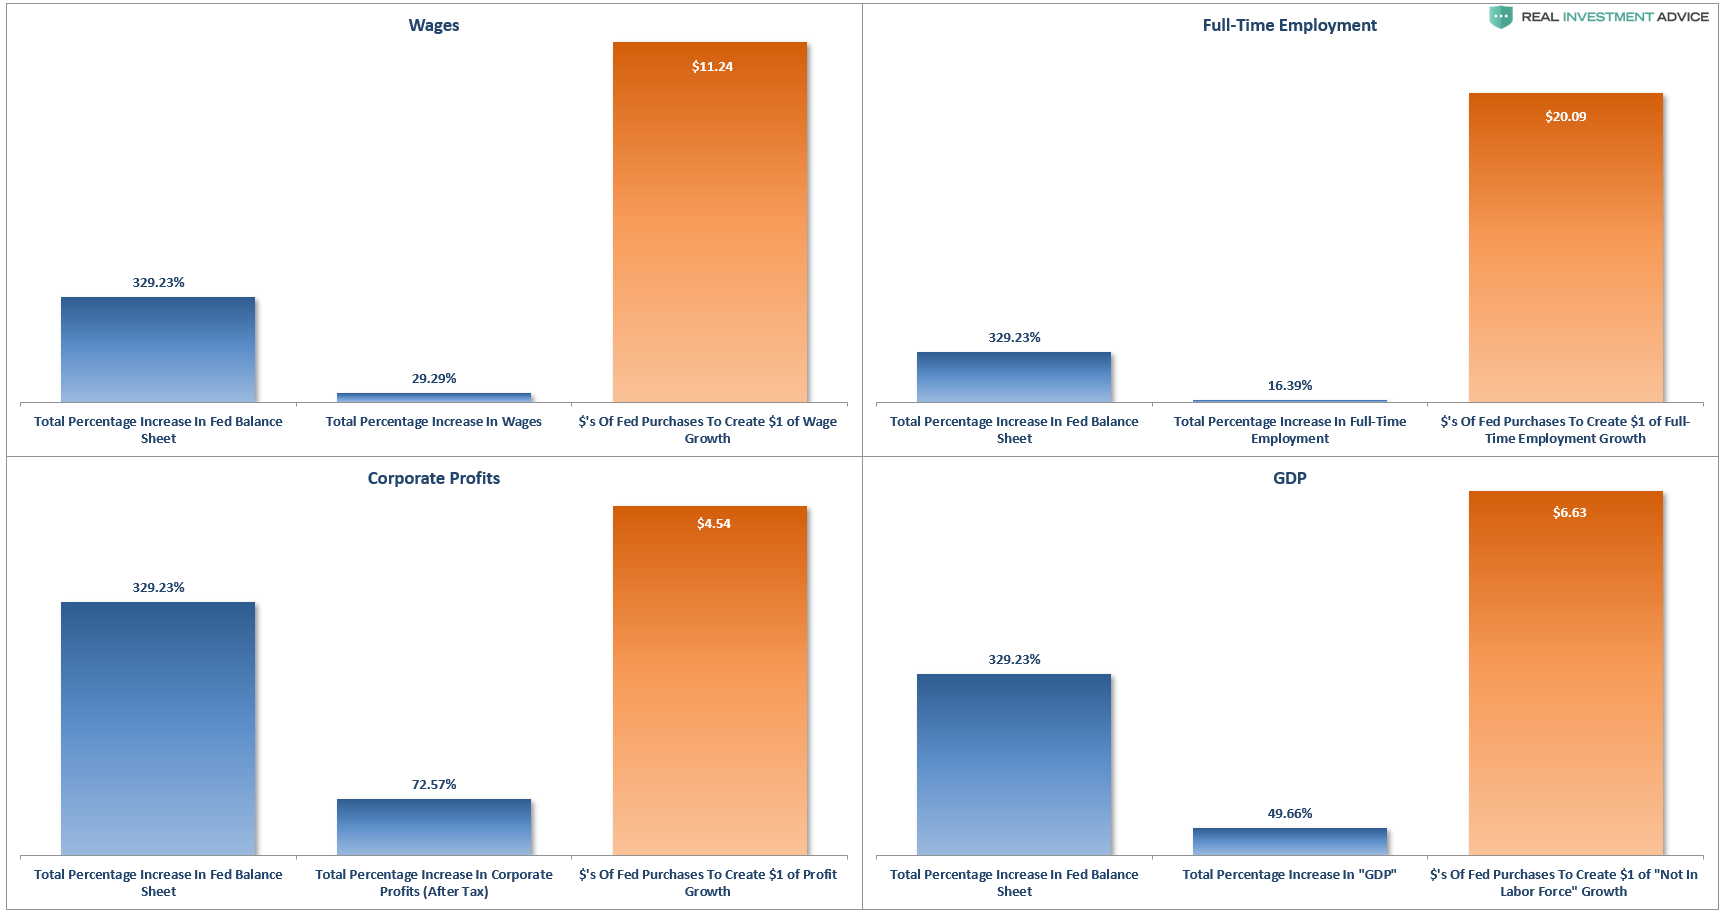
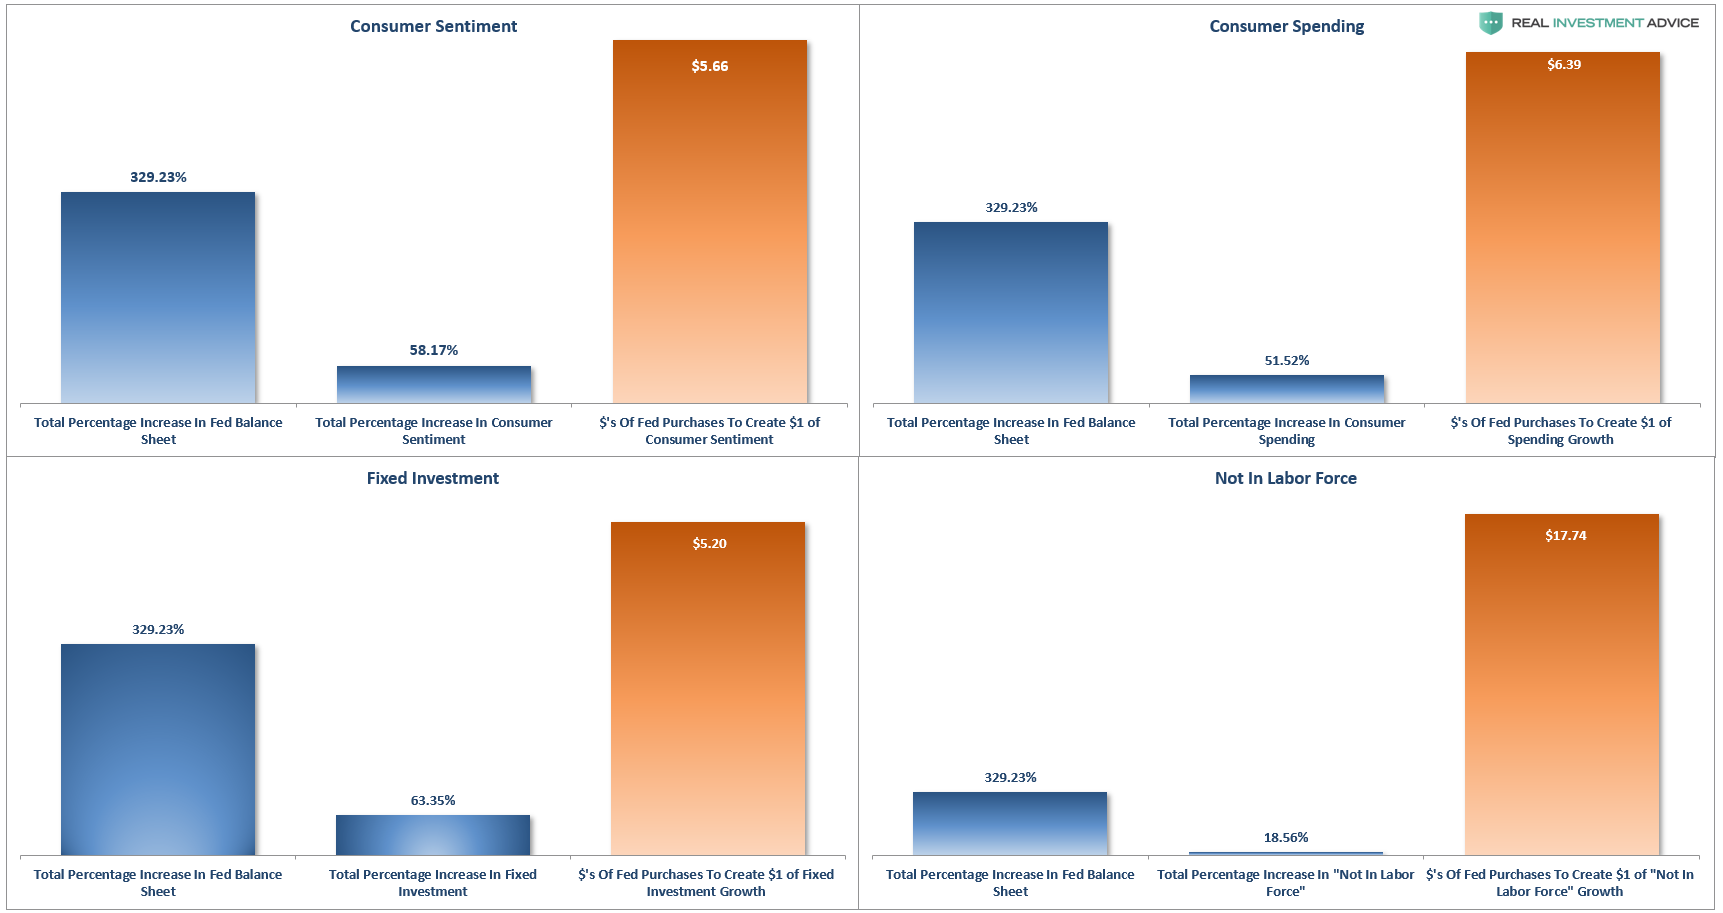
As you can see, it took trillions in “QE” programs, not to mention trillions in a variety of other bailout programs, to create a relatively minimal increase in economic data. Of course, this explains the growing wealth gap, which currently exists as monetary policy lifted asset prices.

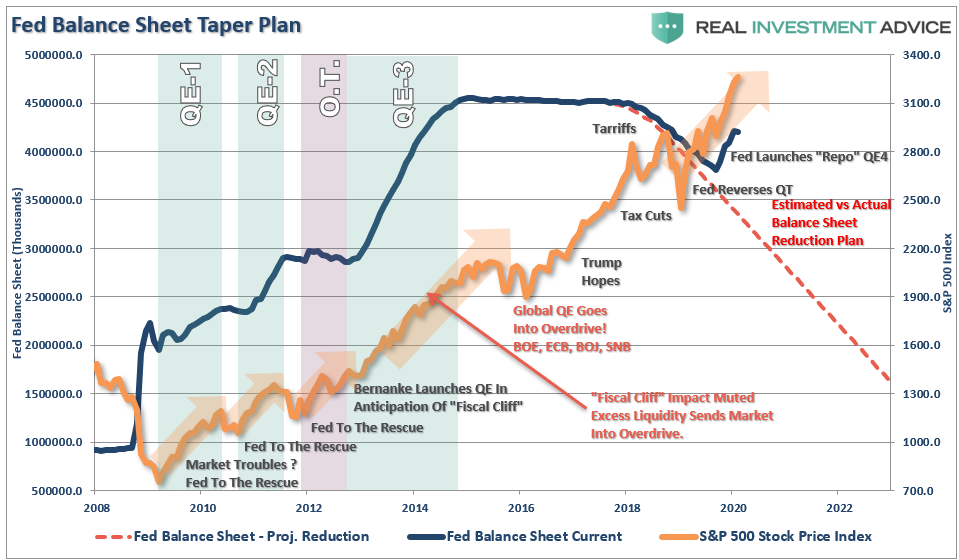
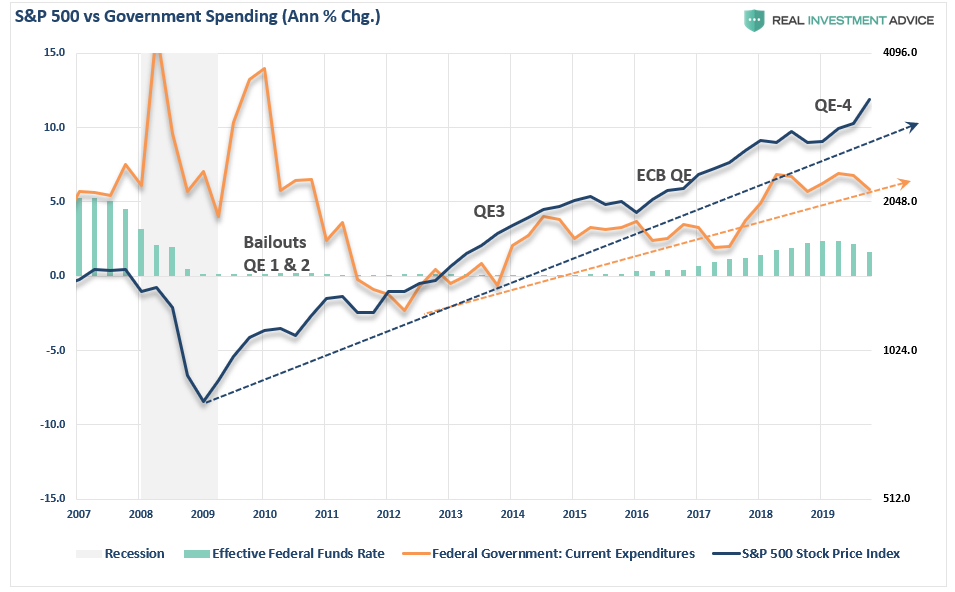
The table above shows that QE1 came immediately following the financial crisis and had an effective ratio of about 1.6:1. In other words, it took a 1.6% increase in the balance sheet to create a 1% advance in the S&P 500. However, once market participants figured out the transmission system, QE2 and QE3 had an almost perfect 1:1 ratio of effectiveness. The ECB’s QE program, which was implemented in 2015 to support concerns of an unruly “Brexit,” had an effective ratio of 1.5:1. Not surprisingly, the latest round of QE, which rang “Pavlov’s bell,” has moved back to a near perfect 1:1 ratio.

Clearly, QE worked well in lifting asset prices, but as shown above, not so much for the economy. In other words, QE was ultimately a massive “wealth transfer” from the middle class to the rich which has created one of the greatest wealth gaps in the history of the U.S., not to mention an asset bubble of historic proportions.

But Will It Work Next Time?

This is the single most important question for investors.

The current belief is that QE will be implemented at the first hint of a more protracted downturn in the market. However, as suggested by the Fed, QE will likely only be employed when rate reductions aren’t enough. This was a point made in 2016 by David Reifschneider, deputy director of the division of research and statistics for the Federal Reserve Board in Washington, D.C., released a staff working paper entitled “Gauging The Ability Of The FOMC To Respond To Future Recessions.” 

The conclusion was simply this:

“Simulations of the FRB/US model of a severe recession suggest that large-scale asset purchases and forward guidance about the future path of the federal funds rate should be able to provide enough additional accommodation to fully compensate for a more limited [ability] to cut short-term interest rates in most, but probably not all, circumstances.”

In other words, the Federal Reserve is rapidly becoming aware they have become caught in a liquidity trap keeping them unable to raise interest rates sufficiently to reload that particular policy tool. There are certainly growing indications the U.S. economy maybe be heading towards the next recession. 

Interestingly, David compared three policy approaches to offset the next recession.

  1. Fed funds goes into negative territory but there is no breakdown in the structure of economic relationships.
  2. Fed funds returns to zero and keeps it there long enough for unemployment to return to baseline.
  3. Fed funds returns to zero and the FOMC augments it with additional $2-4 Trillion of QE and forward guidance. 

In other words, the Fed is already factoring in a scenario in which a shock to the economy leads to additional QE of either $2 trillion, or in a worst case scenario, $4 trillion, effectively doubling the current size of the Fed’s balance sheet.

So, 2-years ago David lays out the plan, and on Wednesday, the Fed reiterates that plan.

Does the Fed see a recession on the horizon? Is this why there are concerns about valuations?

Maybe.

But there is a problem with the entire analysis. The effectiveness of QE, and zero interest rates, is based on the point at which you apply these measures.

In 2008, when the Fed launched into their “accommodative policy” emergency strategy to bail out the financial markets, the Fed’s balance sheet was running at $915 Billion. The Fed Funds rate was at 4.2%.

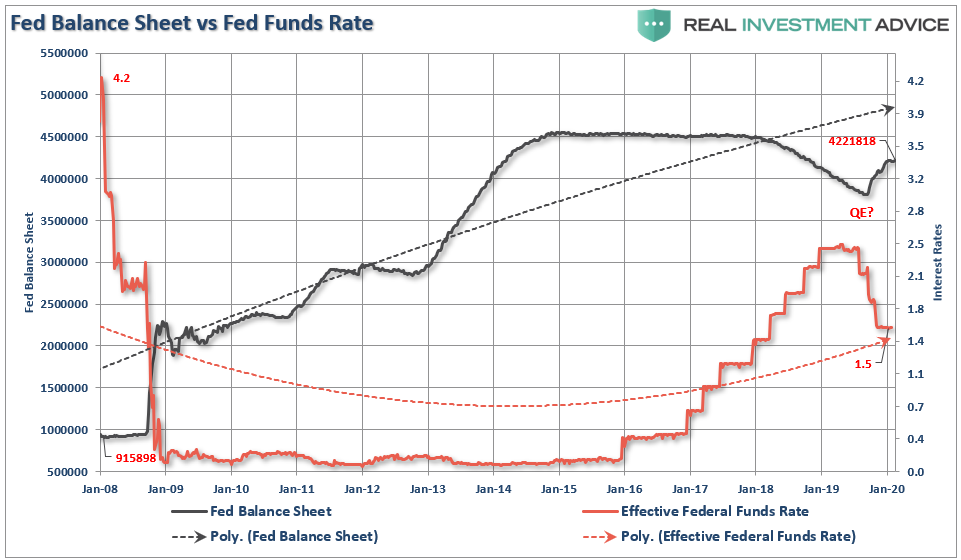
If the market fell into a recession tomorrow, the Fed would be starting with a $4.2 Trillion balance sheet with interest rates 3% lower than they were in 2009. In other words, the ability of the Fed to ‘bail out’ the markets today, is much more limited than it was in 2008.”

But there is more to the story than just the Fed’s balance sheet and funds rate. The entire backdrop is completely reversed. The table below compares a variety of financial and economic factors from 2009 to present.

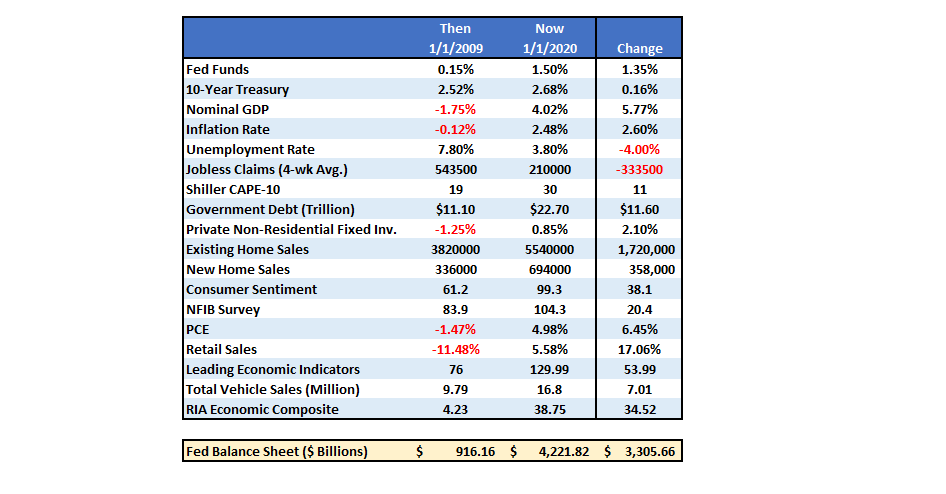
Importantly, QE, and rate reductions, have the MOST effect when the economy, markets, and investors are extremely negative.

In other words, there is nowhere to go but up.

Such was the case in 2009. Not today.

This suggests that the Fed’s ability to stem the decline of the next recession, or offset a financial shock to the economy from falling asset prices, may be much more limited than the Fed, and most investors, currently believe.

Summary

It has taken a massive amount of interventions by Central Banks to keep economies afloat globally over the last decade, and there is rising evidence that growth is beginning to decelerate.

Furthermore, we have much more akin with Japan than many would like to believe.

  • A decline in savings rates
  • An aging demographic
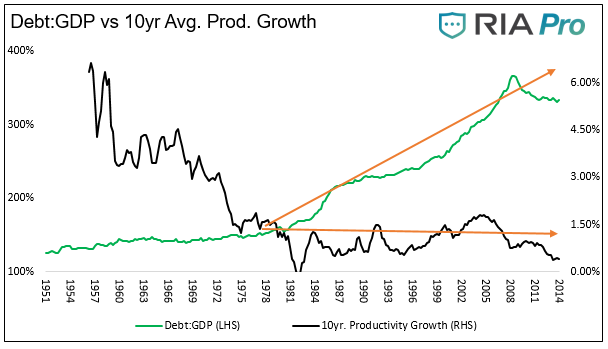
  • A heavily indebted economy
  • A decline in exports
  • Slowing domestic economic growth rates.
  • An underemployed younger demographic.
  • An inelastic supply-demand curve
  • Weak industrial production
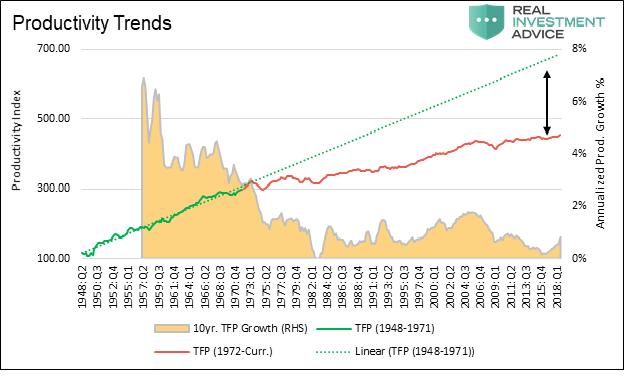
  • Dependence on productivity increases

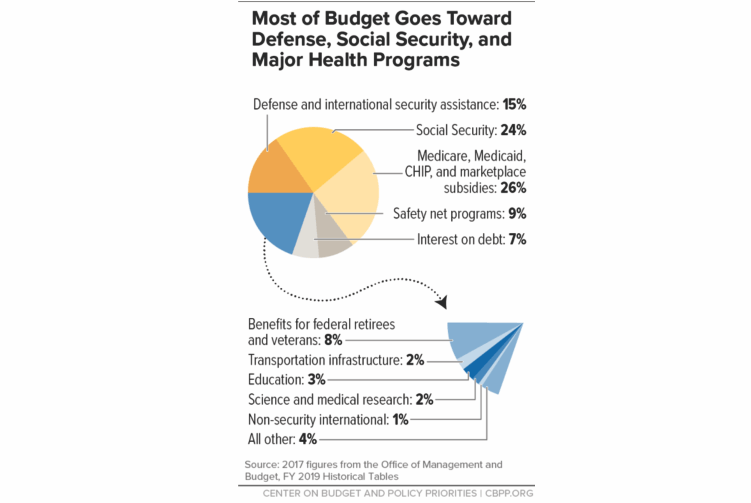
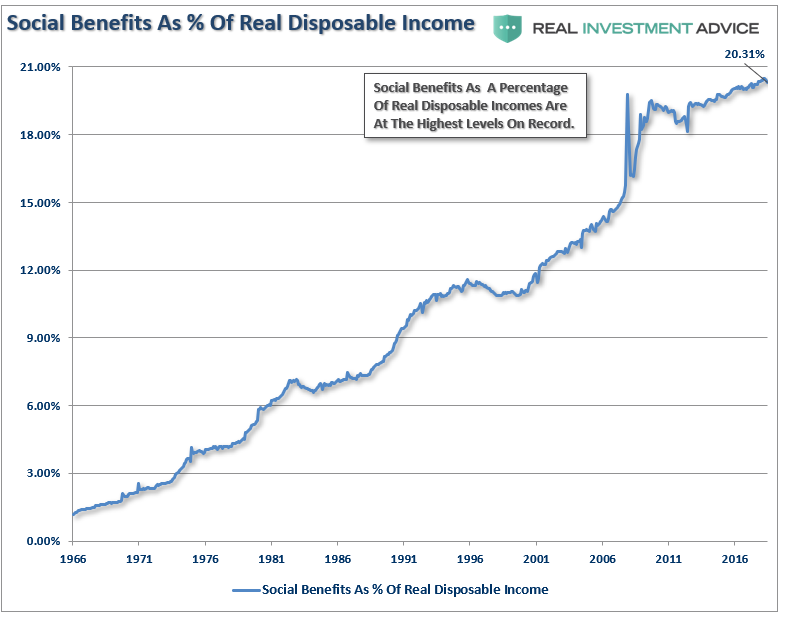
The lynchpin to Japan, and the U.S., remains demographics and interest rates. As the aging population grows becoming a net drag on “savings,” the dependency on the “social welfare net” will continue to expand. The “pension problem” is only the tip of the iceberg.

While another $2-4 Trillion in QE might indeed be successful in keeping the bubble inflated for a while longer, there is a limit to the ability to continue pulling forward future consumption to stimulate economic activity. In other words, there are only so many autos, houses, etc., which can be purchased within a given cycle. There is evidence the cycle peak has been reached.

If the effectiveness of rate reductions and QE are diminished due to the reasons detailed herein, the subsequent destruction to the “wealth effect” will be larger than currently imagined. The Fed’s biggest fear is finding themselves powerless to offset the negative impacts of the next recession. 

If more “QE” works, great.

But as investors, with our retirement savings at risk, what if it doesn’t.

#MacroView: Debt, Deficits & The Path To MMT.

In September 2017, when the Trump Administration began promoting the idea of tax cut legislation, I wrote a series of articles discussing the fallacy that tax cuts would lead to higher tax collections, and a reduction in the deficit. To wit:

“Given today’s record-high levels of debt, the country cannot afford a deficit-financed tax cut. Tax reform that adds to the debt is likely to slow, rather than improve, long-term economic growth.

The problem with the claims that tax cuts reduce the deficit is that there is NO evidence to support the claim. The increases in deficit spending to supplant weaker economic growth has been apparent with larger deficits leading to further weakness in economic growth. In fact, ever since Reagan first lowered taxes in the ’80’s both GDP growth and the deficit have only headed in one direction – higher.”

That was the deficit in September 2017.

Here it is today.

As opposed to all the promises made, economic growth failed to get stronger. Furthermore, federal revenues as a percentage of GDP declined to levels that have historically coincided with recessions.

Why Does This Matter?

President Trump just proposed his latest $4.8 Trillion budget, and not surprisingly, suggests the deficit will decrease over the next 10-years.

Such is a complete fantasy and was derived from mathematical gimmickry to delude voters to the contrary. As Jim Tankersley recently noted:

The White House makes the case that this is affordable and that the deficit will start to fall, dropping below $1 trillion in the 2021 fiscal year, and that the budget will be balanced by 2035. That projection relies on rosy assumptions about growth and the accumulation of new federal debt — both areas where the administration’s past predictions have proved to be overconfident.

The new budget forecasts a growth rate for the United States economy of 2.8 percent this year — or, by the metric the administration prefers to cite, a 3.1 percent rate. That is more than a half percentage point higher than forecasters at the Federal Reserve and the Congressional Budget Office predict.

It then predicts growth above 3 percent annually for the next several years if the administration’s economic policies are enacted. The Fed, the budget office and others all see growth falling below 2 percent annually in that time. By 2030, the administration predicts the economy will be more than 15 percent larger than forecasters at the budget office do.

Past administrations have also dressed up their budget forecasts with economic projections that proved far too good to be true. In its fiscal year 2011 budget, for example, the Obama administration predicted several years of growth topping 4 percent in the aftermath of the 2008 financial crisis — a number it never came close to reaching even once.

Trump’s budget expectations also contradict the Congressional Budget Office’s latest deficit warning:

“CBO estimates a 2020 deficit of $1.0 trillion, or 4.6 percent of GDP. The projected gap between spending and revenues increases to 5.4 percent of GDP in 2030. Federal debt held by the public is projected to rise over the ­coming decade, from 81 percent of GDP in 2020 to 98 percent of GDP in 2030. It continues to grow ­thereafter in CBO’s projections, reaching 180 percent of GDP in 2050, well above the highest level ever recorded in the United States.”

“With unprecedented trillion-dollar deficits projected as far as the eye can see, this country needs a serious budget. Unfortunately, that cannot be said of the one the President just submitted to Congress, which is filled with non-starters and make-believe economics.” – Maya Macguineas

Debt Slows Economic Growth

There is a long-standing addiction in Washington to debt. Every year, we continue to pile on more debt with the expectation that economic growth will soon follow.

However, excessive borrowing by companies, households or governments lies at the root of almost every economic crisis of the past four decades, from Mexico to Japan, and from East Asia to Russia, Venezuela, and Argentina. But it’s not just countries, but companies as well. You don’t have to look too far back to see companies like Enron, GM, Bear Stearns, Lehman, and a litany of others brought down by surging debt levels and simple “greed.” Households, too, have seen their fair share of debt burden related disaster from mortgages to credit cards to massive losses of personal wealth.

It would seem that after nearly 40-years, some lessons would have been learned.

Such reckless abandon by politicians is simply due to a lack of “experience” with the consequences of debt.

In 2008, Margaret Atwood discussed this point in a Wall Street Journal article:

“Without memory, there is no debt. Put another way: Without story, there is no debt.

A story is a string of actions occurring over time — one damn thing after another, as we glibly say in creative writing classes — and debt happens as a result of actions occurring over time. Therefore, any debt involves a plot line: how you got into debt, what you did, said and thought while you were in there, and then — depending on whether the ending is to be happy or sad — how you got out of debt, or else how you got further and further into it until you became overwhelmed by it, and sank from view.”

The problem today is there is no “story” about the consequences of debt in the U.S. While there is a litany of other countries which have had their own “debt disaster” story, those issues have been dismissed under the excuse of “yes, but they aren’t the U.S.”

But this lack of a “story,” is what has led us to the very doorstep of “Modern Monetary Theory,” or “MMT.” As Michael Lebowitz previously explained:

“MMT theory essentially believes the government spending can be funded by printing money. Currently, government spending is funded by debt, and not the Fed’s printing press. MMT disciples tell us that when the shackles of debt and deficits are removed, government spending can promote economic growth, full employment and public handouts galore.

Free healthcare and higher education, jobs for everyone, living wages and all sorts of other promises are just a few of the benefits that MMT can provide. At least, that is how the theory is being sold.”

What’s not to love?

Oh yes, it’s that deficit thing.

Deficits Are Not Self-Financing

The premise of MMT is that government “deficit” spending is not a problem because the spending into “productive investments” pay for themselves over time.

But therein lies the problem – what exactly constitutes “productive investments?”

For government “deficit” spending to be effective, the “payback” from investments made must yield a higher rate of return than the interest rate on the debt used to fund it. 

Examples of such investments range from the Hoover Dam to the Tennessee River Valley Authority. Importantly, “infrastructure spending projects,” must have a long-term revenue stream tied to time. Building roads and bridges to “nowhere,” may create short-term jobs, but once the construction is complete, the economic benefit turns negative.

The problem for MMT is its focus on spending is NOT productive investments but rather social welfare which has a negative rate of return. 

Of course, the Government has been running a “Quasi-MMT” program since 1980.

According to the Center On Budget & Policy Priorities, roughly 75% of every current tax dollar goes to non-productive spending. (The same programs the Democrats are proposing.)

To make this clearer, in 2019, the Federal Government spent $4.8 Trillion, which was equivalent to 22% of the nation’s entire nominal GDP. Of that total spending, ONLY $3.6 Trillion was financed by Federal revenues, and $1.1 trillion was financed through debt.

In other words, if 75% of all expenditures go to social welfare and interest on the debt, those payments required $3.6 Trillion, or roughly 99% of the total revenue coming in. 

There is also clear evidence that increasing debts and deficits DO NOT lead to either stronger economic growth or increasing productivity. As Michael Lebowitz previously showed:

“Since 1980, the long term average growth rate of productivity has stagnated in a range of 0 to 2% annually, a sharp decline from the 30 years following WWII when productivity growth averaged 4 to 6%. While there is no exact measure of productivity, total factor productivity (TFP) is considered one of the best measures. Data for TFP can found here.

The graph below plots a simple index we created based on total factor productivity (TFP) versus the ten-year average growth rate of TFP. The TFP index line is separated into green and red segments to highlight the change in the trend of productivity growth rate that occurred in the early 1970’s. The green dotted line extrapolates the trend of the pre-1972 era forward.”

“The plot of the 10-year average productivity growth (black line) against the ratio of total U.S. credit outstanding to GDP (green line) is telling.”

“This reinforces the message from the other debt-related graphs – over the last 30-years the economy has relied more upon debt growth and less on productivity to generate economic activity.

The larger the balance of debt has become, the more economically destructive it is by diverting an ever-growing amount of dollars away from productive investments to service payments.

Since 2008, the economy has been growing well below its long-term exponential trend. Such has been a consistent source of frustration for both Obama, Trump, and the Fed, who keep expecting higher rates of economic only to be disappointed.

The relevance of debt growth versus economic growth is all too evident. When debt issuance exploded under the Obama administration, and accelerated under President Trump, it has taken an ever-increasing amount of debt to generate $1 of economic growth.

Another way to view the impact of debt on the economy is to look at what “debt-free” economic growth would be. In other words, without debt, there has been no organic economic growth.

For the 30-years, from 1952 to 1982, the economic surplus fostered a rising economic growth rate, which averaged roughly 8% during that period. Today, with the economy expected to grow at just 2% over the long-term, the economic deficit has never been higher. If you subtract the debt, there has not been any organic economic growth since 1990. 

What is indisputable is that running ongoing budget deficits that fund unproductive growth is not economically sustainable long-term.

The End Game Cometh

Over the last 40-years, the U.S. economy has engaged in increasing levels of deficit spending without the results promised by MMT.

There is also a cost to MMT we have yet to hear about from its proponents.

The value of the dollar, like any commodity, rises and falls as the supply of dollars change. If the government suddenly doubled the money supply, one dollar would still be worth one dollar but it would only buy half of what it would have bought prior to their action.

This is the flaw MMT supporters do not address.

MMT is not a free lunch.

MMT is paid for by reducing the value of the dollar and ergo your purchasing power. MMT is a hidden tax paid by everyone holding dollars. The problem, as Michael Lebowitz outlined in Two Percent for the One Percent, inflation tends to harm the poor and middle class while benefiting the wealthy.

This is why the wealth gap is more pervasive than ever. Currently, the Top 10% of income earners own nearly 87% of the stock market. The rest are just struggling to make ends meet.

As I stated above, the U.S. has been running MMT for the last three decades, and has resulted in social inequality, disappointment, frustration, and a rise in calls for increasing levels of socialism.

It is all just as you would expect from such a theory put into practice, and history is replete with countries that have attempted the same. Currently, the limits of profligate spending in Washington has not been reached, and the end of this particular debt story is yet to be written.

But, it eventually will be.

SOTM 2020: State Of The Markets

“I am thrilled to report to you tonight that our economy is the best it has ever been.” – President Trump, SOTU

In the President’s “State of the Union Address” on Tuesday, he used the podium to talk up the achievements in the economy and the markets.

  • Low unemployment rates
  • Tax cuts
  • Job creation
  • Economic growth, and, of course,
  • Record high stock markets.

While it certainly is a laundry list of items he can claim credit for, it is the claim of record-high stock prices that undermines the rest of the story.

Let me explain.

The stock market should be a reflection of actual economic growth. Since corporate earnings are derived primarily from consumptive spending, corporate investments, and imports and exports, actual economic activity should be reflected in the price investors are willing to pay for the earnings being generated.

For the majority of the 20th century, this was indeed the case as corporate earnings were reflective of economic activity. The chart below shows the annual change in reported earnings, nominal GDP, and the price of the S&P 500.

Not surprisingly, as the economy grew at 6.47% annually, earnings also grew at 6.68% annually as would be expected. Since investors are willing to a premium for earnings growth, the S&P 500 grew at 9% annually over that same period.

Importantly, note that long-term economic growth has averaged 6% annually. However, as shown in the lower panel, economic growth has been running below the long-term average since 2000, but has been substantially weaker since 2007, growing at just 2% annually.

The next chart shows this weaker growth more clearly. Since the financial crisis, economic growth has failed to recover back to its long-term exponential growth trend. However, reported earnings are exceedingly deviated from what actual underlying economic growth can generate. This is due to a decade of accounting gimmickry, share buybacks, wage suppression, low interest rates, and high corporate debt levels.

The next chart looks at the deviation by looking at the market itself versus long-term economic growth. The S&P 500 and GDP have been scaled to 100, and displayed on a log-scale for comparative purposes.

The current growth trend of the economy is running well below its long-term exponential trend, but the S&P 500 is currently at the most significant deviation from that growth on record. (It should be noted that while these deviations from economic growth can last for a long-time, the eventual mean reversion always occurs.)

The Spending Mirage

Take a look at the following chart.

While the President’s claims of an exceptionally strong economy rely heavily on historically low unemployment and jobless claims numbers, historically high levels of asset prices, and strong consumer spending trends, there is an underlying deterioration which goes unaddressed.

So, here’s your pop quiz?

If consumer spending is strong, AND unemployment is near the lowest levels on record, AND interest rates are low, AND job creation is high – then why is the economy only growing at 2%?

Furthermore, if the economy was doing as well as government statistics suggest, then why does the Federal Reserve need to continue providing the economy with “emergency measures,” cutting rates, and giving “verbal guidance,” to keep the markets from crashing?

The reality is that if it wasn’t for the Government running a massive trillion-dollar fiscal deficit, economic growth would actually be recessionary.

In GDP accounting, consumption is the largest component. Of course, since it is impossible to “consume oneself to prosperity,” the ability to consume more is the result of growing debt. Furthermore, economic growth is also impacted by Government spending, as government transfer payments, including Medicaid, Medicare, disability payments, and SNAP (previously called food stamps), all contribute to the calculation.

As shown below, between the Federal Reserve’s monetary infusions and the ballooning government deficit, the S&P 500 has continued to find support.

However, nothing is “produced” by those transfer payments. They are not even funded. As a result, national debt rises every year, and that debt adds to GDP.

Another way to look at this is through tax receipts as a percentage of GDP.  If the economy was indeed “the strongest ever,” then we should see an increase in wage growth commensurate with increased economic activity. As a result of higher wages, there should be an increase in the taxes collected by the Government from wages, consumption, imports, and exports.

See the problem here?

Clearly, this is not the case as tax receipts as a percentage of GDP peaked in 2012, and have now declined to levels which historically are more coincident with economic recessions, rather than expansions. Yet, currently, because of the artificial interventions, the stock market remains well detached from what economic data is actually saying.

Corporate Profits Tell The Real Story

When it comes to the state of the market, corporate profits are the best indicator of economic strength.

The detachment of the stock market from underlying profitability guarantees poor future outcomes for investors. But, as has always been the case, the markets can certainly seem to “remain irrational longer than logic would predict,” but it never lasts indefinitely.

Profit margins are probably the most mean-reverting series in finance, and if profit margins do not mean-revert, then something has gone badly wrong with capitalism. If high profits do not attract competition, there is something wrong with the system, and it is not functioning properly.” – Jeremy Grantham

As shown, when we look at inflation-adjusted profit margins as a percentage of inflation-adjusted GDP, we see a clear process of mean-reverting activity over time. Of course, those mean reverting events are always coupled with recessions, crises, or bear markets.

More importantly, corporate profit margins have physical constraints. Out of each dollar of revenue created, there are costs such as infrastructure, R&D, wages, etc. Currently, the biggest contributors to expanding profit margins has been the suppression of employment, wage growth, and artificially suppressed interest rates, which have significantly lowered borrowing costs. Should either of the issues change in the future, the impact to profit margins will likely be significant.

The chart below shows the ratio overlaid against the S&P 500 index.

I have highlighted peaks in the profits-to-GDP ratio with the green vertical bars. As you can see, peaks, and subsequent reversions, in the ratio have been a leading indicator of more severe corrections in the stock market over time. This should not be surprising as asset prices should eventually reflect the underlying reality of corporate profitability.

It is often suggested that, as mentioned above, low interest rates, accounting rule changes, and debt-funded buybacks have changed the game. While that statement is true, it is worth noting that each of those supports are artificial and finite.

Another way to look at the issue of profits as it relates to the market is shown below. When we measure the cumulative change in the S&P 500 index as compared to the level of profits, we find again that when investors pay more than $1 for a $1 worth of profits, there is an eventual mean reversion.

The correlation is clearer when looking at the market versus the ratio of corporate profits to GDP. (Again, since corporate profits are ultimately a function of economic growth, the correlation is not unexpected.) 

It seems to be a simple formula for investors that as long as the Fed remains active in supporting asset prices, the deviation between fundamentals and fantasy doesn’t matter. 

However, investors are paying more today than at any point in history for each $1 of profit, which history suggests will not end well.

While the media is quick to attribute the current economic strength, or weakness, to the person who occupies the White House, the reality is quite different.

The political risk for President Trump is taking too much credit for an economic cycle which was already well into recovery before he took office. Rather than touting the economic numbers and taking credit for liquidity-driven financial markets, he should be using that strength to begin the process of returning the country to a path of fiscal discipline rather than a “drunken binge” of government spending.

With the economy, and the financial markets, sporting the longest-duration in history, simple logic should suggest time is running out.

This isn’t doom and gloom, it is just a fact.

Politicians, over the last decade, failed to use $33 trillion in liquidity injections, near-zero interest rates, and surging asset prices to refinance the welfare system, balance the budget, and build surpluses for the next downturn.

Instead, they only made the deficits worse, and the U.S. economy will enter the next recession pushing a $2 Trillion deficit, $24 Trillion in debt, and a $6 Trillion pension gap, which will devastate many in their retirement years.

While Donald Trump talked about “Yellen’s big fat ugly bubble” before he took office, he has now pegged the success of his entire Presidency on the stock market.

It will likely be something he eventually regrets.

“Then said Jesus unto him, Put up again thy sword into his place: for all they that take the sword shall perish with the sword.” – Matthew 26, 26:52

Economic Theories & Debt Driven Realities

One of the most highly debated topics over the past few months has been the rise of Modern Monetary Theory (MMT). The economic theory has been around for quite some time but was shoved into prominence recently by Congressional Representative Alexandria Ocasio-Cortez’s “New Green Deal” which is heavily dependent on massive levels of Government funding.

There is much debate on both sides of the argument but, as is the case with all economic theories, supporters tend to latch onto the ideas they like, ignore the parts they don’t, and aggressively attack those who disagree with them. However, what we should all want is a robust set of fiscal and monetary policies which drive long-term economic prosperity for all.

Here is the problem with all economic theories – they sound great in theory, but in practice, it has been a vastly different outcome. For example, when it comes to deficits, John Maynard Keynes contended that:

“A general glut would occur when aggregate demand for goods was insufficient, leading to an economic downturn resulting in losses of potential output due to unnecessarily high unemployment, which results from the defensive (or reactive) decisions of the producers.”

In other words, when there is a lack of demand from consumers due to high unemployment, then the contraction in demand would force producers to take defensive actions to reduce output. Such a confluence of actions would lead to a recession.

In such a situation, Keynesian economics states that government policies could be used to increase aggregate demand, thus increasing economic activity and reducing unemployment and deflation. Investment by government injects income, which results in more spending in the general economy, which in turn stimulates more production and investment involving still more income and spending and so forth. The initial stimulation starts a cascade of events, whose total increase in economic activity is a multiple of the original investment.

Unfortunately, as shown below, economists, politicians, and the Federal Reserve have simply ignored the other part of the theory which states that when economic activity returns to normal, the Government should return to a surplus. Instead, the general thesis has been:

“If a little deficit is good, a bigger one should be better.”

As shown, politicians have given up be concerned with deficit reduction in exchange for the ability to spend without constraint.

However, as shown below, the theory of continued deficit spending has failed to produce a rising trend of economic growth.

When it comes to MMT, once again we see supporters grasping onto the aspects of the theory they like and ignoring the rest. The part they “like” sounds a whole lot like a “Turbotax” commercial:

The part they don’t like is:

“The only constraint on MMT is inflation.”

That constraint would come as, the theory purports, full employment causes inflationary pressures to rise. Obviously, at that point, the government could/would reduce its support as the economy would theoretically be self-sustaining.

However, as we questioned previously, the biggest issue is HOW EXACTLY do we measure inflation?

This is important because IF inflation is the ONLY constraint on debt issuance and deficits, then an accurate measure of inflation, by extension, is THE MOST critical requirement of the theory.

In other words:

“Where is the point where the policy must be reversed BEFORE you cause serious, and potentially irreversible, negative economic consequences?”

This is the part supporters dislike as it imposes a “limit” on spending whereas the idea of unconstrained debt issuance is far more attractive.

Again, there is no evidence that increasing debts or deficits, inflation or not, leads to stronger economic growth.

However, there is plenty of evidence which shows that rising debts and deficits lead to price inflation. (The chart below uses the consumer price index (CPI) which has been repeatedly manipulated and adjusted since the late 90’s to suppress the real rate of inflationary pressures in the economy. The actual rate of inflation adjusted for a basket of goods on an annual basis is significantly higher.) 

Of course, given the Government has already been running a “quasi-MMT” program for the last 30-years, the real impact has been a continued shift of dependency on the Government anyway. Currently, one-in-four households in the U.S. have some dependency on government subsidies with social benefits as a percentage of real disposable income at record highs.

If $22 trillion in debt, and a deficit approaching $1 trillion, can cause a 20% dependency on government support, just imagine the dependency that could be created at $40 trillion?

If the goal of economic policy is to create stronger rates of economic growth, then any policy which uses debt to solve a debt problem is most likely NOT the right answer.

This is why proponents of Austrian economics suggest trying something different – less debt. Austrian economics suggests that a sustained period of low interest rates and excessive credit creation results in a volatile and unstable imbalance between saving and investment. In other words, low interest rates tend to stimulate borrowing from the banking system which in turn leads, as one would expect, to the expansion of credit. This expansion of credit then creates an expansion of the supply of money.

Therefore, as one would ultimately expect, the credit-sourced boom becomes unsustainable as artificially stimulated borrowing seeks out diminishing investment opportunities. Finally, the credit-sourced boom results in widespread malinvestments. When the exponential credit creation can no longer be sustained a “credit contraction” occurs which ultimately shrinks the money supply and the markets finally “clear” which causes resources to be reallocated back towards more efficient uses.

Time To Wake Up

For the last 30 years, each Administration, along with the Federal Reserve, have continued to operate under Keynesian monetary and fiscal policies believing the model worked. The reality, however, has been most of the aggregate growth in the economy has been financed by deficit spending, credit expansion and a reduction in savings. In turn, the reduction of productive investment into the economy has led to slowing output. As the economy slowed and wages fell the consumer was forced to take on more leverage which also decreased savings. As a result of the increased leverage, more of their income was needed to service the debt.

Secondly, most of the government spending programs redistribute income from workers to the unemployed. This, Keynesians argue, increases the welfare of many hurt by the recession. What their models ignore, however, is the reduced productivity that follows a shift of resources toward redistribution and away from productive investment.

In its essential framework, MMT suggests correctly that debts and deficits don’t matter as long as the money being borrowed and spent is used for productive purposes. Such means that the investments being made create a return greater than the carrying cost of the debt used to finance the projects.

Again, this is where MMT supporters go astray. Free healthcare, education, childcare, living wages, etc., are NOT a productive investments which have a return greater than the carrying cost of the debt. In actuality, history suggests these welfare supports have a negative multiplier effect in the economy.

What is most telling is the inability for the current economists, who maintain our monetary and fiscal policies, to realize the problem of trying to “cure a debt problem with more debt.”

This is why the policies that have been enacted previously have all failed, be it “cash for clunkers” to “Quantitative Easing”, because each intervention either dragged future consumption forward or stimulated asset markets. Dragging future consumption forward leaves a “void” in the future which must be continually filled, This is why creating an artificial wealth effect decreases savings which could, and should have been, used for productive investment.

The Keynesian view that “more money in people’s pockets” will drive up consumer spending, with a boost to GDP being the end result, has been clearly wrong. It hasn’t happened in 30 years.

MMT supporters have the same view that if the government hands out money it will create stronger economic growth. There is not evidence which supports such is actually the case.

It’s time for those driving both monetary and fiscal policy to wake up. The current path we are is unsustainable. The remedies being applied today is akin to using aspirin to treat cancer. Sure, it may make you feel better for the moment, but it isn’t curing the problem.

Unfortunately, the actions being taken today have been repeated throughout history as those elected into office are more concerned about satiating the mob with bread and games” rather than suffering the short-term pain for the long-term survivability of the empire. In the end, every empire throughout history fell to its knees under the weight of debt and the debasement of their currency.

It’s time we wake up and realize that we too are on the same path.