Tag Archives: buy and hold

A Black Swan In The Ointment

A good person is as rare as a black swan”- Decimus Juvenal

In 2007, Nassim Taleb wrote a bestselling and highly impactful book titled The Black Swan: The Impact of the Highly Improbable. The book uses the analogy of a black swan to describe negative events that appear to be very rare and occur without warning.  Since the book was published, the term black swan has been overused to describe all kinds of events that were predictable to some degree.

Last April, we wrote A Fly in the Ointment, which was one of a few articles that pointed out the risk of higher inflation to the markets and economy. Thinking about inflation in the context of the Corona Virus and the Fed’s aggressive monetary policy, might our fly be a black swan.

Corona Virus

The economic impact of the Corona Virus has been negligible thus far in the U.S., but in a growing list of other countries, the impact is high. In China, cities more populated than New York City are being quarantined. Citizens are being told to stay at home, and schools, factories, and shops are closed. Japan just closed all of its schools for at least a month. Airlines have reduced or suspended flights to these troubled regions.

From an inflation perspective, the impact of these actions will be two-fold.

Consumers and businesses will spend less, especially on elastic goods. Elastic goods are products that are easy to forego or replace with another good. Examples are things like movies, coffee at Starbucks, cruises, and other non-necessities. Inelastic goods are indispensable or those with no suitable replacement. Examples are essential medicines, water, and food. Many items fall somewhere between perfectly elastic and perfectly inelastic, and in many cases, the classification is dependent upon the consumer.

On the supply side of the inflation equation, production suspensions are leading to shortages of parts and final goods. Companies must either do without them and slow/suspend production or find new and more expensive sources.

We are purposely leaving out the role that the supply of money plays in inflation for now.

With that as a backdrop, we pose the following questions to help you assess how the virus may impact prices.

  • Will producers of elastic goods lower prices if demand falters?
  • If so, will lower prices induce more consumption?
  • Can producers lower the prices of goods if the cost to produce those goods rise?
  • How much margin compression can companies tolerate?
  • Will producers of inelastic goods try to pass on the higher costs of goods, due to supply chain problems, to consumers?
  • Inflationary or deflationary?

We do not have the answers to the questions but make no mistake; inflation related to hampered supply lines could more than offset weakened demand and pose a real inflation risk.

The Fed’s Conundrum

Monetary policy has a direct impact on prices. To quote from our recent article, Jerome Powell & The Fed’s Great Betrayal:

“One of the most pernicious of these issues in our “modern and sophisticated” intellectual age is that of inflation. Most people, when asked to define inflation, would say “rising prices” with no appreciation for the fact that price movements are an effect, not a cause. They are a symptom of monetary circumstances. Inflation defined is, in fact, a disequilibrium between the amount of currency entering an economic system relative to the productive output of that same system.”

For the past decade, the Fed has consistently sought to generate more inflation. They have kept interest rates lower than normal given the tepid economic growth trends. Further, they employed four rounds of QE. QE provides reserves to banks, which increases their ability to create money. Easy money policies, the type we have grown accustomed to, is designed to increase inflation.

On March 3, 2020, the Fed cut interest rates to try to offset the negative economic impact of the Corona Virus.  How lower interest rates will cure a disease is a question for another day. Today’s big question is the Fed fueling the embers of inflation with this sudden rate cut?

Enter the Black Swan

What would the Fed need to do if inflation were to rise due to compromised supply lines and overly aggressive Fed actions? If inflation becomes a problem, they would need to do the opposite of what they have been doing, raise interest rates and reduce the assets on their balance sheet (QT).

Such policy worked well in the 1970s when Fed Chairman Paul Volker increased Fed Funds to 20% and restricted money supply to bring down double-digit inflation. Today, however, such a prudent policy response would be incredibly problematic due to the massive amount of debt the U.S. and its citizens have accumulated. The graph below shows that there is about three and a half times more debt than annual economic activity currently in the U.S.

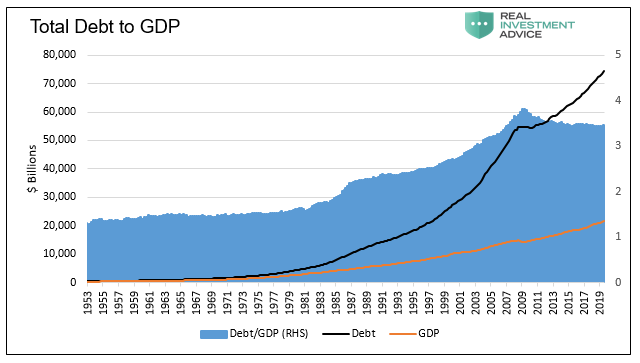
Unlike the 1970s, when household, corporate, and public debt levels were much lower, higher interest rates and less liquidity today would inevitably result in massive defaults by both consumers and corporations. Further, it would cause a surge in the Federal budget deficit as interest expense on U.S. Treasury debt would rise.

Over the last few decades, we have seen a steady decline in interest rates. At times in this cycle, rates have risen moderately. Each time this occurred, a crisis developed as funding problems arose. What would happen today if mortgage rates rose to 7% and auto loans to 5%? What would happen to corporate profits if borrowing rates doubled from current levels? How would corporations that depend on routine, cheap refinancing of their debt obtain it?

In such an environment, taking on new debt would be much less appealing and servicing existing debt would require a larger portion of the budget. Clearly, an inflationary outbreak accompanied by higher interest rates would result in a severe recession.

Summary

What is a black swan? A black swan is an unforeseen event like the rapid spreading of the Corona Virus that results in inflation. It is not the obvious outcome but rather an obscure second or third-order effect. Our modern economic policy framework is not designed for inflation, nor are many people even thinking about it as a possibility. That is a black swan.  

Inflation is the one thing that prevents the Fed and other central banks from supporting the economy and markets in the way they have become accustomed.

As discussed in prior articles, we believe there is ample evidence of problematic inflation data for those who choose to look. At the same time, global central bankers continue to engage in imprudent policies that are inflationary in nature. Lastly, the Corona Virus threatens to hamper supply lines and change consumer spending habits.

Whether or not those factors result in inflation is unknown. Although one cannot predict the future, one can prepare for it. Inflation is not dead, but it has been hibernating for decades. Even if the odds of inflation are relatively low, that does not mean we should ignore them. As the sub-title to Taleb’s book says, “The Impact of the Highly Improbable” can be important. An event that has a 1% chance of occurring but would cause a massive loss of wealth should not be ignored.

Why You Should Question “Buy And Hold” Advice

I recently received an email from an individual that contained the following bit of portfolio advice from a major financial institution:

“Despite the tumble to begin this year, investors should not panic. Over the long-term course of the markets, investors who have remained patient have been rewarded. Since 1900, the average return to investors has been almost 10% annually…our advice is to remain invested, avoid making drastic movements in your portfolio, and ignore the volatility.”

First of all, as shown in the chart below, the advice given is not entirely wrong – since 1900, the markets have indeed averaged roughly 10% annually (including dividends). However, that figure falls to 8.08% when adjusting for inflation.

SP500-Real-Nominal-TotalReturns-012416

It’s pretty obvious, by looking at the chart above, that you should just invest heavily in the market and “fughetta’ bout’ it.”

If it was only that simple.

There are TWO MAJOR problems with the advice given above.

First, while over the long-term the average rate of return may have been 10%, the markets did not deliver 10% every single year. As I discussed just recently, a loss in any given year destroys the “compounding effect:”

“Let’s assume an investor wants to compound their investments by 10% a year over a 5-year period.

Math-Of-Loss-10pct-Compound-011916

The “power of compounding” ONLY WORKS when you do not lose money. As shown, after three straight years of 10% returns, a drawdown of just 10% cuts the average annual compound growth rate by 50%. Furthermore, it then requires a 30% return to regain the average rate of return required. In reality, chasing returns is much less important to your long-term investment success than most believe.”

Here is another way to view the difference between what was “promised,” versus what “actually” happened. The chart below takes the average rate of return, and price volatility, of the markets from the 1960’s to present and extrapolates those returns into the future.

SP500-Promised-vs-Real-012516

When imputing volatility into returns, the differential between what investors were promised (and this is a huge flaw in financial planning) and what actually happened to their money is substantial over the long-term.

The second point, and probably most important, is that YOU DIED long before you realized the long-term average rate of return.

The Problem With Long-Term

Let’s consider the following facts in regards to the average American. The national average wage index for 2014 is 46,481.52 which is lower than the $50,000 needed to maintain a family of four today.

  • 63% of can’t deal with a $500 emergency
  • 76% have less than $100,000; and
  • 90% have less than $250,000 saved.

If we assume that the average retired couple will need $40,000 a year in income to live through their “golden years” they will need roughly $1 million dollars generating 4% a year in income.  Therefore, 90% of American workers today have a problem.

However, what about those already retired? Given the boom years of the 80’s and 90’s that group of “baby boomers” should be better off, right?  Not really.

  • 54% have less than $25,000 in retirement savings
  • 71% have less than $100,000; and
  • 83% have less than $250,000.

(Now you understand why “baby boomers” are so reluctant to take cuts to their welfare programs.)

The average American faces a real dilemma heading into retirement. Unfortunately, individuals only have a finite investing time horizon until they retire.  Therefore, as opposed to studies discussing “long term investing” without defining what the “long term” actually is – it is “TIME” that we should be focusing on.

When I give lectures and seminars I always take the same poll:

“How long do you have until retirement?”

The results are always the same in that the majority of attendee’s have about 15 years until retirement. Wait…what happened to the 30 or 40 years always discussed by advisors?

Think about it for a moment. Most investors don’t start seriously saving for retirement until they are in their mid-40’s. This is because by the time they graduate college, land a job, get married, have kids and send them off to college, a real push toward saving for retirement is tough to do as incomes, while growing, haven’t reached their peak. This leaves most individuals with just 20 to 25 productive work years before retirement age to achieve investment goals. 

Here is the problem. There are periods in history, where returns over a 20-year period have been close to zero or even negative.

20-Year-Forward-Returns-122115

SP500-Rolling-20yr-Returns-122115

This has everything to with valuations and whether multiples are expanding or contracting. As shown in the chart above, real rates of return rise when valuations are expanding from low levels to high levels. But, real rates of return fall sharply when valuations have historically been greater than 23x trailing earnings and have begun to fall.

But the financial institution, unwilling to admit defeat at this point, and trying to prove their point about the success of long-term investing, drags out the following long-term, logarithmic, chart of the S&P 500. At first glance, the average investor would agree.

SP500-1963-Present-Real-Log-012416

However, the chart is VERY misleading as it only looks at data from 1963 onward and there are several problems:

1) If you started investing in 1963, at the end of 1983 you had less money than you started with. (20 Years)  

2) From 1983 to 2000 the markets rose during one of the greatest bull markets in history due to a unique collision of variables, falling interest rates and inflation and consumers leveraging debt, which supported a period of unprecedented multiple (valuation) expansion. (18 years)  

3) From 2000 to Present – the unwinding of the stock market bubble, excess credit and speculation have led to very low annual returns, both a nominal and real, for many investors. (15 years and counting).

So, as you can see, it really depends on WHEN you start investing. This is clearly shown in the chart below of long-term secular full-market cycles.

SP500-Full-Market-Cycles-010516

Here is the critical point. The MAJORITY of the returns from investing came in just 4 of the 8 major market cycles since 1871. Every other period yielded a return that actually lost out to inflation during that time frame.

The critical factor was being lucky enough to be invested during the correct cycle.  With this in mind, this is where the financial institutions commentary goes awry with selective data mining:

“Among the key findings: On average, participants who kept contributing to their retirement plans throughout the 18-month period (October 2008–March 2010) had higher account balances than those who stopped contributing; Participants who maintained a portion of their retirement plan asset in equities throughout the entire period ended up with higher account balances than those who reduced their equity exposure amid the peak period of market distress.

SP500-Price-2006-Present-012416

Thus, retirement investors who kept contributing to their plan and who maintained some exposure to equities throughout the period were better off throughout the market’s 18-month bust-boom period than those who moved in and out of the market in an attempt to avoid losses. Retirement investors who kept exposure to equities amid the peak of the global financial crisis ended up with higher account balances on average than those who reduced their equity exposure to 0%.”

The main problem is the selection of the start and ending period of October, 2008 through March, 2010. As you can see, the PEAK of the financial market occurred a full year earlier in October, 2007. Picking a data point nearly 3/4ths of the way through the financial crisis is a bit egregious.

In reality, it took investors almost SEVEN years, on an inflation-adjusted basis, to get “back to even.”

Every successful investor in history from Benjamin Graham to Warren Buffett have very specific investing rules that they follow and do not break. Yet Wall Street tells investors they can NOT successfully manage their own money and “buy and hold” investing for long term is the only solution.

Why is that?

There is a huge market for “get rich quick” investment schemes and programs as individuals keep hoping to find the secret trick to amassing riches from the market. There isn’t one.  Investors continue to plow hard earned savings into a market hoping to get a repeat shot at the late 90’s investment boom driven by a set of variables that will most likely not exist again in our lifetimes.

Most have been led believe that investing in the financial markets is their only option for retiring. Unfortunately, they have fallen into the same trap as most pension funds which is that market performance will make up for a “savings” shortfall.

However, the real world damage that market declines inflict on investors, and pension funds, hoping to garner annualized 8% returns to make up for the lack of savings is all too real and virtually impossible to recover from. When investors lose money in the market it is possible to regain the lost principal given enough time, however, what can never be recovered is the lost “time” between today and retirement.  “Time” is extremely finite and the most precious commodity that investors have.

With the economy on a brink of third recession this century, without further injections from the Fed to boost asset prices, stocks are poised to go lower. During an average recessionary period, stocks lose on average 33% of their value. Such a decline would set investors back more than 5-years from their investment goals.

This leads to the real question.

“Is your personal investment time horizon long enough to offset such a decline and still achieve your goals?”

In the end – yes, emotional decision making is very bad for your portfolio in the long run. However, before sticking your head in the sand, and ignoring market risk based on an article touting “long-term investing always wins,” ask yourself who really benefits?

As an investor, you must have a well-thought-out investment plan to deal with periods of heightened financial market turmoil. Decisions to move in and out of an asset class must be made logically and unemotionally. Having a disciplined portfolio review process that considers how various assets should be allocated to suit one’s investment objectives, risk tolerance, and time horizon is the key to long-term success.

Emotions and investment decisions are very poor bedfellows. Unfortunately, the majority of investors make emotional decisions because, in reality, very FEW actually have a well-thought-out investment plan including the advisors they work with. Retail investors generally buy an off-the-shelf portfolio allocation model that is heavily weighted in equities under the illusion that over a long enough period of time they will somehow make money. Unfortunately, history has been a brutal teacher about the value of risk management. 

Lance Roberts

lance_sig

Lance Roberts is a Chief Portfolio Strategist/Economist for Clarity Financial. He is also the host of “The Lance Roberts Show” and Chief Editor of the “Real Investment Advice” website and author of “Real Investment Daily” blog and “Real Investment Report“. Follow Lance on Facebook, Twitter and Linked-In