Tag Archives: bull

Robertson: When “Stuff” Gets Real

We all can be tempted to follow the path of least resistance and in a competitive world there are always incentives to get the most bang for the buck. Often this means taking shortcuts to gain some advantage. In a forgiving world, the penalties for such transgressions tend to be small but the rewards can be significant. When conditions are extremely forgiving, shortcuts can become so pervasive that failing to take them can be a competitive disadvantage.

In a less forgiving world, however, the deal gets completely flipped around and penalties can be significant for those who take shortcuts. This will be important for investors to keep in mind as rapidly weakening economic fundamentals and increasing stress in financial markets make for far less forgiving conditions. When things get real, competence and merit matter again – and this is a crucial lesson for investors.

Leaders of companies and organizations normally receive a lot of attention and rightly so; their decisions and behaviors affect a lot people. In the best of situations, leaders can distinguish themselves by creatively finding a “third” way to resolve difficult challenges. In other situations, however, leaders can reveal all-too-human weakness by taking shortcuts, cheating, and acting excessively in their own self-interest.

One of the situations in which these weaknesses can be spotted is in whistleblower incidents. For example, the Financial Times reported on the illuminating experiences of one HR director who in successive jobs was requested to break rules by a boss:

“Told by a senior manager at a FTSE 100 business to rig a pay review to favour his allies, she refused. ‘After that, he did everything to make my life absolute hell,’ she says. Then, at the first opportunity, he fired her, claiming that she was underperforming. Warned that the company would use its resources to fight her all the way if she took legal action, she accepted a pay-off and left’.” 

“Her next employer asked her to manipulate the numbers for a statutory reporting requirement to make its performance look better. She refused, signed another non-disclosure agreement and resigned.”

As unfortunate as these experiences were, they were not isolated events. The HR director described such incidents as happening “left, right and centre”. The fact that such cases are extremely hard to prosecute in any meaningful way helps explain why they are so pervasive. Columbia law professor John Coffee describes: “It’s extremely difficult to make a case against the senior executives because they don’t get Involved in operational issues. But they can put extreme pressure on the lower echelons to cut costs or hit targets.”

Company employees aren’t the only ones who risk facing hostility for standing for what they believe is right. Anjana Ahuja reports in the FT that scientists can fall victim to the same abuses. As she points out, “Some are targeted by industry or fringe groups; others, as the Scholars at Risk network points out, by their own governments. The academic freedom to tell inconvenient truths is being eroded even in supposed strong holds of democracy.”

Ahuja noted that the Canadian pharmacist and blogger, Olivier Bernard, was chastised for “interrogating the claim that vitamin C injections can treat cancer.”  As a consequence of his efforts, “He endured death threats” and “opponents demanded his sacking.”

In yet another example, Greece’s former chief statistician Andreas Georgiou “has been repeatedly convicted, and acquitted on appeal, of manipulating data.” The rationale for such a harsh response has nothing to do with merit: “statisticians worldwide insist that Mr Georgiou has been victimised for refusing to massage fiscal numbers.” It is simply a higher profile case of refusing to be complicit in wrongdoing.

The lessons from these anecdotes also play out across the broader population. The FT reports:

“According to the [CIPD human resources survey], 28 per cent of HR personnel perceive a conflict between their professional judgment and what their organisation expects of them; the same proportion feel ‘it’s often necessary to compromise ethical values to succeed in their organisation’.”

Employees are all-too familiar with the reality that such compromises may be required simply to survive in an organization and to continue getting health insurance: “Most HR directors know colleagues who have been fired for standing their ground.”

Yet another arena in which expertise and values get compromised is politics. While political rhetoric nearly always involves exaggerations and simplifications, the cost of such manipulations becomes apparent when important issues of public policy are at stake. Bill Blain highlighted this point on Zerohedge:

“It’s as clear as a bell that Trump had no plan to address the Coronavirus before he was finally forced to say something Monday [March 9, 2020]. Until then it was a ‘fake-news’ distraction. He made a political gamble: that the virus would recede before it became a crisis, making him look smart and a market genius for calling it.”

Blain’s assessment illustrates a point that is common to all these examples: Each involves a calculation as to whether it is worth it or not to do the right thing based on merit or to take a shortcut. Each involves an intentional effort to reject/deny/attack positions that are real and valid. Evidence, expertise and professional judgment are foresworn and replaced by narrative, heuristics, and misinformation. While such tactics undermine the long-term success of organizations and societies, they can yield tremendous personal advantages. The good of the whole is sacrificed for the good of the few.

Another point is that these efforts are absolutely pervasive. They can be found across companies, academia, politics, and beyond. They can also be found in countries all across the world. In an important sense, we have been living in an environment of pervasive tolerance of such decisions.

A third point, and the most important one, is that now it is starting to matter. It appears that the real human impact of the coronavirus has shaken many people out of complacency. The types of narratives and misinformation regarding the market that had been accepted suddenly seem woefully out of place when dealing with a real threat to public health. As Janan Ganesh reports in the FT, “This year provides a far less hospitable atmosphere for such hokum than 2016”. He concludes, “Overnight, competence matters.”

True enough, but Ganesh could have gone further. Suddenly, additional traits such as courage, good judgment, and ethical behavior also matter. Overnight, carelessness and complacency have become much more costly.

All these things will become extremely important for investors as well. For example, information sources are crucial for early identification of potential problems and for proper diagnosis. Most mainstream news outlets were slow to report on the threat of the coronavirus even though it was clearly a problem in China in January. By far the best sources on this issue have been a handful of independent researchers and bloggers who have shared their insights publicly.

One form of news that will be interesting to monitor is upcoming earnings reports and conference calls. These events can provide an opportunity to learn about companies as well as to learn about management’s philosophy and decision-making.

Which companies are busily responding to the crisis by scrutinizing their supply chains and developing HR policies to ensure the safety of their employees? Which companies already had these measures in place and are simply executing on them now? Which companies are withdrawing guidance while they frantically try to figure out what’s going on? These responses will reveal a great deal about management teams and business models.

In addition, a much higher premium on merit will also place much higher premia on security analysis, valuation, and risk management. Alluring stories about stocks and narratives about the market can be fun to follow and even compelling. At the end of the day, however, what really matters is streams of cash flows.

Finally, a higher premium on merit is likely to significantly re-order the ranks of advisors and money managers. Those ridiculed as “overly cautious” and “perma bears” will emerge as valuable protectors of capital. Conversely, those arguing that there is no alternative (TINA) to equities will be spending a lot of time trying to pacify (and retain) angry clients who suffer big losses. Further, things like education, training, and experience will re-emerge as necessary credentials for investment professionals.

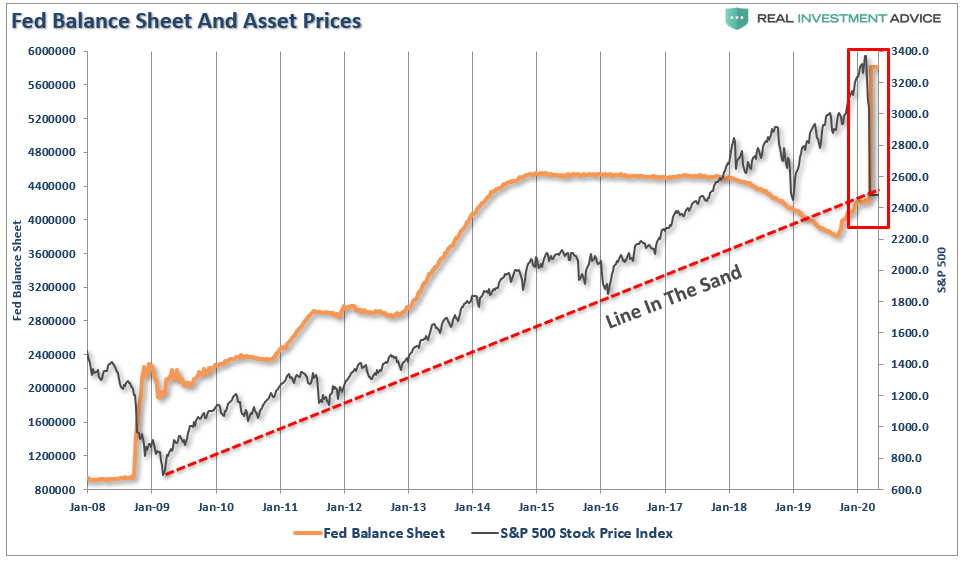
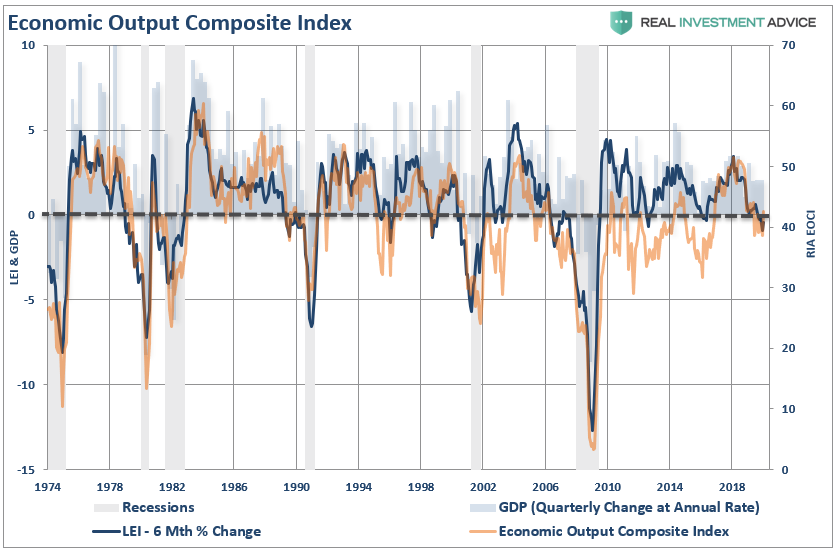
As the coronavirus continues to spread across the US, things are starting to get real for many investors. Suddenly, the world is appearing less forgiving as it is becoming clear that economic growth will slow substantially for some period of time. This especially exposes the many companies who have binged on debt while rates have been so low. Further, it is becoming increasingly obvious that there is very little the Fed can do with monetary policy to stimulate demand.

While the coronavirus will eventually dissipate, the increasing premium on merit is likely to hang around. The bad news is that in many cases it will be too late to avoid the harm caused by leaders and managers and advisors who exploited favorable conditions for personal advantage. The good news is that there are very competent people out there to make the best of things going forward.

Technically Speaking: Risk Limits Hit, When Too Little Is Too Much

For the last several months, we have been issuing repeated warnings about the market. While such comments are often mistaken for “being bearish,” we have often stated it is our process of managing “risk” which is most important.

Beginning in mid-January, we began taking profits out of our portfolios and reducing risk. To wit:

“On Friday, we began the orderly process of reducing exposure in our portfolios to take in profits, reduce portfolio risk, and raise cash levels.”

Importantly, we did not “sell everything” and go to cash.

Since then, we took profits and rebalanced risk again in late January and early February as well.

Our clients, their families, their financial and emotional “well being,” rest in our hands. We take that responsibility very seriously, and work closely with our clients to ensure that not only are they financially successful, but they are emotionally stable in the process.

This is, and has been, our biggest argument against “buy and hold,” and “passive investing.” While there are plenty of case studies showing why individuals will eventually get back to even, the vast majority of individuals have a “pain point,” where they will sell.

So, we approach portfolio management from a perspective of “risk management,” but not just in terms of “portfolio risk,” but “emotional risk” as well. By reducing our holdings to raise cash to protect capital, we can reduce the risk of our clients hitting that “threashold” where they potentially make very poor decisions.

In investing, the worst decisions are always made at the moment of the most pain. Either at the bottom of the market or near the peaks. 

Investing is not always easy. Our portfolios are designed to have longer-term holding periods, but we also understand that things do not always go as planned.

This is why we have limits, and when things go wrong, we sell.

So, why do I tell you this?

On Friday/Monday, our “limits” were breached, which required us to sell more.

Two Things

Two things have now happened, which signaled us to reduce risk further in portfolios.

On Sunday, the Federal Reserve dropped a monetary “nuclear bomb,” on the markets. My colleague Caroline Baum noted the details:

“After an emergency 50-basis-point rate cut on March 3, the Federal Reserve doubled down Sunday evening, lowering its benchmark rate by an additional 100 basis points to a range of 0%-0.25% following another emergency meeting.

After ramping up its $60 billion of monthly Treasury bill purchases to include Treasuries of all maturities and offering $1.5 trillion of liquidity to the market via repurchase agreements on March 3, the Fed doubled down Sunday evening with announced purchases of at least $500 billion of Treasuries and at least $200 billion of agency mortgage-backed securities.

In addition, the Fed reduced reserve requirements to zero, encouraged banks to borrow from its discount window at a rate of 0.25%, and, in coordination with five other central banks, lowered the price of U.S. dollar swap arrangements to facilitate dollar liquidity abroad”

We had been anticipating the Federal Reserve to try and rescue the markets, which is why we didn’t sell even more aggressively previously. The lesson investors have been taught repeatedly over the last decade was “Don’t Fight The Fed.”

One of the reasons we reduced our exposure in the prior days was out of concern the Fed’s actions wouldn’t be successful. 

On Monday, we found out the answer. The Fed may be fighting a battle it can’t win as markets not only failed to respond to the Fed’s monetary interventions but also broke the “bullish trend line” from the 2009 lows.  (While the markets are oversold short-term, the long-term “sell signals” in the bottom panels are just being triggered from fairly high levels. This suggests more difficulty near-term for stocks. 

This was the “Red Line” we laid out in our Special Report for our RIAPro Subscribers (Risk-Free 30-Day Trial) last week:

“As you can see in the chart below, this is a massive surge of liquidity, hitting the market at a time the market is testing important long-term trend support.”

It is now, or never, for the markets.

With our portfolios already at very reduced equity levels, the break of this trendline will take our portfolios to our lowest levels of exposure.

What happened today was an event we have been worried about, but didn’t expect to see until after a break of the trendline – “margin calls.” This is why we saw outsized selling in “safe assets” such as REITs, utilities, bonds, and gold.

Cash was the only safe place to hide.

We aren’t anxious to “fight the Fed,” but the markets may have a different view this time.

Use rallies to raise cash, and rebalance portfolio risk accordingly.

We are looking to be heavy buyers of equities when the market forms a bottom, we just aren’t there as of yet.”

On Monday morning, with that important trendline broken, we took some action.

  • Did we sell everything? No. We still own 10% equity, bonds, and a short S&P 500 hedge. 
  • Did we sell the bottom? Maybe.

We will only know in hindsight for certain, and we are not willing to risk more of our client’s capital currently. 

There are too many non-quantifiable risks with a global recession looming, as noted by David Rosenberg:

“The pandemic is a clear ‘black swan’ event. There will be a whole range of knock-on effects. Fully 40 million American workers, or one-third of the private-sector labor force, are directly affected ─ retail, entertainment, events, sports, theme parks, conferences, travel, tourism, restaurants and, of course, energy.

This doesn’t include all the multiplier effects on other industries. It would not surprise me at all if real GDP in Q2 contracts at something close to an 8% annual rate (matching what happened in the fourth quarter of 2008, which was a financial event alone).

The hit to GDP can be expected to be anywhere from $400 billion to $600 billion for the year. But the market was in trouble even before COVID-19 began to spread, with valuations and complacency at cycle highs and equity portfolio managers sitting with record-low cash buffers. Hence the forced selling in other asset classes.

If you haven’t made recession a base-case scenario, you probably should. All four pandemics of the past century coincided with recession. This won’t be any different. It’s tough to generate growth when we’re busy “social distancing.” I am amazed that the latest WSJ poll of economists conducted between March 6-10th showed only 49% seeing a recession coming”.

The importance of his commentary is that from an “investment standpoint,” we can not quantify whether this “economic shock” has been priced into equities as of yet. However, we can do some math based on currently available data:

The chart below is the annual change in nominal GDP, and S&P 500 GAAP earnings.

I am sure you will not be shocked to learn that during “recessions,” corporate “earnings’ tend to fall. Historically, the average drawdown of earnings is about 20%; however, since the 1990’s, those drawdowns have risen to about 30%.

As of March 13th, Standard & Poors has earnings estimates for the first quarter of 2020 at $139.20 / share. This is down just $0.20 from the fourth quarter of 2019 estimates of $139.53.

In other words, Wall Street estimates are still in “fantasy land.” 

If our, and Mr. Rosenberg’s, estimates are correct of a 5-8% recessionary drag in the second quarter of 2020, then an average reduction in earnings of 30% is most likely overly optimistic. 

However, here is the math:

  • Current Earnings = 132.90
  • 30% Reduction = $100 (rounding down for easier math)

At various P/E multiples, we can predict where “fair value” for the market is based on historical assumptions:

  • 20x earnings:  Historically high but markets have traded at high valuations for the last decade. 
  • 18x earnings: Still historically high.
  • 15x earnings: Long-Term Average
  • 13x earnings: Undervalued 
  • 10x earnings: Extremely undervalued but aligned with secular bear market bottoms.

You can pick your own level where you think P/E’s will account for the global recession but the chart below prices it into the market.

With the S&P 500 closing yesterday at 2386, this equates to downside risk of:

  • 20x Earnings = -16% (Total decline from peak = – 40%)
  • 18x Earnings = 24.5% (Total decline from peak = – 46%)
  • 15x Earnings = -37.1% (Total decline from peak = – 55%)
  • 13x Earnings = 45.5% (Total decline from peak = – 61%)
  • 10x Earnings = 58.0% (Total decline from peak = – 70%)

NOTE: I am not suggesting the market is about to decline 60-70% from the recent peak. I am simply laying out various multiples based on assumed risk to earnings. However, 15-18x earnings is extremely reasonable and possible. 

When Too Little Is Too Much

With our risk limits hit, and in order to protect our clients from both financial and emotional duress, we made the decision that even the reduced risk we were carrying was still too much.

One concern, which weighed heavily into our decision process, was the rising talk of the “closing the markets” entirely for a week or two to allow the panic to pass. We have clients that depend on liquidity from their accounts to sustain their retirement lifestyle. In our view, a closure of the markets would lead to two outcomes which pose a real risk to our clients:

  1. They need access to liquidity, and with markets closed are unable to “sell” and raise cash; and,
  2. When you trap investors in markets, when they do open again, there is a potential “rush” of sellers to get of the market to protect themselves. 

That risk, combined with the issue that major moves in markets are happening outside of transaction hours, are outside of our ability to hedge, or control.

This is what we consider to be an unacceptable risk for the time being.

We will likely miss the ultimate “bottom” of the market.

Probably.

But that’s okay, we have done our job of protecting our client’s second most precious asset behind their family, the capital they have to support them.

The good news is that a great “buying” opportunity is coming. Just don’t be in a “rush” to try and buy the bottom.

I can assure you, when we see ultimately see a clear “risk/reward” set up to start taking on equity risk again, we will do so “with both hands.” 

And we are sitting on a lot of cash just for that reason.Save

RIA PRO: Risk Limits Hit

For the last several months we have been issuing repeated warnings about the market. While such comments are often mistaken for “being bearish,” we have often stated it is our process of managing “risk” which is most important.

Beginning in mid-January, we began taking profits out of our portfolios and reducing risk. To wit:

“On Friday, we began the orderly process of reducing exposure in our portfolios to take in profits, reduce portfolio risk, and raise cash levels.”

Since then, as you know, we have taken profits, and rebalanced risk several times within the portfolios.

Importantly, we approach portfolio management from a perspective of “risk management,” but not just in terms of “portfolio risk,” but “emotional risk” as well. By reducing our holdings to raise cash to protect capital, we can reduce the risk of our clients hitting that “threshold” where they potentially make very poor decisions.

In investing, the worst decisions are always made at the moment of the most pain. Either at the bottom of the market or near the peaks. 

Investing is not always easy. Our portfolios are designed to have longer-term holding periods, but we also understand that things do not always go as planned.

This is why we have limits, and when things go wrong, we sell.

So, why do I tell you this?

On Friday/Monday, our “limits” were breached, which required us to sell more.

Two Things

Two things have now happened which signaled us to reduce risk further in portfolios.

On Sunday, the Federal Reserve dropped a monetary “nuclear bomb,” on the markets. My colleague Caroline Baum noted the details:

“After an emergency 50-basis-point rate cut on March 3, the Federal Reserve doubled down Sunday evening, lowering its benchmark rate by an additional 100 basis points to a range of 0%-0.25% following another emergency meeting.

After ramping up its $60 billion of monthly Treasury bill purchases to include Treasuries of all maturities and offering $1.5 trillion of liquidity to the market via repurchase agreements on March 3, the Fed doubled down Sunday evening with announced purchases of at least $500 billion of Treasuries and at least $200 billion of agency mortgage-backed securities.

In addition, the Fed reduced reserve requirements to zero, encouraged banks to borrow from its discount window at a rate of 0.25%, and, in coordination with five other central banks, lowered the price of U.S. dollar swap arrangements to facilitate dollar liquidity abroad”

We had been anticipating the Federal Reserve to try and rescue the markets, which is why we didn’t sell even more aggressively previously. The lesson investors have been taught repeatedly over the last decade was “Don’t Fight The Fed.”

One of the reasons we reduced our exposure in the prior days was out of concern we didn’t know if the Fed’s actions would be successful. 

On Monday, we found out the answer. The Fed may be fighting a battle it can’t win as markets not only failed to respond to the Fed’s monetary interventions, but also broke the “bullish trend line” from the 2009 lows.  (While the markets are oversold short-term, the long-term “sell signals” in the bottom panels are just being triggered from fairly high levels. This suggests more difficulty near-term for stocks. 

This was the “Red Line” we laid out in our last week, in the Special Report Red Line In The Sand:

“As you can see in the chart below, this is a massive surge of liquidity hitting the market at a time the market is hitting important long-term trend support.”

It is now, or never, for the markets.

With our portfolios already at very reduced equity levels, the break of this trendline will take our portfolios to our lowest levels of exposure. However, given the extreme oversold condition, noted above, it is likely we are going to see a bounce, which we will use to reduce risk into.

What happened today was an event we have been worried about, but didn’t expect to see until after a break of the trendline – “margin calls.”

This is why we saw outsized selling in “safe assets” such as REITs, utilities, bonds, and gold.

Cash was the only safe place to hide.

This also explains why the market “failed to rally” when the Fed announced $500 billion today. There is another $500 billion coming tomorrow. We will see what happens.

We aren’t anxious to “fight the Fed,” but the markets may have a different view this time.

Use rallies to raise cash, and rebalance portfolio risk accordingly.

We are looking to be heavy buyers of equities when the market forms a bottom, we just aren’t there as of yet.”

On Monday morning, we took some action.

  • Did we sell everything? No. We still own 10% equity, bonds, and a short S&P 500 hedge. 
  • Did we sell the bottom? Maybe.

We will only know in hindsight for certain, and we are not willing to risk more of our client’s capital currently. 

There are too many non-quantifiable risks with a global recession looming, as noted by David Rosenberg:

“The pandemic is a clear ‘black swan’ event. There will be a whole range of knock-on effects. Fully 40 million American workers, or one-third of the private sector labor force, are directly affected ─ retail, entertainment, events, sports, theme parks, conferences, travel, tourism, restaurants and, of course, energy.

This doesn’t include all the multiplier effects on other industries. It would not surprise me at all if real GDP in Q2 contracts at something close to an 8% annual rate (matching what happened in the fourth quarter of 2008 which was a financial event alone).

The hit to GDP can be expected to be anywhere from $400 billion to $600 billion for the year. But the market was in trouble even before COVID-19 began to spread, with valuations and complacency at cycle highs and equity portfolio managers sitting with record-low cash buffers. Hence the forced selling in other asset classes.

If you haven’t made recession a base-case scenario, you probably should. All four pandemics of the past century coincided with recession. This won’t be any different. It’s tough to generate growth when we’re busy “social distancing.” I am amazed that the latest WSJ poll of economists conducted between March 6-10th showed only 49% seeing a recession coming”.

The importance of his commentary is that from an “investment standpoint,” we can not quantify whether this “economic shock” has been priced into equities as of yet. However, we can do some math based on currently available data:

The chart below is annual nominal GDP, and S&P 500 GAAP earnings.

I am sure you will not be shocked to learn that during “recessions,” corporate “earnings’ tend to fall. Historically, the average drawdown of earnings is about 20%, however, since the 1990’s, those drawdowns have risen to about 30%.

As of March 13th, Standard & Poors has earnings estimates for the first quarter of 2020 at $139.20/share. This is down just $0.20 from the fourth quarter of 2019 estimates of $139.53.

If our, and Mr. Rosenberg’s, estimates are correct of a 5-8% recessionary drag in the second quarter of 2020, then an average reduction in earnings of 30% is most likely overly optimistic. 

However, here is the math:

  • Current Earnings = 132.90
  • 30% Reduction = $100 (rounding down for easier math)

At various P/E multiples we can predict where “fair value” for the market is based on historical assumptions:

  • 20x earnings:  Historically high but markets have traded at high valuations for the last decade. 
  • 18x earnings: Still historically high.
  • 15x earnings: Long-Term Average
  • 13x earnings: Undervalued 
  • 10x earnings: Extremely undervalued but aligned with secular bear market bottoms.

You can pick your own level where you think P/E’s will account for the global recession but the chart below prices it into the market.

With the S&P 500 closing yesterday at 2386, this equates to downside risk of:

  • 20x Earnings = -16% (Total decline from peak = – 40%)
  • 18x Earnings = 24.5% (Total decline from peak = – 46%)
  • 15x Earnings = -37.1% (Total decline from peak = – 55%)
  • 13x Earnings = 45.5% (Total decline from peak = – 61%)
  • 10x Earnings = 58.0% (Total decline from peak = – 70%)

NOTE: I am not suggesting the market is about to decline 60-70% from the recent peak. I am simply laying out various multiples based on assumed risk to earnings. However, 15-18x earnings is extremely reasonable and possible. 

When Too Little Is Too Much

With our risk limits hit, and in order to protect our clients from both financial and emotional duress, we made the decision that even the reduced risk we were carrying was still too much.

One concern, which weighed heavily into our decision process, was the rising talk of the “closing the markets” entirely for a week or two to allow the panic to pass. We have clients that depend on liquidity from their accounts to sustain their retirement lifestyle. In our view, a closure of the markets would lead to two outcomes which pose a real risk to our clients:

  1. They need access to liquidity, and with markets closed are unable to “sell” and raise cash; and,
  2. When you trap investors in markets, when they do open again there is a potential “rush” of sellers to get of the market to protect themselves. 

That risk, combined with the issue that major moves in markets are happening outside of transaction hours, are outside of our ability to hedge, or control.

This is what we consider to be unacceptable risk for the time being.

We will likely miss the ultimate “bottom” of the market?

Probably.

But that’s okay, we have done our job of protecting our client’s second most precious asset behind their family, the capital they have to support them.

The good news is that a great “buying” opportunity is coming. Just don’t be in a “rush” to try and buy the bottom.

I can assure you that when we see ultimately see a clear “risk/reward” set up to start taking on equity risk again, we will do so “with both hands.” 

And we are sitting on a lot of cash just for that reason.Save

Technically Speaking: On The Cusp Of A Bear Market

“Tops are a process, and bottoms are an event”

Over the last couple of years, we have discussed the ongoing litany of issues that plagued the underbelly of the financial markets.

  1. The “corporate credit” markets are at risk of a wave of defaults.
  2. Earnings estimates for 2019 fell sharply, and 2020 estimates are now on the decline.
  3. Stock market targets for 2020 are still too high, along with 2021.
  4. Rising geopolitical tensions between Russia, Saudi Arabia, China, Iran, etc. 
  5. The effect of the tax cut legislation has disappeared as year-over-year comparisons are reverting back to normalized growth rates.
  6. Economic growth is slowing.
  7. Chinese economic data has weakened further.
  8. The impact of the “coronavirus,” and the shutdown of the global supply chain, will impact exports (which make up 40-50% of corporate profits) and economic growth.
  9. The collapse in oil prices is deflationary and can spark a wave of credit defaults in the energy complex.
  10. European growth, already weak, continues to weaken, and most of the EU will likely be in recession in the next 2-quarters.
  11. Valuations remain at expensive levels.
  12. Long-term technical signals have become negative. 
  13. The collapse in equity prices, and coronavirus fears, will weigh on consumer confidence.
  14. Rising loan delinquency rates.
  15. Auto sales are signaling economic stress.
  16. The yield curve is sending a clear message that something is wrong with the economy.
  17. Rising stress on the consumption side of the equation from retail sales and personal consumption.

I could go on, but you get the idea.

In that time, these issues have gone unaddressed, and worse dismissed, because of the ongoing interventions of Central Banks.

However, as we have stated many times in the past, there would eventually be an unexpected, exogenous event, or rather a “Black Swan,” which would “light the fuse” of a bear market reversion.

Over the last few weeks, the market was hit with not one, but two, “black swans” as the “coronavirus” shutdown the global supply chain, and Saudi Arabia pulled the plug on oil price support. Amazingly, we went from “no recession in sight”, to full-blown “recession fears,” in less than month.

“Given that U.S. exporters have already been under pressure from the impact of the “trade war,” the current outbreak could lead to further deterioration of exports to and from China, South Korea, and Japan. This is not inconsequential as exports make up about 40% of corporate profits in the U.S. With economic growth already struggling to maintain 2% growth currently, the virus could shave between 1-1.5% off that number. 

With our Economic Output Composite Indicator (EOCI) already at levels which has previously denoted recessions, the “timing” of the virus could have more serious consequences than currently expected by overzealous market investors.”

On The Cusp Of A Bear Market

Let me start by making a point.

“Bull and bear markets are NOT defined by a 20% move. They are defined by a change of direction in the trend of prices.” 

There was a point in history where a 20% move was significant enough to achieve that change in overall price trends. However, today that is no longer the case.

Bull and bear markets today are better defined as:

“During a bull market, prices trade above the long-term moving average. However, when the trend changes to a bear market prices trade below that moving average.”

This is shown in the chart below, which compares the market to the 75-week moving average. During “bullish trends,” the market tends to trade above the long-term moving average and below it during “bearish trends.”

In the last decade, there have been three previous occasions where the long-term moving average was violated but did not lead to a longer-term change in the trend.

  • The first was in 2011, as the U.S. was dealing with a potential debt-ceiling and threat of a downgrade of the U.S. debt rating. Then Fed Chairman Ben Bernanke came to the rescue with the second round of quantitative easing (QE), which flooded the financial markets with liquidity.
  • The second came in late-2015 and early-2016 as the market dealt with a Federal Reserve, which had started lifting interest rates combined with the threat of the economic fallout from Britain leaving the European Union (Brexit). Given the U.S. Federal Reserve had already committed to hiking interest rates, and a process to begin unwinding their $4-Trillion balance sheet, the ECB stepped in with their own version of QE to pick up the slack.
  • The latest event was in December 2018 as the markets fell due to the Fed’s hiking of interest rates and reduction of their balance sheet. Of course, the decline was cut short by the Fed reversal of policy and subsequently, a reduction in interest rates and a re-expansion of their balance sheet.

Had it not been for these artificial influences, it is highly likely the markets would have experienced deeper corrections than what occurred.

On Monday, we have once again violated that long-term moving average. However, Central Banks globally have been mostly quiet. Yes, there have been promises of support, but as of yet, there have not been any substantive actions.

However, the good news is that the bullish trend support of the 3-Year moving average (orange line) remains intact for now. That line is the “last line of defense” of the bull market. The only two periods where that moving average was breached was during the “Dot.com Crash” and the “Financial Crisis.”

(One important note is that the “monthly sell trigger,” (lower panel) was initiated at the end of February which suggested there was more downside risk at the time.)

None of this should have been surprising, as I have written previously, prices can only move so far in one direction before the laws of physics take over. To wit”

Like a rubber band that has been stretched too far – it must be relaxed before it can be stretched again. This is exactly the same for stock prices that are anchored to their moving averages. Trends that get overextended in one direction, or another, always return to their long-term average. Even during a strong uptrend or strong downtrend, prices often move back (revert) to a long-term moving average.”

With the markets previously more than 20% of their long-term mean, the correction was inevitable, it just lacked the right catalyst.

The difference between a “bull market” and a “bear market” is when the deviations begin to occur BELOW the long-term moving average on a consistent basis. With the market already trading below the 75-week moving average, a failure to recover in a fairly short period, will most likely facilitate a break below the 3-year average.

If that occurs, the “bear market” will be official and will require substantially lower levels of equity risk exposure in portfolios until a reversal occurs.

Currently, it is still too early to know for sure whether this is just a “correction” or a “change in the trend” of the market. As I noted previously, there are substantial differences, which suggest a more cautious outlook. To wit:

  • Downside Risk Dwarfs Upside Reward. 
  • Global Growth Is Less Synchronized
  • Market Structure Is One-Sided and Worrisome. 
  • COVID-19 Impacts To The Global Supply Chain Are Intensifying
  • Any Semblance of Fiscal Responsibility Has Been Thrown Out the Window
  • Peak Buybacks
  • China, Europe, and the Emerging Market Economic Data All Signal a Slowdown
  • The Democrats Control The House Which Effectively Nullifies Fiscal Policy Agenda.
  • The Leadership Of The Market (FAANG) Has Faltered.

Most importantly, the collapse in interest rates, as well as the annual rate of change in rates, is screaming that something “has broken,” economically speaking.

Here is the important point.

Understanding that a change is occurring, and reacting to it, is what is important. The reason so many investors “get trapped” in bear markets is that by the time they realize what is happening, it has been far too late to do anything about it.

Let me leave you with some important points from the legendary Marty Zweig: (h/t Doug Kass.)

  • Patience is one of the most valuable attributes in investing.
  • Big money is made in the stock market by being on the right side of the major moves. The idea is to get in harmony with the market. It’s suicidal to fight trends. They have a higher probability of continuing than not.
  • Success means making profits and avoiding losses.
  • Monetary conditions exert an enormous influence on stock prices. Indeed, the monetary climate – primarily the trend in interest rates and Federal Reserve policy – is the dominant factor in determining the stock market’s major decision.
  • The trend is your friend.
  • The problem with most people who play the market is that they are not flexible.
  • Near the top of the market, investors are extraordinarily optimistic because they’ve seen mostly higher prices for a year or two. The sell-offs witnessed during that span were usually brief. Even when they were severe, the market bounced back quickly and always rose to loftier levels. At the top, optimism is king; speculation is running wild, stocks carry high price/earnings ratios, and liquidity has evaporated. 
  • I measure what’s going on, and I adapt to it. I try to get my ego out of the way. The market is smarter than I am, so I bend.
  • To me, the “tape” is the final arbiter of any investment decision. I have a cardinal rule: Never fight the tape!
  • The idea is to buy when the probability is greatest that the market is going to advance.

Most importantly, and something that is most applicable to the current market:

“It’s okay to be wrong; it’s just unforgivable to stay wrong.” – Marty Zweig

There action this year is very reminiscent of previous market topping processes. Tops are hard to identify during the process as “change happens slowly.” The mainstream media, economists, and Wall Street will dismiss pickup in volatility as simply a corrective process. But when the topping process completes, it will seem as if the change occurred “all at once.”

The same media which told you “not to worry,” will now tell you, “no one could have seen it coming.”

The market may be telling you something important, if you will only listen.

Save

Technically Speaking: Sellable Rally, Or The Return Of The Bull?

Normally, “Technically Speaking,” is analysis based on Monday’s market action. However, this week, we are UPDATING the analysis posted in this past weekend’s newsletter, “Market Crash & Navigating What Happens Next.”

Specifically, we broke down the market into three specific time frames looking at the short, intermediate, and long-term technical backdrop of the markets. In that analysis, we laid out the premise for a “reflexive bounce” in the markets, and what to do during the process of that move. To wit:

“On a daily basis, the market is back to a level of oversold (top panel) rarely seen from a historical perspective. Furthermore, the rapid decline this week took the markets 5-standard deviations below the 50-dma.”

Chart updated through Monday

“To put this into some perspective, prices tend to exist within a 2-standard deviation range above and below the 50-dma. The top or bottom of that range constitutes 95.45% of ALL POSSIBLE price movements within a given period.

A 5-standard deviation event equates to 99.9999% of all potential price movement in a given direction. 

This is the equivalent of taking a rubber band and stretching it to its absolute maximum.”

Importantly, like a rubber band, this suggests the market “snap back” could be fairly substantial, and should be used to reduce equity risk, raise cash, and add hedges.”

Importantly, read that last sentence again.

The current belief is that the “virus” is limited in scope and once the spread is contained, the markets will immediately bounce back in a “V-shaped” recovery.  Much of this analysis is based on assumptions that “COVID-19” is like “SARS” in 2003 which had a very limited impact on the markets.

However, this is likely a mistake as there is one very important difference between COVID-19 and SARS, as I noted previously:

“Currently, the more prominent comparison is how the market performed following the ‘SARS’ outbreak in 2003, as it also was a member of the ‘corona virus’ family. Clearly, if you just remained invested, there was a quick recovery from the market impact, and the bull market resumed. At least it seems that way.”

“While the chart is not intentionally deceiving, it hides a very important fact about the market decline and the potential impact of the SARS virus. Let’s expand the time frame of the chart to get a better understanding.”

“Following a nearly 50% decline in asset prices, a mean-reversion in valuations, and an economic recession ending, the impact of the SARS virus was negligible given the bulk of the ‘risk’ was already removed from asset prices and economic growth. Today’s economic environment could not be more opposed.”

This was also a point noted by the WSJ on Monday:

Unlike today, the S&P 500 ETF (SPY) spent about a year below its 200-day moving average (dot-com crash) prior to the SARS 2003 outbreak. Price action is much different now. SPY was well above its 200-day moving average before the coronavirus outbreak, leaving plenty of room for profit-taking.”

Importantly, the concern we have in the intermediate-term is not “people getting sick.” We currently have the “flu” in the U.S. which, according to the CDC, has affected 32-45 MILLION people which has already resulted in 18-46,000 deaths.

Clearly, the “flu” is a much bigger problem than COVID-19 in terms of the number of people getting sick. The difference, however, is that during “flu season,” we don’t shut down airports, shipping, manufacturing, schools, etc. The negative impact to exports and imports, business investment, and potentially consumer spending, which are all direct inputs into the GDP calculation, is going to be reflected in corporate earnings and profits. 

The recent slide, not withstanding the “reflexive bounce” on Monday, was beginning the process of pricing in negative earnings growth through the end of 2020.

More importantly, the earnings estimates have not be ratcheted down yet to account for the impact of the “shutdown” to the global supply chain. Once we adjust (dotted blue line) for the a negative earnings environment in 2020, with a recovery in 2021, you can see just how far estimates will slide over the coming months. This will put downward pressure on stocks over the course of this year.

Given this backdrop of weaker earnings, which will be derived from weaker economic growth, in the months to come is why we suspect we could well see this year play out much like 2015-2016. In 2015, the Fed was beginning to discuss tapering their balance sheet which initially led to a decline. Given there was still plenty of liquidity, the market rallied back before “Brexit” risk entered the picture. The market plunged on expectations for a negative economic impact, but sprung back after Janet Yellen coordinated with the BOE, and ECB, to launch QE in the Eurozone.

Using that model for a reflexive rally, we will likely see a failed rally, and a retest of last weeks lows, or potentially even set new lows, as economic and earnings risks are factored in. 

Rally To Sell

As expected, the market rallied hard on Monday on hopes the Federal Reserve, and Central Banks globally, will intervene with a “shot of liquidity” to cure the market’s “COVID-19” infection.

The good news is the rally yesterday did clear initial resistance at the 200-dma which keeps that important break of support from being confirmed. This clears the way for the market to rally back into the initial “sell zone” we laid out this past weekend.

Importantly, while the volume of the rally on Monday was not as large as Friday’s sell-off, it was a very strong day nonetheless and confirmed the conviction of buyers. With the markets clearing the 200-dma, and still oversold on multiple levels, there is a high probability the market will rally into our “sell zone” before failing.

For now look for rallies to be “sold.”

The End Of The Bull

I want to reprint the last part of this weekend’s newsletter as the any rally that occurs over the next couple of weeks will NOT reverse the current market dynamics.

“The most important WARNING is the negative divergence in relative strength (top panel).  This negative divergence was seen at every important market correction event over the last 25-years.”

“As shown in the bottom two panels, both of the monthly ‘buy’ signals are very close to reversing. It will take a breakout to ‘all-time highs’ at this point to keep those signals from triggering.

For longer-term investors, people close to, or in, retirement, or for individuals who don’t pay close attention to the markets or their investments, this is NOT a buying opportunity.

Let me be clear.

There is currently EVERY indication given the speed and magnitude of the decline, that any short-term reflexive bounce will likely fail. Such a failure will lead to a retest of the recent lows, or worse, the beginning of a bear market brought on by a recession.

Please read that last sentence again. 

Bulls Still In Charge

The purpose of the analysis above is to provide you with the information to make educated guesses about the “probabilities” versus the “possibilities” of what could occur in the markets over the weeks, and months, ahead.

It is absolutely “possible” the markets could find a reason to rally back to all-time highs and continue the bullish trend. (For us, such would be the easiest and best outcome.) Currently, the good news for the bulls, is the bullish trend line from the 2015 lows held. However, weekly “sell signals” are close to triggering, which does increase short-term risks.

With the seasonally strong period of the market coming to its inevitable conclusion, economic and earnings data under pressure, and the virus yet to be contained, it is likely a good idea to use the current rally to rebalance portfolio risk and adjust allocations accordingly.

As I stated in mid-January, and again in early February, we reduced exposure in portfolios by raising cash and rebalancing portfolios back to target weightings. We had also added interest rate sensitive hedges to portfolios, and removed all of our international and emerging market exposures.

We will be using this rally to remove basic materials and industrials, which are susceptible to supply shocks, and financials which will be impacted by an economic slowdown/recession which will likely trigger rising defaults in the credit market.

Here are the guidelines we recommend for adjusting your portfolio risk:

Step 1) Clean Up Your Portfolio

  1. Tighten up stop-loss levels to current support levels for each position.
  2. Take profits in positions that have been big winners
  3. Sell laggards and losers
  4. Raise cash and rebalance portfolios to target weightings.

Step 2) Compare Your Portfolio Allocation To Your Model Allocation.

  1. Determine areas requiring new or increased exposure.
  2. Determine how many shares need to be purchased to fill allocation requirements.
  3. Determine cash requirements to make purchases.
  4. Re-examine portfolio to rebalance and raise sufficient cash for requirements.
  5. Determine entry price levels for each new position.
  6. Determine “stop loss” levels for each position.
  7. Determine “sell/profit taking” levels for each position.

(Note: the primary rule of investing that should NEVER be broken is: “Never invest money without knowing where you are going to sell if you are wrong, and if you are right.”)

Step 3) Have positions ready to execute accordingly given the proper market set up. In this case, we are adjusting exposure to areas we like now, and using the rally to reduce/remove the sectors we do not want exposure too.

Stay alert, things are finally getting interesting.

Save

Robertson: One Is The Loneliest Number

With passive funds continuing to grow share at the expense of actively managed funds and markets on a roll since late 2018, analyzing individual stocks can seem like a quaint if not downright outdated exercise. Indeed, many investors and advisors have become so deeply habituated to passive investing that they don’t even consider other alternatives. As a result, the exercise of analyzing individual stocks has become a fairly lonely pursuit.

This reality, however, also spells opportunity. While the rising tide of easy monetary policy lifted most equity boats for many years, the beneficial effects now are being shared by a decreasing number of the largest stocks. In addition, as the share of active management declines, so too do analytical efforts that keep market inefficiencies in check. A key consequence is that some much more interesting stock ideas are beginning to emerge for investors who are willing and able to rummage around in less visible parts of the market.

In a sense, it shouldn’t be surprising that individual stock opportunities are creeping up. After all, there are only a relatively few stocks with the size and liquidity requisite to be constituents in a broad array of passive funds. Pretty much by definition then, most stocks do not benefit so disproportionately from large flows of funds from price-insensitive investors. It also follows that without such support, most individual stocks are still vulnerable to eroding fundamentals to a greater or lesser extent.

And eroding fundamentals there are. Weak economic growth across the globe and repeated flirtations with yield curve inversion provide plenty of fodder to beat up on stocks with economic exposure. Companies across the energy sector have been hit, but so have those in transportation, shipping, retail, and plenty of other industries.

While poor economic news (and plenty of other uncertainty) is negative for stock prospects, it does come with a bit of a silver lining. Such clear detrimental forces induce investors to react, and in doing so, they often overreact. These types of situations are the bread and butter of valuation-based stock picking.

This also relates to another point that seems nearly forgotten. It wasn’t all that long ago that investment research was dominated by company-specific work. Before the financial crisis in 2008, Wall Street research emphasized company analyses. Investment platforms such as Motley Fool and Seeking Alpha (among others) emerged to address the widespread appetite for company-specific insights. Even casual conversations often revolved around stock tips.

While much of that activity was overdone and not especially useful, the key tenets of equity analysis remain as valid as ever. With the opportunity set beginning to open up again, now is a good time to either refresh those skills or develop them anew. More specifically, the thrust of such efforts is to identify the degree to which situational factors affect a company’s cash flow stream and then to determine if the market’s reaction is excessive.

As an example, one of the stocks I have found interesting is a small-mid cap supplier to the food and beverage industry. It has been around for a long time and sells all over the world; less than half of its revenues are in the US. Because it sells to the food and beverage industry, its revenues are fairly stable. While they don’t go up a whole lot, they don’t go down a whole lot either.

This particular company is also a leader in its industry. It dominates market share and as such, it provides significant logistical and reliability advantages to its customers. On top of all this, it is also a technology leader and finds various ways to monetize its position.

The company does have debt, but the debt level is manageable given the stability of the business and its prodigious generation of cash flow.

Based upon this description of fundamentals, how would you expect the stock to have performed? By way of comparison, the S&P 500 produced a total return of 31.5% in 2019 and finished with a trailing price/earnings multiple of 21.75. Would it be up by half as much as the S&P500? Flat? Maybe down a bit?

The reality was far harsher. Not only did the stock fail to keep up with the S&P 500 last year, it crashed on the order of 50% after a negative earnings surprise. This was interesting for two reasons. First, it was left with a price/earnings multiple in the mid-single digit range which is nearly unheard of in such overvalued markets. Second, the stock fell to a level below its lows during the Great Financial Crisis over ten years ago, despite being in a far more benign economic environment. To value buyers, this starts to sound interesting.

Obviously, not all cheap stocks will outperform and there are plenty of other factors that can come into play. Further, if economic conditions continue to erode, a number of companies will be negatively affected and could run into serious trouble. This is certainly happening in the energy industry right now.

But that’s not the point. The main point here is to recognize the world of individual stocks is becoming increasingly bifurcated. On one side is the glossy veneer of index averages regularly pushing higher. These are driven be a relatively few mega cap tech names that seem to be nearly impervious to negative news.

On the other side is a growing group of stocks that are not only vulnerable but seem to be hypersensitive to such factors. This is a different environment than a few years ago when it was extremely difficult to find any stock that was cheap. Something has changed.

This opens up new challenges and opportunities for investors. A big challenge is that the mega cap tech leaders today are unlikely to remain impervious to bad news forever. One of the great lessons of the internet boom in the late 1990s is that tech companies are not immune from economic pressures.

Many will be surprised to find out this is still true. Whether it comes in the form of reduced capital spending by companies, lower discretionary spending by consumers, or lower advertising spend as corporate budgets get squeezed, technology businesses are still very much affected by economic conditions. As it turns out, these conditions affect all their customers.

Another big challenge is that with major indexes near all-time highs and with little earnings growth to support those prices, common passive strategies are set up to deliver exceptionally poor returns over the next several years. As a result, the returns from passive investing may very well be insufficient for many investors to reach their goals. The ride over the last ten years has been terrific, but the next ten will likely be very different.

There is also opportunity, however. The best chance investors will get to realize the kinds of returns that can really help them is to return to the hard work of uncovering undervalued companies. Such an endeavor is the bread and butter of active investors and focuses on identifying cash flows and determining how sustainable they might be. Competitive advantages are important and often come in the form of less tangible attributes such as an organization’s capacity to learn and adapt. It takes a lot of work, but the opportunities exist.

While the work of toiling on individual company analyses can be a lonely endeavor, especially while passive strategies remain in the spotlight, it is also a valid way to extract decent returns from an otherwise overvalued universe of options. Indeed, such efforts may be the last best hope to realize attractive returns for some time to come.

It’s Not 2000, But The Market Is Mighty Narrow Again

For those of us who were around in 1999-2000 looking at charts and perhaps writing about them, there is an eerie familiarity with the market of today. Back then, when indices and the Nasdaq in particular, were rallying harder each day than the last, market breadth was looking fairly weak. In other words, the big the names were soaring, forcing indexers and ETFs to buy them just to keep their weightings, and the positive feedback cycle roiled on.

I remember, looking at this stuff for BridgeNews and having to forecast where resistance levels might be based on Fibo projections or the top of some trading band. Walking by my desk, it was not unusual for me to exclaim, “This is nuts!” By that way, a much funnier TV show than “This is us”.

Now, I am in no way comparing 2000 and 2020 in any way but they did have one thing in common. Big cap, and mostly big cap tech, was powering ahead while mid-cap and especially small-cap lagged far behind.

No, that does not show up in the advance-decline line, which just managed to set a new high after its late January swoon. A colleague had a good explanation for this, saying that plenty of stocks can be rising but by smaller amounts and far below previous highs. That would certainly explain why the a/d line is rising and up/down volume is mediocre, at best.

Have you looked at a small-cap advance-decline? Not pretty.

Check out these charts:

(Click on image to enlarge)

This is the regular, cap-weighted S&P 500 vs. the equal-weighted version. The trend has been accelerating higher for months. While it is not anything near what it looked like in 1999-2000, it is still quite significant.

(Click on image to enlarge)

Here is the Nasdaq-100 ETF vs. the equal-weighted Nasdaq-100 ETF. To the moon, Alice.

(Click on image to enlarge)

And then let’s look at a mega-cap stock. This is Microsoft MSFT and it looks just as nuts. Don’t forget this is a $1.4 TRILLION stock so every gain packs on huge amounts of market cap.

What happens when this stock finally decides to pull back? It scored an as yet unconfirmed bearish reversal this week on huge volume. And look how far above it is now from its 200-day averages. Nuts!

Considering that it is a member of the Dow, the Nasdaq-100, the S&P 500 and XLK tech ETF, what do you think will happen when this huge member (keep it clean, pervs) corrects? And there is a lot of correcting room before even thinking about a change in a major trend.

There you have it. A narrow market at all-time highs, ignoring news and having utilities among the leading groups.

But don’t worry, the Fed has already committed to more quantitative easing. Whoopee! Kick that can, Jerry.

Bitcoin: Like A Moth To A Flame

  • * Beware of investment fads and the experts that deliver endorsing pablum in the business media
  • * They are not your allies in delivering good investment returns — they are harmful to your investment well being

“Thus hath the candle singd the moath.”
– William Shakespeare, The Merchant of Venice

This morning the price of bitcoin is down by another 10%: the price is flirting with $10,000 after trading at around $20,000 a few months ago.

The phrase “like a moth to a flame” is an allusion to the well known attraction that moths have to bright lights.

The word moth was used in the 17th century to refer to someone who was apt to be tempted by something that would lead to their downfall.

So it is with many in the business media, who too often, like Wall Street offering up conflicted research recommendations, seek audience over intelligence by parading experts (in the latest fad, like cryptocurrencies) and, too wittingly become the enemy of the average and uninformed investor. These experts, with memorized sound bytes, will always sound confident and rarely express the notion of risk. But, many of that audience will learn, like The Wizard of Oz, that they’re simply delivering an odious pablum –bland or insipid intellectual fare and entertainment.

Those outlets that are inundated by crypt talk know who they are — like Warren Buffett, I prefer to criticize by category (and praise by name). (As evidence to the preoccupation, just take a quick look at the Twitter threads of some of the leading business media shows — they are overwhelmed by crypto chatter and nonsensical and hyperbolic opinions.)

Popular investment fads often too quickly become unprofitable investment endeavors — dot.com stocks in 1999 and housing/banking stocks in 2007 come to mind.

Ultimately the frequency of media coverage will diminish coincident with the fads’ price declines (and investors/traders lost interest). While the business media may shamelessly move on (unlike research firms and money managers who deliver poor investment advice, will face little retribution), your portfolio could be permanently impaired by what Joe Granville used to call “the bagholders’ blues.”

I may be wrong in my ursine view of bitcoin, et al, and though I no longer have any position (See Tales of the Crypt (Issue IX), I have written tens of thousands of words on the subject, discussing both the potential rewards but also, importantly, the risks as I saw them:

* There’s A Sucker Born Every Minute
* Res Ipsa Idiot

Many in the business media may ultimately forget their current preoccupation with crypto and drop coverage if my negative forecasts continue to be realized — but not until lots of money is lost in the process.

More

Not to worry, when enough time transpires, the same experts will be trotted back onto the business media with another investment idea in hand — just as the case is now, some nine years after The Great Recession and near 80% drops in their portfolios.

Some may say “time heals all wounds.”

But I disagree, as this elephant never forgets.

“The market does not know you exist. You can do nothing to influence it. You can only control your behavior.”

– Alexander Elder

It is up to each trader/investor to evaluate reward vs. risk of each investment — as many in the business media and the talking heads and commentators will not necessarily address upside compared to downside particularly in the trade du jour.

These days I am too often reminded of Benjamin Disraeli’s quote:

“What we have learned from history is that we haven’t learned from history.”

It’s Always 20/20 In The Rear-View Mirror

“For many, it will be increasingly difficult to navigate a market dominated by the overly popular ETFs and quant (volatility-trending and risk-parity) strategies that worship at the altar of price momentum. It is also because the ‘buy the dip’ mentality remains indelibly etched on the forehead of most investors and traders that the Pavlovian reaction won’t die easily.

Favoring the bulls is the diminished number of publicly held companies outstanding (from more than 7,600 in 2000 to 3,800 in 2017), a 17% reduction in the float of the remaining companies via corporate buybacks, and still-abundant liquidity. And on top of this, as previously mentioned, is the market’s participants confidence in buying the dips.” – Kass Diary, The Bull Wont Die Easily (November, 2017)

In trying to understand the relentless “Bull Market” advance since the Trump Election fourteen months ago I am reminded of what I wrote above in November, 2017.

These words were underscored in Jim “El Capitan” Cramer’s “Four Reasons Stocks Keep Going Up,” written at the end of yesterday’s trading session, in which he discusses the important structural changes that have led to the popularity of passive investing (ETFs) and in the share count drop caused by a near decade of aggressive corporate buybacks.

Of course there are numerous other reasons (some Jim details further) like the employment of large liquidity infusions from central bankers around the world, optimism about the cut in corporate taxes, the reductions of business regulations (around the fringe), sustained lower interest rates, etc.

As I have also written, investment vision is always 20/20 when viewed in the rear view mirror.

These past observations don’t really help us project the future — though I did touch on some of my concerns in yesterday’s opening missive, “Blinded By a Sense of History” (with some updates in parentheses):

“It is a mania shared by philosophers of all ages to deny what exists and to explain what does not exist.” – Jean-Jacques Rousseau

I have no clue how long it will continue:

* What I am certain about is that liquidity, which has buoyed our markets for years, is starting to be reduced. (Central Bankers are reversing course and beginning to contract their balance sheets)

* What I am fairly certain about is that we are at sentiment and valuation extremes — at least based on history. (And every day these measures grow more stretched)

* Interest rates are likely headed higher, posing — at some point — a potential risk and alternative to stocks. (The ten year US note yield rose above 2.50% this morning)

* I expect no further major legislative initiatives coming out of Washington, D.C. — specifically on the infrastructure front — and a further deterioration in the relationship between the Republicans and Democrats as we move toward key midterm elections. (My expectation is that the House goes Democrat while the Senate stays Republican.)

* As to the Administration, their belief appears to be that the benefit of world leadership is not worth the costs — which runs the risk of a policy mistake in the year ahead.

* As well, though markets have not been yet unnerved even with the White House having gotten bitten by a Wolff this past week, there exists the possibility that the Special Counsel’s
activities could be market unfriendly.

* And I am of the view that the earnings and economic growth expectations will, once again, be disappointing in 2018-19. (Earnings revisions higher have been material (in large measure from tax cuts) but I see mid year as a pivot point of slowing, not accelerating growth)

The markets seem to be moving back to being one with more concentrated leadership — as technology and the FAANGs (a large percent of the S&P Index) have regained their strength. Small caps, supposed tax cut beneficiaries, are lagging. Again, historically these are not positive signposts but it can continue, I have learned, far longer than I anticipated.

The speculation in cryptocurrencies and blockchain and penny stocks is yet another thin reed indicator of a mature Bull. And so is the self confidence and hubris seen in the business media.

Risk assets, like stocks, are called risk assets because they have risk — though you wouldn’t know it from the recent action in which fear and doubt has left the Exchanges.

But, wrong is wrong — and I continue to see ghosts that few market participants are viewing, blinded by a sense of history.

My strategy, given that the markets have clearly moved so much higher than my baseline expectations — is to become more trading oriented and to maintain high cash levels.

As described in my Diary, I see few longs that meet my standards of purchase.

As the market moves almost parabolically, I have recently begun to more aggressively short strength while keeping my stops fairly tight. (Day or days trades.)

Recently, with the exception of the last day of the year in which I profited, this has been a losing proposition.

Wash, rinse, repeat.

My view through the windshield (and the future) has been dramatically worse than my view through the rear view mirror (and the past) as stocks have marched ever higher without the sign of any meaningful pause.

While Grandma Koufax used to say, “Dougie, matzah doesn’t grow to the sky,” the investment trees are like redwoods these days.

A Long Time Ago, In A Market Galaxy Far, Far Away

“The opening crawl is the signature device of every numbered film of the Star Wars series, an American epic space opera franchise created by George Lucas. It opens with the static blue text, ‘A long time ago in a galaxy far, far away….’, followed by the Star Wars logo and the crawl text, which describes the backstory and context of the film. The visuals are accompanied by the “Main Title Theme“, composed and conducted by John Williams.

The sequence has been featured in every live-action Star Wars film produced by Lucasfilm with the exception of Rogue One. Although it retains the basic elements, it has significantly evolved throughout the series. It is one of the most immediately recognizable elements of the franchise and has been frequently parodied.

Each film opens with the static blue text, “A long time ago in a galaxy far, far away….”, followed by the Star Wars logo shrinking in front of a field of stars. Initially the logo’s extremities are beyond the edge of the frame. While the logo is retreating, the “crawl” text begins, starting with the film’s episode number and subtitle (with the exception of the original release of Star Wars – see below), and followed by a three-paragraph prologue to the film. The text scrolls up and away from the bottom of the screen towards a vanishing point above the top of the frame in a perspective projection. Each version of the opening crawl ends with a four-dot ellipsis, except for Return of the Jedi which has a three-dot ellipsis. When the text has nearly reached the vanishing point, it fades out, the camera tiltsdown (or, in the case of Episode II: Attack of the Clones, up), and the film begins.” –Star Wars Opening Crawl, Wikipedia

As Mel Brooks wrote in the opening crawl of his parody “Spaceballs“:

Once upon a valuation warp. . . .

In a market very, very, very, very far away, there lived a ruthless race of beings known as … Momentum Investors.

Chapter Eleven

The evil leaders of momentum investing, having foolishly overestimated economic and profit growth and taken valuations to an extreme, have revised a secret plan to take every breath of reason from their reason- loving neighbor, Value Investing.

Today is Halloween. Unbeknownest to the consensus, but knownest to us, danger lurks in the stars above..

If you can read this, you don’t need glasses.

But I am getting ahead of myself, so let me start from the beginning:

Episode I: THE PHANTOM MENACE

“Turmoil has engulfed Planet Investors, upending rational investing. The statutory corporate tax rates to outlying star systems are in dispute.

Hoping to resolve the matter with a tax-free repatriation of overseas cash, the White House has stopped all shipping to the small planet of Maine.

While the Congress of the Republic endlessly debates this alarming chain of events, the Supreme Tweeter has secretly dispatched two of his warriors (Mnuchin and Cohn), his guardians of low taxes for the nobles in the galaxy, to settle the conflict….”

Episode II: ATTACK OF THE CLONES

“There is unrest in the Galactic Senate. As several establishment Republicans have declared their intentions to leave the Republic.

This separatist movement, under the leadership of the mysterious Count Flake, has made it difficult for the limited number of warriors to maintain peace and order in the galaxy.

Senator Collins, the former Queen of Maine, is returning to the Galactic Senate to vote on the critical issue of creating an ARMY OF THE REPUBLIC to assist the overwhelmed Jedi….”

Episode III: REVENGE OF THE SITH

“Twitter War! The Republic is crumbling under attacks by the ruthless Sith Lord, Robert Mueller. There are heroes on both sides. Evil is everywhere.

In a stunning move, the fiendish aging droid leader, General Bernie Sanders (not to be confused with the Evil Colonel Sandurz), has swept into the Republic capital and kidnapped Chancellor McConnell, leader of the Galactic Senate.

As the Separatist Droid Army attempts to flee the besieged capital with their valuable hostage, two other Jedi Knights lead a desperate mission to rescue the captive Chancellor….”

Episode IV: A NEW HOPE

“It is a period of investor strife. Rebel spaceships, striking from a hidden base, (with price-earnings ratios ever expanding and dips ever bought) have won their first victory against the evil Galactic Empire (despite the robotic and fake impressions coming out of Facebook and Twitter) .

During the battle, Rebel spies managed to steal secret plans to the Empire’s ultimate weapon, the Death Star AMAZON, an armored space station with enough power to destroy an entire planet (and/or markets).

Pursued by the Empire’s sinister agents, Princess Kamala races home aboard her starship (on the Left Coast), custodian of the stolen plans that can save the markets and instill value and common sense to the galaxy….”

Episode V: THE EMPIRE STRIKES BACK

“It is a dark time for the Rebellion. The Death Star Amazon has not yet been destroyed and Imperial troops have driven the Rebel forces from their hidden base and pursued them across the galaxy.

Evading the dreaded Imperial Starfleet (of Generals Kelly, H.R. McMaster and Mattis) , a group of freedom fighters led by Luke Booker has established a new secret base on the remote ice world of California.

The evil lord Paul Ryan, obsessed with finding young Booker, has dispatched thousands of remote probes (and quant strategies) into the far reaches of space, continuing to boost investor confidence and buoy the S&P Index….”

Episode VI: RETURN OF THE JEDI

“Luke Booker has returned to his home planet of Newark in an attempt to rescue his party from the clutches of the vile gangster Bannon the Hutt and from (unregulated and growing power/value) of the sinister FANGS.

Little does Luke know that the Galactic Empire has secretly begun construction on a new armored space station even more powerful than the first dreaded Death Star, AMAZON.

When completed, this ultimate weapon will spell certain doom for the small band of rebels and short sellers struggling to restore freedom and common sense to investors…”

Episode VII: THE FORCE AWAKENS 

“Luke Booker has vanished. In his absence, the sinister DARTH PUTIN has risen from the ashes of the Empire (and Facebook/Twitter) and will not rest until Booker, the last Jedi (and market complacency), have been destroyed.

With the support of the REPUBLIC, Princess Kamala Harris leads a brave RESISTANCE. She is desperate to find her brother Luke Booker and gain his help in restoring peace and justice and reasonable valuations to the galaxy.

Princess Kamala has sent her most daring pilot on a secret mission to PLANET DNC, where an old ally (Princess Elizabeth) has discovered a clue to Luke’s whereabouts….”

Hopefully, to find out the market outcome, we may only have to wait for next month’s (Dec. 15) release of Episode VIII, “The Last Jedi.”

But the wait could be as long as Dec. 20, 2019, with the release of the still-untitled Episode IX.

“Your eyes can deceive you. Don’t trust them.” – Obi-Wan Kenobi

It’s scary out there — after all, it’s Halloween.

Trick or treat?

Regardless of market outcomes, May the Schwartz be with (all of) you.”

Short Term Gain – Long Term Pain


Stock Buybacks and the Principal/Agent Problem

“The single greatest edge an investor can have is a long term orientation.” – Seth Klarman

The most recent Nobel Prize in economics was awarded to Oliver Hart and Bengt Holmstrom for their work on how corporate contracts and incentives effect corporations. Among their many findings they discussed how incentive-laden contracts meant to solve one problem tend to create new ones.

Based on a similar premise, we wrote a series of articles discussing stock buybacks and the harm they tend to cause to the long-term financial health of corporations and ultimately the economy.  In the series, we are critical of executives motivations and the incentive structures in place that reward them handsomely for share price performance with little regard for the harm they might be doing to the long-term success of the company. The blame, however, is not just on executives and we would be remiss if we did not expand on the complicit role that shareholders play and their motivations to support executives that authorize share buybacks. When considering investors’ hunger for returns in the current extremely low interest rate environment, one better understands why corporate executives are under significant pressure from shareholders to conduct share buybacks.

The Principal-Agent Theory affords a framework from which we might develop a better appreciation for the recent popularity of buybacks. It supports the idea that shareholders are complicit partners with executives in conducting buybacks. The first step in that process requires being clear about how we should define “shareholder.” A more thorough understanding of the fundamental aspects of these dynamics, as offered here, allows for better corporate and macroeconomic analysis as well as ideas about what can be done to true-up false perceptions of value.

While this article, and the series of articles we have written on buybacks, may seem theoretical and academic it is a vital topic for investors to understand. Equity prices and corporate bond yields are based on expected earnings and cash flows. Investors may cheer buybacks today but the true cost of these transactions is steep will be extracted in the future. Failure to properly consider the cost-benefit analysis of buybacks will leave many investors at a loss to understand what went wrong with their forecasts.

Principal-Agent Theory

The Principal-Agent Problem occurs when one group, the agents, can make decisions that adversely affect another group, the principals. In the world of corporate management, the agents are the executives of corporations while the shareholders and to some degree the nation’s populace are the principals.

In the early 1970’s, economists began to argue that the motives of agents (executives) were different from those of the principals (shareholders), thus in their opinion a principal-agent problem existed. To align the interests of executive and shareholders, economists promoted a theory that executives should be given financial incentives derived from corporate stock performance. Over the last 35 years, so-called “principal-agent economists” have successfully influenced boards of directors to bestow upon executives attractive, stock-laden incentives. These rewards, in turn, motivate executives to inflate stock prices at all cost.

The guiding principle behind such incentives is that higher share prices represent increased shareholder value. While true, this is unfortunately very short sighted. Advocates of this view fail to consider that many actions designed to boost share prices in the short term can have negative effects on the company in the long run.  When an executive, for example, decides to forgo investment into a capital project and instead repurchases shares, they may push the price of their company’s stock higher, but that same decision reduces the company’s profit potential. Not only are the decisions made by an executive with a one or two-year time horizon very different from decisions made by an executive with a ten or twenty-year time horizon, but they are habit-forming in the worst way. True long-term shareholders and the prosperity of the nation as a whole suffer when the habits of short-termist logic take hold.

To illustrate the point, consider the graph below courtesy LPL Financial. From the 1940’s through the 1970’s the average holding period for equity investors was six years. Today, the average holding period has dramatically shrunk to about six months. While there are still investors that hold shares for longer time frames, most principles turn over their stock holdings much more frequently. The proper term for these short-term investors is not shareholders but rather speculators or traders who temporarily own the securities of a company. The vast majority of shareholders are not investors at all but renters with little concern for the circumstances of the company beyond their very brief holding period.

Now consider the principal-agent relationship once again. The motives of management are currently aligned with the large majority of shareholders. Both groups want a higher share price so they can profit immediately. Executives profit as their compensation package increases in value and shareholders benefit from increases in their portfolio values. Neither party is incentivized to invest in the future with an eye toward profitability of the company in the long run. While the principal-agent relationship appears to be in sync, the relationship is based on the false premise of what represents shareholder value. This relationship improperly defines “shareholder” and egregiously neglects long-term investors, employees, communities, the economy and the populace at large. 

As explained in “The Death of the Virtuous Cycle,” and a video we produced “The Animated Virtuous Cycle,” savings and investment are key to increasing productivity which fuels economic growth and national prosperity. A balanced allocation of investment into corporate capital projects allows for enhancements to the production process, the benefits of which are bestowed not only on corporations but the laborers and the population as a whole.  Alternatively, when cash flow derived from profits or debt issuance, are distributed to shareholders through share repurchases, it serves no long-term productive purpose. The intention is to alter the optics of the company’s financial statements, boost the stock price and thereby bolster executive bonuses.

Share buybacks do indeed cause earnings per share to grow by reducing the denominator, but they do not grow top-line revenue or improve the company’s market position in any way. Meanwhile, capital projects are intended to produce organic growth in revenue and earnings, but they also introduce both business risk and execution risk.  In the short run, share buybacks appear to be riskless. Hence, for “shareholders” who do not intend to maintain an interest in a company for more than a few months, their preference is for the company to grow earnings per share by engaging the “no-risk” option of buybacks.

A Solution

The concept of “maximizing shareholder value” as the over-arching determinant in corporate decision-making is seriously flawed and responsible in part for the growing misallocation of corporate capital. (Evidence supporting that idea may be found in that over the last ten years S&P 500 corporations have returned more money to shareholders via share buybacks and dividends than they have earned)  As previously discussed, the characteristics of shareholders differ markedly today from forty years ago.  Mandating the maximization of shareholder value also fails to capture the broader obligations of the agents to those who represent true stakeholders in the organization. Executives should be incentivized to promote the long-term health of their company, the prosperity of the employees who work for it and the communities in which the employees live and do their work. These objectives contrast sharply with current decision-making behavior and demands balanced investment decisions, discipline and quite often a measure of sacrifice in the short-run.

If we eliminate the theory that there is a principal-agent problem, we could radically reduce this perversion of the system imposed by extreme and misplaced financial incentives. The idea seems straight-forward until we realize that corporate executives responsible for strategic decision-making are also the beneficiaries of the maximize shareholder value concept to the tune of billions in compensation. Can corporate boards be convinced that such a change is required and are they willing to enforce such a change? That hinges on the independence of the board itself.  Anyone who espouses such ideas likely will not find themselves within a Texas mile of a corporate board seat. Without regard for the logic of the argument, asking corporate executives to behave in such an altruistic manner is naïve. Despite the fact that current decisions to use precious cash for purposes of buybacks are in almost every case negligent, it will not change from the inside out.


Special thanks to Clayton Christensen whose research inspired this article.


Technically Speaking: The Formula Behind “Buy High/Sell Low”

“Technically Speaking” is a regular Tuesday commentary updating current market trends and highlighting shorter-term investment strategies, risks, and potential opportunities. Please send any comments or questions directly to me via Email, Facebook or Twitter.


With the markets closed on Monday, there really isn’t much to update you on “technically” from this past weekend’s missive. The important point, if you haven’t read it, was:

“The failure of the market to rotate to the “risk on” trade should not be lightly dismissed.  A healthy breakout of the market should have been accompanied by both an increase in trading volume and leadership from the “smaller and riskier” stocks in the market. The chart below is the Russell 2000 Index as compared to the S&P 500 Index.

You can see this exuberance in the deviation of the S&P 500 from its long-term moving averages as compared to the collapse in the volatility index. There is simply “NO FEAR” of a correction in the markets currently which has always been a precedent for a correction in the past. 

The chart below is a MONTHLY chart of the S&P 500 which removes the daily price volatility to reveal some longer-term market dynamics. With the markets currently trading 3-standard deviations above their intermediate-term moving average, and with longer-term sell signals still weighing on the market, some caution is advisable.

While this analysis does NOT suggest an imminent “crash,” it DOES SUGGEST a corrective action is more likely than not. The only question, as always, is timing.  

However, this brings me to something I have addressed in the past but thought would be a good reminder as we head into the summer months:

“The most dangerous element to our success as investors…is ourselves.”

The Formula To Buy High / Sell Low

This past week, Mark Yusko and I had the following exchange on Twitter.


The point here is quite simple. Individuals, especially in very late-stage cyclical bull markets, tend to get “sucked” into the markets primarily due to the Wall Street and media driven hype which feeds the “fear of missing out (FOMO).”  As I noted previously:

“The longer a bull market exists, the more it is believed that it will last indefinitely.”

The chart below shows the long-term view of the market with its inherent full-market (combined secular bull and bear) cycles exposed.

The idea of full market cycles is important to understand as this is precisely how the formula functions. In the latter stages of the bull market cycle, as “exuberance” eventually sucks the last of the holdouts back in, the “buy high” side of the equation is fulfilled. The second half of the full-market cycle will complete the process.

Every year Dalbar releases their annual “Quantitative Analysis of Investor Behavior” study which continues to show just how poorly investors perform relative to market benchmarks over time. More importantly, they discuss many of the reasons for that underperformance which are all directly attributable to your brain. 

George Dvorsky once wrote that:

“The human brain is capable of 1016 processes per second, which makes it far more powerful than any computer currently in existence. But that doesn’t mean our brains don’t have major limitations. The lowly calculator can do math thousands of times better than we can, and our memories are often less than useless — plus, we’re subject to cognitive biases, those annoying glitches in our thinking that cause us to make questionable decisions and reach erroneous conclusions.

Cognitive biases are an anathema to portfolio management as it impairs our ability to remain emotionally disconnected from our money. As history all too clearly shows, investors always do the “opposite” of what they should when it comes to investing their own money. They “buy high” as the emotion of “greed” overtakes logic and “sell low” as “fear” impairs the decision-making process.

Here are the top-5 of the most insidious biases which keep you from achieving your long-term investment goals.

1) Confirmation Bias

As individuals, we tend to seek out information that conforms to our current beliefs. If one believes that the stock market is going to rise, they tend to only seek out news and information that supports that position. This confirmation bias is a primary driver of the psychological investing cycle of individuals as shown below. I discussed this just recently in why “5-Laws Of Human Stupidity” and in “Media Headlines Will Lead You To Ruin.”

As individuals, we want “affirmation” our current thought processes are correct. As human beings, we hate being told we are wrong, so we tend to seek out sources that tell us we are “right.”

This is why it is always important to consider both sides of every debate equally and analyze the data accordingly. Being right and making money are not mutually exclusive.

The issue of “confirmation bias” also creates a problem for the media. Since the media requires “paid advertisers” to create revenue, viewer or readership is paramount to obtaining those clients.  As financial markets are rising, presenting non-confirming views of the financial markets lowers views and reads as investors seek sources to “confirm” their current beliefs.

As individuals, we want “affirmation” our current thought processes are correct. As human beings, we hate being told we are wrong, so we tend to seek out sources that tell us we are “right.”

This is why it is always important to consider both sides of every debate equally and analyze the data accordingly. Being right and making money are not mutually exclusive.

2) Gambler’s Fallacy

The “Gambler’s Fallacy” is one of the biggest issues faced by individuals when investing. As emotionally driven human beings, we tend to put a tremendous amount of weight on previous events believing that future outcomes will somehow be the same.

The bias is clearly addressed at the bottom of every piece of financial literature.

“Past performance is no guarantee of future results.”

However, despite that statement being plastered everywhere in the financial universe, individuals consistently dismiss the warning and focus on past returns expecting similar results in the future.

This is one of the key issues that affect investor’s long-term returns. Performance chasing has a high propensity to fail continually causing investors to jump from one late cycle strategy to the next. This is shown in the periodic table of returns below. “Hot hands” only tend to last on average 2-3 years before going “cold.”

I traced out the returns of the S&P 500 and the Barclay’s Aggregate Bond Index for illustrative purposes. Importantly, you should notice that whatever is at the top of the list in some years tends to fall to the bottom of the list in subsequent years. “Performance chasing” is a major detraction from investor’s long-term investment returns.

Of course, it also suggests that analyzing last year’s losers, which would make you a contrarian, has often yielded higher returns in the near future. Just something to think about with “bonds” as one of the most hated asset classes currently.

3) Probability Neglect

When it comes to “risk taking” there are two ways to assess the potential outcome. There are “possibilities” and “probabilities.” As individuals, we tend to lean toward what is possible such as playing the “lottery.”  The statistical probabilities of winning the lottery are astronomical, in fact, you are more likely to die on the way to purchase the ticket than actually winning the lottery. It is the “possibility” of being fabulously wealthy that makes the lottery so successful as a “tax on poor people.”

As investors, we tend to neglect the “probabilities” of any given action which is specifically the statistical measure of “risk” undertaken with any given investment. As individuals, our bias is to “chase” stocks that have already shown the biggest increase in price as it is “possible” they could move even higher. However, the “probability” is that most of the gains are likely already built into the current move and that a corrective action will occur first.

Robert Rubin, former Secretary of the Treasury, once stated;

“As I think back over the years, I have been guided by four principles for decision making. First, the only certainty is that there is no certainty. Second, every decision, as a consequence, is a matter of weighing probabilities. Third, despite uncertainty we must decide and we must act. And lastly, we need to judge decisions not only on the results, but on how they were made.

Most people are in denial about uncertainty. They assume they’re lucky, and that the unpredictable can be reliably forecast. This keeps business brisk for palm readers, psychics, and stockbrokers, but it’s a terrible way to deal with uncertainty. If there are no absolutes, then all decisions become matters of judging the probability of different outcomes, and the costs and benefits of each. Then, on that basis, you can make a good decision.”

Probability neglect is another major component to why investors consistently “buy high and sell low.”

4) Herd Bias

Though we are often unconscious of the action, humans tend to “go with the crowd.” Much of this behavior relates back to “confirmation” of our decisions but also the need for acceptance. The thought process is rooted in the belief that if “everyone else” is doing something, they if I want to be accepted I need to do it too.

In life, “conforming” to the norm is socially accepted and in many ways expected. However, in the financial markets, the “herding” behavior is what drives market excesses during advances and declines.

As Howard Marks once stated:

“Resisting – and thereby achieving success as a contrarian – isn’t easy. Things combine to make it difficult; including natural herd tendencies and the pain imposed by being out of step, since momentum invariably makes pro-cyclical actions look correct for a while. (That’s why it’s essential to remember that ‘being too far ahead of your time is indistinguishable from being wrong.’

Given the uncertain nature of the future, and thus the difficulty of being confident your position is the right one – especially as price moves against you – it’s challenging to be a lonely contrarian.

Moving against the “herd” is where the most profits are generated by investors in the long term. The difficulty for most individuals, unfortunately, is knowing when to “bet” against the stampede.

5) Anchoring Effect

This is also known as a “relativity trap” which is the tendency for us to compare our current situation within the scope of our own limited experiences. For example, I would be willing to bet that you could tell me exactly what you paid for your first home and what you eventually sold it for.  However, can you tell me what exactly what you paid for your first bar of soap, your first hamburger or your first pair of shoes? Probably not.

The reason is that the purchase of the home was a major “life” event. Therefore, we attach particular significance to that event and remember it vividly. If there was a gain between the purchase and sale price of the home, it was a positive event and, therefore, we assume that the next home purchase will have a similar result.  We are mentally “anchored” to that event and base our future decisions around a very limited data.

When it comes to investing we do very much the same thing. If we buy a stock and it goes up, we remember that event. Therefore, we become anchored to that stock as opposed to one that lost value. Individuals tend to “shun” stocks that lost value even if they were simply bought and sold at the wrong times due to investor error. After all, it is not “our” fault that the investment lost money; it was just a bad stock. Right?

This “anchoring” effect also contributes to performance chasing over time. If you made money with ABC stock but lost money on DEF, then you “anchor” on ABC and keep buying it as it rises. When the stock begins its inevitable “reversion,” investors remain “anchored” on past performance until the “pain of ownership” exceeds their emotional threshold. It is then that they panic “sell” and are now “anchored” to a negative experience and never buy shares of ABC again.

This is ultimately the “end-game” of the current rise of the “passive indexing” mantra. When the selling begins, there will be a point where the pain of “holding” becomes to great as losses mount. It is at that point where “passive indexing” becomes “active selling” as our inherent emotional biases overtake the seemingly simplistic logic of “buy and hold.”  

Conclusion

In the end, we are just human. Despite the best of our intentions, it is nearly impossible for an individual to be devoid of the emotional biases that inevitably lead to poor investment decision making over time. This is why all great investors have strict investment disciplines that they follow to reduce the impact of human emotions.

Take a step back from the media, and Wall Street commentary, for a moment and make an honest assessment of the financial markets today. Does the current extension of the financial markets appear to be rational? Are individuals current assessing the “possibilities” or the “probabilities” in the markets?

As individuals, we are investing our hard earned “savings” into the Wall Street casino. Our job is to “bet” when the “odds” of winning are in our favor. Secondly, and arguably the most important, is to know when to “push away” from the table to keep our “winnings.”

Save