Tag Archives: Buffett

Earnings Lies & Why Munger Says “EBITDA is Bull S***”

Earnings Worse Than You Think

Just like the hit series “House Of Cards,” Wall Street earnings season has become rife with manipulation, deceit and obfuscation that could rival the dark corners of Washington, D.C.

What is most fascinating is that so many individuals invest hard earned capital based on these manipulated numbers. The failure to understand the “quality” of earnings, rather than the “quantity,” has always led to disappointing outcomes at some point in the future. 

As Drew Bernstein recently penned for CFO.com:

“Non-GAAP financials are not audited and are most often disclosed through earnings press releases and investor presentations, rather than in the company’s annual report filed with the Securities and Exchange Commission.

Once upon a time, non-GAAP financials were used to isolate the impact of significant one-time events like a major restructuring or sizable acquisition. In recent years, they have become increasingly prevalent and prominent, used by both the shiniest new-economy IPO companies and the old-economy stalwarts.”

Back in the 80’s and early 90’s companies used to report GAAP earnings in their quarterly releases. If an investor dug through the report they would find “adjusted” and “proforma” earnings buried in the back.

Today, it is GAAP earnings which are buried in the back hoping investors will miss the ugly truth.

These “adjusted or Pro-forma earnings” exclude items that a company deems “special, one-time or extraordinary.” The problem is that these “special, one-time” items appear “every” quarter leaving investors with a muddier picture of what companies are really making.

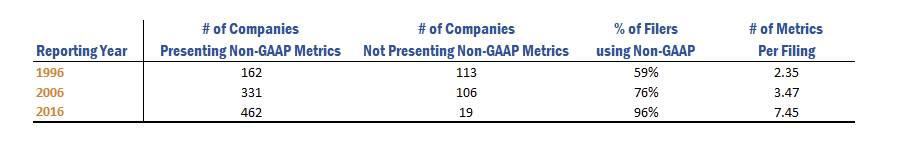
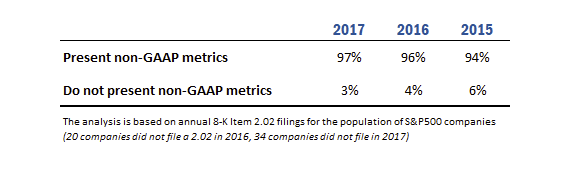
An in-depth study by Audit Analytics revealed that 97% of companies in the S&P 500 used non-GAAP financials in 2017, up from 59% in 1996, while the average number of different non-GAAP metrics used per filing rose from 2.35 to 7.45 over two decades.

This growing divergence between the earnings calculated according to accepted accounting principles, and the “earnings” touted in press releases and analyst research reports, has put investors at a disadvantage of understanding exactly what they are paying for.

As BofAML stated:

“We are increasingly concerned with the number of companies (non-commodity) reporting earnings on an adjusted basis versus those that are stressing GAAP accounting, and find the divergence a consequence of less earnings power. 

Consider that when US GDP growth was averaging 3% (the 5 quarters September 2013 through September 2014) on average 80% of US HY companies reported earnings on an adjusted basis. Since September 2014, however, with US GDP averaging just 1.9%, over 87% of companies have reported on an adjusted basis. Perhaps even more telling, between the end of 2010 and 2013, the percentage of companies reporting adjusted EBITDA was relatively constant, and since 2013, the number has been on a steady rise.

So, why do companies regularly report these Non-GAAP earnings? Drew has the answer:

“When management is asked why they resort to non-GAAP reporting, the most common response is that these measures are requested by the analysts and are commonly used in earnings models employed to value the company. Indeed, sell-side analysts and funds with a long position in the stock may have incentives to encourage a more favorable alternative presentation of earnings results.”

If non-GAAP reporting is used as a supplemental means to help investors identify underlying trends in the business, one might reasonably expect that both favorable and unfavorable events would be “adjusted” in equal measure.

However, research presented by the American Accounting Association suggests that companies engage in “asymmetric” non-GAAP exclusions of mostly unfavorable items as a tool to “beat” analyst earnings estimates.

How The Beat Earnings & Get Paid For It

Why has there been such a rise is Non-GAAP reporting?

Money, of course.

“A recent study from MIT has found that when companies make large positive adjustments to non-GAAP earnings, their CEOs make 23 percent more than their expected annual compensation would be if GAAP numbers were used. This is despite such firms having weak contemporaneous and future operating performance relative to other firms.” – Financial Executives International.

The researchers at MIT combed through the annual earnings press releases of S&P 500 firms for fiscal years 2010 through 2015 and recorded GAAP net income and non-GAAP net income when the firms disclosed it. About 67 percent of the firms in the sample disclose non-GAAP net income.

The researchers then obtained CEO compensation, accounting, and return data for the sample firms and found that “firms making the largest positive non-GAAP adjustments… exhibit the worst GAAP performance.”

The CEOs of these firms, meanwhile, earned about 23 percent more than would be predicted using a compensation model; in terms of raw dollars. In other words, they made about $2.7 million more than the approximately $12 million of an average CEO.

It should not be surprising that anytime you compensate individuals based on some level of performance, they are going to figure out ways to improve performance, legal or not. Examples run rampant through sports from Barry Bonds to Lance Armstrong, as well as in business from Enron to WorldCom.

This was detailed in a WSJ article:

One out of five [20%] U.S. finance chiefs have been scrambling to fiddle with their companies’ earnings.”

This rather “open secret” of companies manipulating bottom line earnings by utilizing “cookie-jar” reserves, heavy use of accruals, and other accounting instruments to flatter earnings is not new.

The tricks are well-known: A difficult quarter can be made easier by releasing reserves set aside for a rainy day or recognizing revenues before sales are made, while a good quarter is often the time to hide a big ‘restructuring charge’ that would otherwise stand out like a sore thumb.

What is more surprising though is CFOs’ belief that these practices leave a significant mark on companies’ reported profits and losses. When asked about the magnitude of the earnings misrepresentation, the study’s respondents said it was around 10% of earnings per share.

Manipulating earnings may work in the short-term, eventually, cost cutting, wage suppression, earnings adjustments, share-buybacks, etc. reach an effective limit. When that limit is reached, companies can no longer hide the weakness in their actual operating revenues.

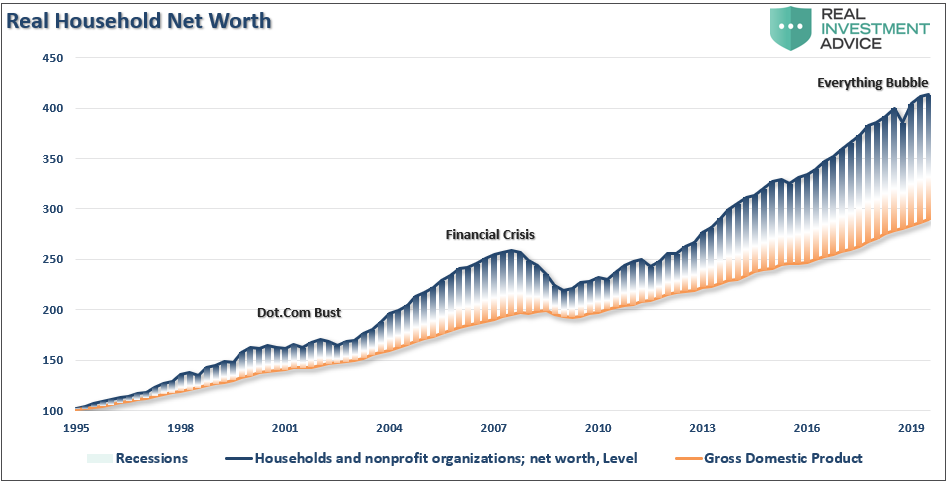
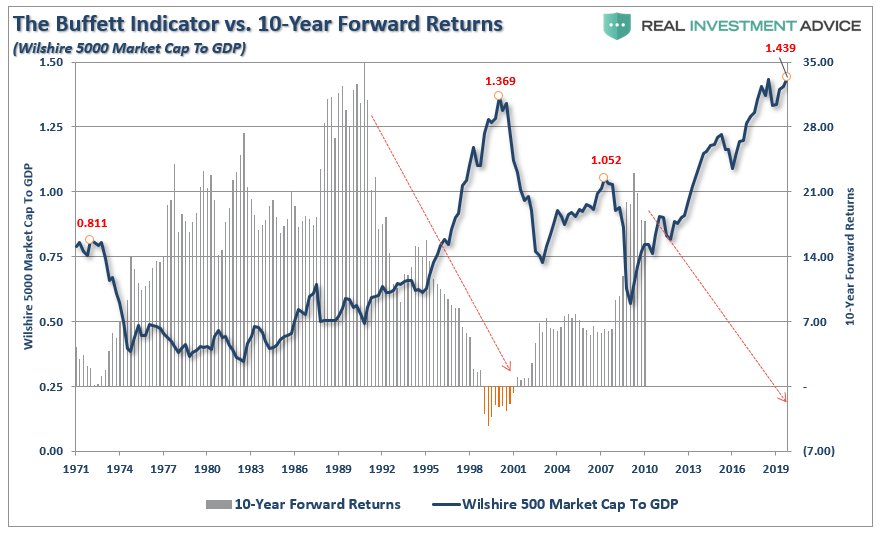
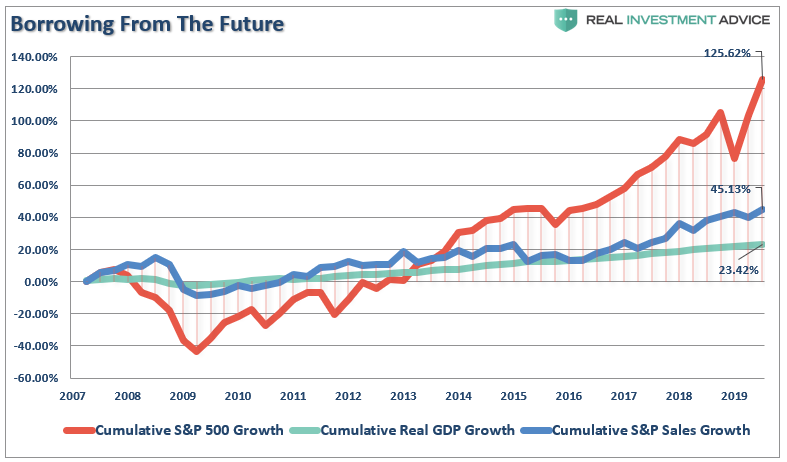
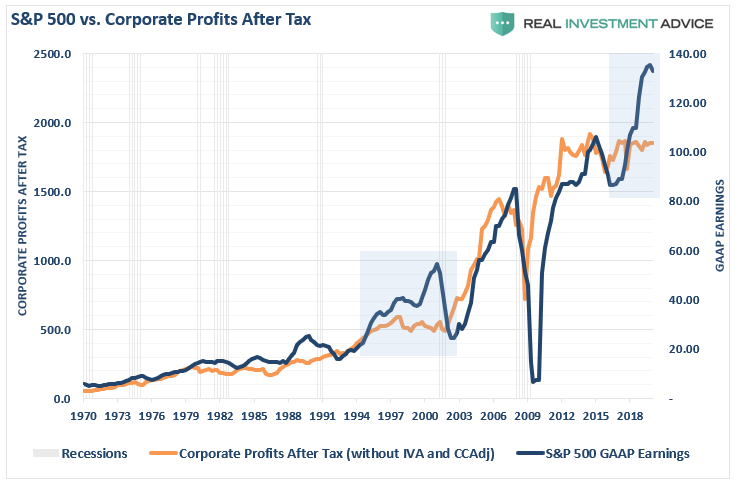
There’s a big difference between companies’ advertised performance, and how they actually did. We discussed this recently by looking at the growing deviation between corporate earnings and corporate profits. There has only been one other point where earnings, and stock market prices, were surging while corporate profits were flat. Shortly thereafter, we found out the “truth” about WorldCom, Enron, and Global Crossing.

The American Accounting Association found that over the past decade or so, more companies have shifted to emphasizing adjusted earnings. But those same companies’ results under generally accepted accounting principles, or GAAP, often only match or slightly exceed analysts’ predictions.

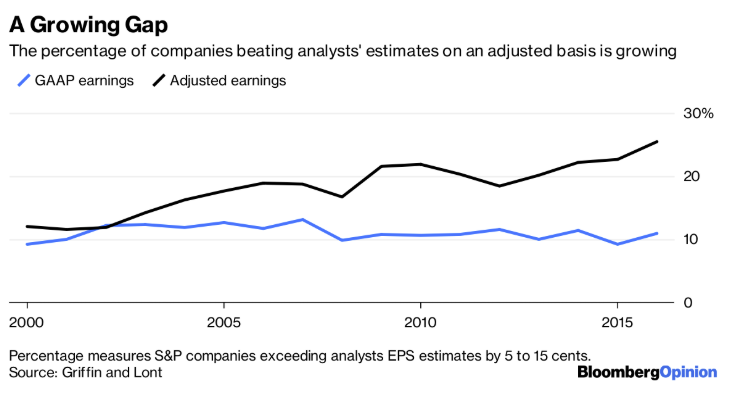
“There are those who might claim that so far this century the U.S. economy has experienced such an unusual period of economic growth that it has taken analysts and investors by surprise each quarter … for almost two decades. This view strains credulity.” – Paul Griffin, University of California & David Lont, University of Otago

After reviewing hundreds of thousands of quarterly earnings forecasts and reports of 4,700 companies over 17 years, Griffin and Lont believe companies shoot well above analysts’ targets because consistently beating earnings per share by only a penny or two became a red flag.

“If they pull out all the accounting tricks to get their earnings much higher than expected, then they are less likely to be accused of manipulation.” 

The truth is that stocks go up when companies beat their numbers, and analysts are generally biased toward wanting the stock they cover to go up. As we discussed in “Chasing The Market”, it behooves analysts to consistently lower their estimates so companies can beat them, and adjusted earnings are making it easier for them to do it.

For investors, the impact from these distortions will only be realized during the next bear market. For now, there is little help for investors as the Securities and Exchange Commission has blessed the use of adjusted results as long as companies disclose how they are calculated. The disclosures are minimal, and are easy to get around when it comes to forecasts. Worse, adjusted earnings are used to determine executive bonuses and whether companies are meeting their loan covenants. No wonder CEO pay, and leverage, just goes up.

Conclusion & Why EBITDA Is BullS***

Wall Street is an insider system where legally manipulating earnings to create the best possible outcome, and increase executive compensation has run amok,. The adults in the room, a.k.a. the Securities & Exchange Commission, have “left the children in charge,” but will most assuredly leap into action to pass new regulations to rectify reckless misbehavior AFTER the next crash.

For fundamental investors, the manipulation of earnings not only skews valuation analysis, but specifically impacts any analysis involving earnings such as P/E’s, EV/EBITDA, PEG, etc.

Ramy Elitzur, via The Account Art Of War, expounded on the problems of using EBITDA.

“One of the things that I thought that I knew well was the importance of income-based metrics such as EBITDA, and that cash flow information is not as important. It turned out that common garden variety metrics, such as EBITDA, could be hazardous to your health.”

The article is worth reading and chocked full of good information, however, here are the four-crucial points:

  1. EBITDA is not a good surrogate for cash flow analysis because it assumes that all revenues are collected immediately and all expenses are paid immediately, leading to a false sense of liquidity.
  2. Superficial common garden-variety accounting ratios will fail to detect signs of liquidity problems.
  3. Direct cash flow statements provide a much deeper insight than the indirect cash flow statements as to what happened in operating cash flows. Note that the vast majority (well over 90%) of public companies use the indirect format.
  4. EBITDA, just like net income is very sensitive to accounting manipulations.

The last point is the most critical. As Charlie Munger recently stated:

“I think there are lots of troubles coming. There’s too much wretched excess.

I don’t like when investment bankers talk about EBITDA, which I call bulls— earnings.

It’s ridiculous. EBITDA does not accurately reflect how much money a company makes, unlike traditional earnings. Think of the basic intellectual dishonesty that comes when you start talking about adjusted EBITDA. You’re almost announcing you’re a flake.”

In a world of adjusted earnings, where every company is way above average, every quarter, investors quickly lose sight of what matters most in investing.

“This unfortunate cycle will only be broken when the end-users of financial reporting — institutional investors, analysts, lenders, and the media — agree that we are on the verge of systemic failure in financial reporting. In the history of financial markets, such moments of mental clarity most often occur following the loss of vast sums of capital.” – American Accounting Association

Imaginary worlds are nice, it’s just impossible to live there.

Market Bubbles: It’s Not The Price, It’s The Mentality.

“Actually, one of the dangers is that people could be throwing risk to the wind and this [market] could be a runaway. We sometimes call that a melt-up and produces prices too high and then if there’s a shock, you come down to Earth and that could impact sentiment. I think this market is fully valued and not undervalued, but I don’t think it’s overvalued,” Jeremy Siegel

Here is an interesting thing.

“Market bubbles have NOTHING to do with valuations or fundamentals.”

Hold on…don’t start screaming “heretic,” and building gallows just yet.

Let me explain.

I can’t entirely agree with Siegel on the market being “fairly valued.” As shown in the chart below, the S&P 500 is currently trading nearly 90% above its long-term median, which is expensive from a historical perspective.

However, since stock market “bubbles” are a reflection of speculation, greed, emotional biases; valuations are only a reflection of those emotions.

In other words, bubbles can exist even at times when valuations and fundamentals might argue otherwise. Let me show you an elementary example of what I mean. The chart below is the long-term valuation of the S&P 500 going back to 1871.

Notice that with the exception of only 1929, 2000, and 2007, every other major market crash occurred with valuations at levels LOWER than they are currently. 

Secondly, all market crashes have been the result of things unrelated to valuation levels such as liquidity issues, government actions, monetary policy mistakes, recessions, or inflationary spikes. Those events were the catalyst, or trigger, that started the “reversion in sentiment” by investors.

For Every Buyer

You will commonly hear that “for every buyer, there must be a seller.”

This is a true statement. The issue becomes at “what price.” What moves prices up and down, in a normal market environment, is the price level at which a buyer and seller complete a transaction.

Market crashes are an “emotionally” driven imbalance in supply and demand.

In a market crash, the number of people wanting to “sell” vastly overwhelms the number of people willing to “buy.” It is at these moments that prices drop precipitously as “sellers” drop the levels at which they are willing to dump their shares in a desperate attempt to find a “buyer.” This has nothing to do with fundamentals. It is strictly an emotional panic, which is ultimately reflected by a sharp devaluation in market fundamentals.

Bob Bronson once penned:

“It can be most reasonably assumed that markets are sufficient enough that every bubble is significantly different than the previous one, and even all earlier bubbles. In fact, it’s to be expected that a new bubble will always be different than the previous one(s) since investors will only bid up prices to extreme overvaluation levels if they are sure it is not repeating what led to the last, or previous bubbles. Comparing the current extreme overvaluation to the dotcom is intellectually silly.

I would argue that when comparisons to previous bubbles become most popular – like now – it’s a reliable timing marker of the top in a current bubble. As an analogy, no matter how thoroughly a fatal car crash is studied, there will still be other fatal car crashes in the future, even if the previous accident-causing mistakes are avoided.”

Comparing the current market to any previous period in the market is rather pointless. The current market is not like 1995, 1999, or 2007? Valuations, economics, drivers, etc. are all different from cycle to the next. Most importantly, however, the financial markets adapt to the cause of the previous “fatal crashes,” but that adaptation won’t prevent the next one.

It’s All Relative

Last week, in our MacroView, I touched on George Soros’ theory on bubbles, which is worth expanding a bit on in the context of this article.

Financial markets, far from accurately reflecting all the available knowledge, always provide a distorted view of reality. The degree of distortion may vary from time to time. Sometimes it’s quite insignificant, at other times it is quite pronounced. When there is a significant divergence between market prices and the underlying reality, the markets are far from equilibrium conditions.

Every bubble has two components:

  1. An underlying trend that prevails in reality, and; 
  2. A misconception relating to that trend.

When positive feedback develops between the trend and the misconception, a boom-bust process is set into motion. The process is liable to be tested by negative feedback along the way, and if it is strong enough to survive these tests, both the trend and the misconception will be reinforced. Eventually, market expectations become so far removed from reality that people are forced to recognize that a misconception is involved. A twilight period ensues during which doubts grow, and more people lose faith, but the prevailing trend is sustained by inertia.

As Chuck Prince, former head of Citigroup, said, ‘As long as the music is playing, you’ve got to get up and dance. We are still dancing.’ Eventually, a tipping point is reached when the trend is reversed; it then becomes self-reinforcing in the opposite direction.”

Typically bubbles have an asymmetric shape. The boom is long and slow to start. It accelerates gradually until it flattens out again during the twilight period. The bust is short and steep because it involves the forced liquidation of unsound positions.

The chart below is an example of asymmetric bubbles.

The pattern of bubbles is interesting because it changes the argument from a fundamental view to a technical view. Prices reflect the psychology of the market, which can create a feedback loop between the markets and fundamentals.

This pattern of bubbles can be seen at every bull market peak in history. The chart below utilizes Dr. Robert Shiller’s stock market data going back to 1900 on an inflation-adjusted basis with an overlay of the asymmetrical bubble shape.

As Soro’s went on to state:

Financial markets do not play a purely passive role; they can also affect the so-called fundamentals they are supposed to reflect. These two functions, that financial markets perform, work in opposite directions.

  • In the passive or cognitive function, the fundamentals are supposed to determine market prices. 
  • In the active or manipulative function market, prices find ways of influencing the fundamentals. 

When both functions operate at the same time, they interfere with each other. The supposedly independent variable of one function is the dependent variable of the other, so that neither function has a truly independent variable. As a result, neither market prices nor the underlying reality is fully determined. Both suffer from an element of uncertainty that cannot be quantified.”

Currently, there is a strong belief the financial markets are not in a bubble, and the arguments supporting that belief are based on comparisons to past market bubbles.

It is likely that in a world where there is virtually “no fear” of a market correction, an overwhelming sense of “urgency” to be invested, and a continual drone of “bullish chatter;” the markets are poised for the unexpected, unanticipated, and inevitable event.

Reflections

When thinking about excess, it is easy to see the reflections of excess in various places. Not just in asset prices but also in “stuff.” All financial assets are just claims on real wealth, not actual wealth itself. A pile of money has use and utility because you can buy stuff with it. But real wealth is the “stuff” — food, clothes, land, oil, and so forth.  If you couldn’t buy anything with your money/stocks/bonds, their worth would revert to the value of the paper they’re printed on (if you’re lucky enough to hold an actual certificate). 

But trouble begins when the system gets seriously out of whack.

“GDP” is a measure of the number of goods and services available and financial asset prices represent the claims (it’s not a very accurate measure of real wealth, but it’s the best one we’ve got.) Notice the divergence of asset prices from GDP as excesses develop.

What we see is that the claims on the economy should, quite intuitively, track the economy itself. Excesses occur whenever the claims on the economy, the so-called financial assets (stocks, bonds, and derivatives), get too far ahead of the economy itself.

This is a very important point. 

“The claims on the economy are just that: claims. They are not the economy itself!”

Take a step back from the media, and Wall Street commentary, for a moment and make an honest assessment of the financial markets today.

The increase in speculative risks, combined with excess leverage, leave the markets vulnerable to a sizable correction at some point in the future. The only missing ingredient for such a correction is the catalyst to bring “fear” into an overly complacent marketplace.  

It is all reminiscent of the market peak of 1929 when Dr. Irving Fisher uttered his now famous words: “Stocks have now reached a permanently high plateau.” 

This “time IS different.” 

However, “this time” is only different from the standpoint the variables are not exactly the same as they have been previously. The variables never are, but the outcome is always the same.

The Next Decade: Valuations & The Destiny Of Low Returns

Jani Ziedins via Cracked Market recently penned an interesting post:

“As for what comes next, is this bull market tired? Is a crash long overdue? Not if you look at history. Stocks rallied for nearly 20 years between the early 1980s and the late 1990s. By that measure, we could easily see another decade of strong gains before the next “Big One”. Of course, the worst day in stock market history happened during that 20-year bull market in 1987, so we cannot be complacent. But the prognosis for the next 10 years is still good even if we run into a few 20% corrections along the way.”

After a decade of strong, liquidity-driven, post-crisis returns in the financial markets, investors are hopeful the next decade will deliver the same, or better. As Bob Farrell once quipped:

“Bull markets are more fun than bear markets.” 

However, from an investment standpoint, the real question is:

“Can the next decade deliver above average returns, or not?”

Lower Returns Ahead?

Brian Livingston, via MarketWatch, previously wrote an article on the subject of valuation measures and forward returns.

“Stephen Jones, a financial and economic analyst who works in New York City, tracks the formulas that several market wizards have disclosed. He recently updated his numbers through Dec. 31, 2018, and shared them with me. Buffett, Shiller, and the other boldface names had nothing to do with Jones’s calculations. He crunched the financial celebrities’ formulas himself, based on their public statements.

“The graph above doesn’t show the S&P 500’s price levels. Instead, it reveals how well the projection methods estimated the market’s 10-year rate of return in the past. The round markers on the right are the forecasts for the 10 years that lie ahead of us. All of the numbers for the S&P 500 include dividends but exclude the consumer-price index’s inflationary effect on stock prices.”

  • Shiller’s P/E10 predicts a +2.6% annualized real total return.
  • Buffett’s MV/GDP says -2.0%.
  • Tobin’s “q” ratio indicates -0.5%.
  • Jones’s Composite says -4.1%.

(Jones uses Buffett’s formula but adjusts for demographic changes.) 

Here is the important point:

“The predictions might seem far apart, but they aren’t. The forecasts are all much lower than the S&P 500’s annualized real total return of about 6% from 1964 through 2018.”

While these are not guarantees, and should never be used to try and “time the market,” they are historically strong predictors of future returns.

As Jones notes:

“The market’s return over the past 10 years,” Jones explains, “has outperformed all major forecasts from 10 years prior by more than any other 10-year period.”

Of course, as noted above, this is due to the unprecedented stimulation the Federal Reserve pumped into the financial markets. Regardless, markets have a strong tendency to revert to their average performance over time, which is not nearly as much fun as it sounds.

The late Jack Bogle, founder of Vanguard, also noted some concern from high valuations:

“The valuations of stocks are, by my standards, rather high, butmy standards, however, are high.”

When considering stock valuations, Bogle’s method differs from Wall Street’s. For his price-to-earnings multiple, Bogle uses the past 12-months of reported earnings by corporations, GAAP earnings, which includes “all of the bad stuff.” Wall Street analysts look at operating earnings, “earnings without all that bad stuff,” and come up with a price-to-earnings multiple of something in the range of 17 or 18, versus current real valuations which are pushing nearly 30x earnings.

“If you believe the way we look at it, much more realistically I think, the P/E is relatively high. I believe strongly that [investors] should be realizing valuations are fairly full, and if they are nervous they could easily sell off a portion of their stocks.” – Jack Bogle

These views are vastly different than the optimistic views currently being bantered about for the next decade.

However, this is where an important distinction needs to be made.

Starting Valuations Matter Most

What Jani Ziedins missed in his observation was the starting level of valuations which preceded those 20-year “secular bull markets.”  This was a point I made previously:

“The chart below shows the history of secular bull market periods going back to 1871 using data from Dr. Robert Shiller. One thing you will notice is that secular bull markets tend to begin with CAPE 10 valuations around 10x earnings or even less. They tend to end around 23-25x earnings or greater. (Over the long-term valuations do matter.)”

The two previous 20-year secular bull markets begin with valuations in single digits. At the end of the first decade of those secular advances, valuations were still trading below 20x.

The 1920-1929 secular advance most closely mimics the current 2010 cycle. While valuations started below 5x earnings in 1919, they eclipsed 30x earnings ten-years later in 1929. The rest, as they say, is history. Or rather, maybe “past is prologue” is more fitting.

Low Returns Mean High Volatility

When low future rates of return are discussed, it is not meant that each year will be low, but rather the return for the entire period will be low. The chart below shows 10-year rolling REAL, inflation-adjusted, returns in the markets. (Note: Spikes in 10-year returns, which occurred because the 50% decline in 2008 dropped out of the equation, has previously denoted peaks in forward annual returns.)

(Important note: Many advisers/analysts often pen that the market has never had a 10 or 20-year negative return. That is only on a nominal basis and should be disregarded as inflation must be included in the debate.)

There are two important points to take away from the data.

  1. There are several periods throughout history where market returns were not only low, but negative.(Given that most people only have 20-30 functional years to save for retirement, a 20-year low return period can devastate those plans.)
  2. Periods of low returns follow periods of excessive market valuations and encompass the majority of negative return years. (Read more about this chart here)

“Importantly, it is worth noting that negative returns tend to cluster during periods of declining valuations. These ‘clusters’ of negative returns are what define ‘secular bear markets.’” 

While valuations are often dismissed in the short-term because there is not an immediate impact on price returns. Valuations, by their very nature, are HORRIBLE predictors of 12-month returns and should never be used in any investment strategy which has such a focus. However, in the longer term, valuations are strong predictors of expected returns.

The chart below shows Dr. Robert Shiller’s cyclically adjusted P/E ratio combined with Tobin’s Q-ratio. Again, valuations only appear cheap when compared to the peak in 2000. Outside of that exception, the financial markets are, without question, expensive. 

Furthermore, note that forward 10-year returns do NOT improve from historically expensive valuations, but decline rather sharply.

Warren Buffett’s favorite valuation measure is also screaming valuation concerns (which may explain why he is sitting on $128 billion in cash.). The following measure is the price of the Wilshire 5000 market capitalization level divided by GDP. Again, as noted above, asset prices should be reflective of underlying economic growth rather than the “irrational exuberance” of investors. 

Again, with this indicator at the highest valuation level in history, it is a bit presumptuous to assume that forward returns will continue to remain elevated,.

Bull Now, Pay Later

In the short-term, the bull market continues as the flood of liquidity, and accommodative actions, from global Central Banks, has lulled investors into a state of complacency rarely seen historically. As Richard Thaler, the famous University of Chicago professor who won the Nobel Prize in economics stated:

We seem to be living in the riskiest moment of our lives, and yet the stock market seems to be napping. I admit to not understanding it.

I don’t know about you, but I’m nervous, and it seems like when investors are nervous, they’re prone to being spooked. Nothing seems to spook the market.”

While market analysts continue to come up with a variety of rationalizations to justify high valuations, none of them hold up under real scrutiny. The problem is the Central Bank interventions boost asset prices in the short-term, in the long-term, there is an inherently negative impact on economic growth. As such, it leads to the repetitive cycle of monetary policy.

  1. Using monetary policy to drag forward future consumption leaves a larger void in the future that must be continually refilled.
  2. Monetary policy does not create self-sustaining economic growth and therefore requires ever larger amounts of monetary policy to maintain the same level of activity.
  3. The filling of the “gap” between fundamentals and reality leads to consumer contraction and ultimately a recession as economic activity recedes.
  4. Job losses rise, wealth effect diminishes and real wealth is destroyed. 
  5. Middle class shrinks further.
  6. Central banks act to provide more liquidity to offset recessionary drag and restart economic growth by dragging forward future consumption. 
  7. Wash, Rinse, Repeat.

If you don’t believe me, here is the evidence.

The stock market has returned more than 125% since 2007 peak, which is roughly 3x the growth in corporate sales and 5x more than GDP.

It is critical to remember the stock market is NOT the economy. The stock market should be reflective of underlying economic growth which drives actual revenue growth. Furthermore, GDP growth and stock returns are not highly correlated. In fact, some analysis suggests that they are negatively correlated and perhaps fairly strongly so (-0.40).

However, in the meantime, the promise of another decade of a continued bull market is very enticing as the “fear of missing out” overrides the “fear of loss.”

Let me conclude with this quote from Vitaliy Katsenelson which sums up our investing view:

Our goal is to win a war, and to do that we may need to lose a few battles in the interim.

Yes, we want to make money, but it is even more important not to lose it. If the market continues to mount even higher, we will likely lag behind. The stocks we own will become fully valued, and we’ll sell them. If our cash balances continue to rise, then they will. We are not going to sacrifice our standards and thus let our portfolio be a byproduct of forced or irrational decisions.

We are willing to lose a few battles, but those losses will be necessary to win the war. Timing the market is an impossible endeavor. We don’t know anyone who has done it successfully on a consistent and repeated basis. In the short run, stock market movements are completely random – as random as you’re trying to guess the next card at the blackjack table.”

For long-term investors, the reality that a clearly overpriced market will eventually mean revert should be a clear warning sign. Given the exceptionally high probability the next decade will be disappointing, gambling your financial future on a 100% stock portfolio is likely not advisable.