Our interim global forecast is the second prepared in March and is much more pessimistic than our 17 March regularly scheduled outlook. It is based on major downgrades to forecasts of the US economy and oil prices. The risks remain overwhelmingly on the downside and further downgrades are almost assured.
IHS Markit now believes the COVID-19 recession will be deeper than the one following the global financial crisis in 2008-09. Real world GDP should plunge 2.8% in 2020 compared with a drop of 1.7% in 2009. Many key economies will see double-digit declines (at annualized rates) in the second quarter, with the contraction continuing into the third quarter.
It will likely take two to three years for most economies to return to their pre-pandemic levels of output. More troubling is the likelihood that, because of the negative effects of the uncertainty associated with the virus on capital spending, the path of potential GDP will be lower than before. This happened in the wake of the global financial crisis.
Six Key Points
Based on recent data and developments, IHS Markit has slashed the US 2020 forecast to a contraction of 5.4%.
Because of the deep US recession and collapsing oil prices, IHS Markit expects Canada’s economy to contract 3.3% this year, before seeing a modest recovery in 2021.
Europe, where the number of cases continues to grow rapidly and lockdowns are pervasive, will see some of the worst recessions in the developed world, with 2020 real GDP drops of approximately 4.5% in the eurozone and UK economies. Italy faces a decline of 6% or more. The peak GDP contractions expected in the second quarter of 2020 will far exceed those at the height of the global financial crisis.
Japan was already in recession, before the pandemic. The postponement of the summer Tokyo Olympics will make the downturn even deeper. IHS Markit expects a real GDP contraction of 2.5% this year and a very weak recovery next year.
China’s economic activity is expected to have plummeted at a near-double-digit rate in the first quarter. It will then recover sooner than other countries, where the spread of the virus has occurred later. IHS Markit predicts growth of just 2.0% in 2020, followed by a stronger-than-average rebound in 2021, because of its earlier recovery from the pandemic.
Emerging markets growth will also be hammered. Not only are infection rates rising rapidly in key economies, such as India, but the combination of the deepest global recession since the 1930s, plunging commodity prices, and depreciating currencies (compounding already dangerous debt burdens) will push many of these economies to the breaking point.
No V-Shaped Recovery
With that, Markit came around to my point of view all along. Those expecting a V-shaped recovery are sadly mistaken.
I have been amused by Goldman Sachs and Morgan Stanley predictions of a strong rebound in the third quarter.
It’s a list of projections from an excellent must see video presentation by Jim Bianco. I added my own thoughts on the key points.
The bottom line is don’t expect a v-shaped recovery. We will not return to the old way of doing business.
Globalization is not over, but the rush to globalize everything is. This will impact earnings for years to come.
Finally, stimulus checks are on the way, but there will be no quick return to buying cars, eating out, or traveling as much.
Boomers who felt they finally had enough retirement money just had a quarter of it or more wiped out.
It will take a long time, if ever, for the same sentiment to return. Spending will not recover. Boomers will die first, and they are the ones with the most money.
Shedlock: Fed Trying To Save The Bond Market As Unemployment Explodes
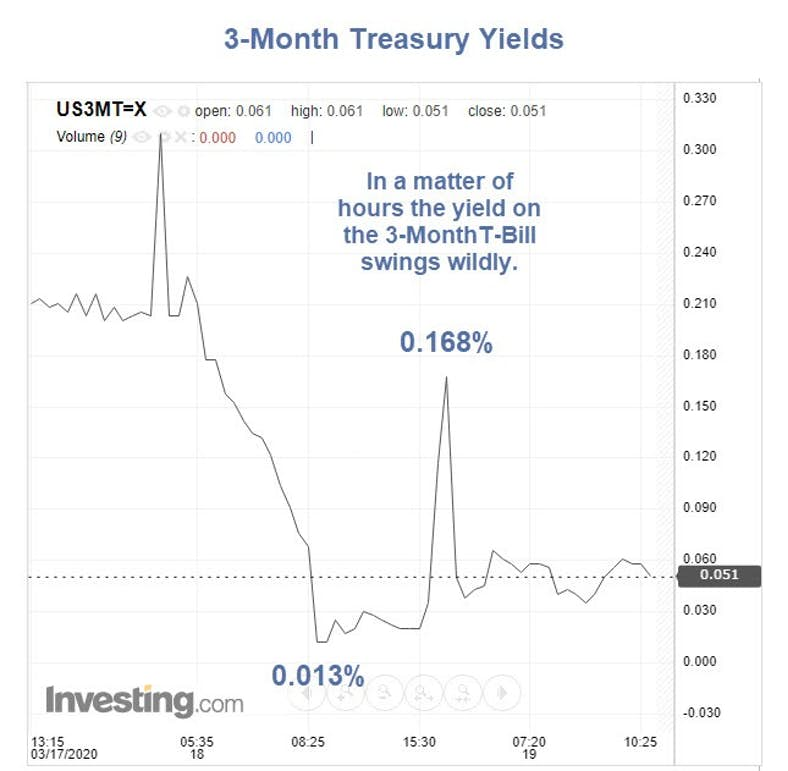
Bond market volatility remains a sight to behold, even at the low end of the curve.
Bond Market Dislocations Remain
The yield on a 3-month T-Bill fell to 1.3 basis points then surged to 16.8 basis points in a matter of hours. The yield then quickly crashed to 3 basis points and now sits at 5.1 basis points.
The Fed is struggling even with the low end of the Treasury curve.
$IRX 3-Month Yield
Stockcharts shows the 3-month yield ($IRX) dipping below zero but Investing.Com does not show the yield went below zero.
In a crisis, it is said, all correlations go to one. Threats get so overwhelming that everything reacts in unison. And the common thread running through all facets of financial markets and the real economy right now is simple: a global cash crunch of epic proportions.
Investors piled $137 billion into cash-like assets in the five days ending March 11, according to a Bank of America report citing EPFR Global data. Its monthly fund manager survey showed the fourth-largest monthly jump in allocations to cash ever, from 4% to 5.1%.
“Cash has become the king as the short-term government funds have had massive deposits, with ~$13 billion inflows last week (a 10-standard deviation move),” adds Maneesh Dehspande, head of equity derivatives strategy at Barclays.
4th Largest Jump in History
It’s quite telling that a jump of a mere 1.1 percentage point to 5.1% cash is the 4th largest cash jump in history.
Margin and Short Covering
“In aggregate, the market saw a large outflow, with $9 billion of long liquidation and $6 billion of short covering,” said Michael Haigh, global head of commodity research at Societe Generale. “This general and non-directional closure of money manager positions could be explained by a need for cash to pay margin calls on other derivatives contracts.”
The comment is somewhat inaccurate. Sideline cash did not change “in aggregate” although cash balances t various fund managers did.
This is what happens when leveraged longs get a trillion dollar derivatives margin call or whatever the heck it was.
Need a Better Hedge
With the S&P 500 down more than 12% in the five sessions ending March 17, the Japanese yen is weaker against the greenback, the 10-year Treasury future is down, and gold is too.
That’s another sign dollars are top of mind, and investors are selling not only what they want to, but also what they have to.
Dash to Cash
It’s one thing to see exchange-traded products stuffed full of relatively illiquid corporate bonds trade below the purported sum of the value of their holdings. It’s quite another to see such a massive discount develop in a more plain-vanilla product like the Vanguard Total Bond Market ETF (BND) as investors ditched the product to raise cash despite not quite getting their money’s worth.
The fund closed Tuesday at a discount of nearly 2% to its net asset value, which blew out to above 6% last week amid accelerating, record outflows. That exceeded its prior record discount from 2008.
It is impossible for everyone to go to cash at the same time.
Someone must hold every stock, every bond and every dollar.
The Fed said the swaps, in which the Fed accepts other currencies in exchange for dollars, will for at least the next six months allow the central banks of Australia, Brazil, South Korea, Mexico, Singapore, Sweden, Denmark, Norway and New Zealand to tap up to a combined total of $450 billion, money to ensure the world’s dollar-dependent financial system continues to function.
The new swap lines “like those already established between the Federal Reserve and other central banks, are designed to help lessen strains in global U.S. dollar funding markets, thereby mitigating the effects of these strains on the supply of credit to households and businesses, both domestically and abroad,” the Fed said in a statement.
The central banks of South Korea, Singapore, Mexico and Sweden all said in separate statements they intended to use them.
Fed Does Another Emergency Repo and Relaunches Commercial Paper Facility
The Fed blew three economic bubbles in succession. A deflationary bust has started. They blew bubbles trying to prevent “deflation” defined as falling consumer prices.
BIS Deflation Study
The BIS did a historical study and found routine price deflation was not any problem at all.
“Deflation may actually boost output. Lower prices increase real incomes and wealth. And they may also make export goods more competitive,” stated the BIS study.
Deflation is not really about prices. It’s about the value of debt on the books of banks that cannot be paid back by zombie corporations and individuals.
Blowing bubbles in absurd attempts to arrest “price deflation” is crazy. The bigger the bubbles the bigger the resultant “asset bubble deflation”. Falling consumer prices do not have severe negative repercussions. Asset bubble deflations are another matter.
Assessing the Blame
Central banks are not responsible for the coronavirus. But they are responsible for blowing economic bubbles prone to crash.
The equities bubbles before the coronavirus hit were the largest on record.
Dollar Irony
The irony in this madness is the US will be printing the most currency and have the biggest budget deficits as a result. Yet central banks can’t seem to get enough dollars. In that aspect, the dollar ought to be sinking.
But given the US 10-year Treasury yield at 1.126% is among the highest in the world, why not exchange everything one can for dollars earning positive yield.
This is all such circular madness, it’s hard to say when or how it ends.
Unemployment Set To Explode
A SurveyUSA poll reveals 9% of the US is out of a job due to the coronavirus.
9% of Working Americans (14 Million) So Far Have Been Laid Off As Result of Coronavirus; 1 in 4 Workers Have Had Their Hours Reduced;
2% Have Been Fired; 20% Have Postponed a Business Trip; Shock Waves Just Now Beginning to Ripple Through Once-Roaring US Economy:
Early markers on the road from recession to depression as the Coronavirus threatens to stop the world from spinning on its axis show that 1 in 4 working Americans have had their hours reduced as a result of COVID-19, according to SurveyUSA’s latest time-series tracking poll conducted 03/18/20 and 03/19/20.
Approximately 160 million Americans were employed in the robust Trump economy 2 months ago. If 26% have had their hours reduced, that translates to 41 million Americans who this week will take home less money than last, twice as many as SurveyUSA found in an identical poll 1 week ago. Time-series tracking graphs available here.
9% of working Americans, or 14 million of your friends and neighbors, will take home no paycheck this week, because they were laid off, up from 1% in an identical SurveyUSA poll 1 week ago. Time-series tracking graphs available here.
Unlike those laid-off workers who have some hope of being recalled once the worst of the virus has past, 2% of Americans say they have lost their jobs altogether as a result of the virus, up from 1% last week.
Of working Americans, 26% are working from home either some days or every day, up from 17% last week. A majority, 56%, no longer go to their place of employment, which means they are not spending money on gasoline or transit tokens.
About: SurveyUSA interviewed 1,000 USA adults nationwide 03/18/20 through 03/19/20. Of the adults, approximately 60% were, before the virus, employed full-time or part-time outside of the home and were asked the layoff and reduced-hours questions. Approximately half of the interviews for this survey were completed before the Big 3 Detroit automakers announced they were shutting down their Michigan assembly lines. For most Americans, events continue to unfold faster than a human mind is able to process the consequences.
If we assume the SurveyUSA numbers are accurate and will not get worse, we can arrive at some U3 and U6 unemployment estimates.
Baseline Unemployment Estimate (U3)
Unemployed: 5.787 million + 14 million = 19.787 million unemployed
Civilian Labor Force: 164.546 million (unchanged)
Unemployment Rate: 19.787 / 164.546 = 12.0%
That puts my off the top of the head 15.0% estimate a few days in the ballpark.
Underemployment Estimate (U6)
Employed: 158.759 million.
26% have hours reduced = 41.277 million
Part Time for Economic Reasons: 4.318 million + 41.277 million = 45.595 million underemployed
45.595 million underemployed + 19.787 million unemployed = 65.382 million
Civilian Labor Force: 164.546 million (unchanged)
U6 Unemployment Rate: 65.382 / 164.546 = 39.7%
Whoa Nellie
Wow, that’s not a recession. A depression is the only word.
Note that economists coined a new word “recession” after the 1929 crash and stopped using the word depression assuming it would never happen again.
Prior to 1929 every economic slowdown was called a depression. So if you give credit to the Fed for halting depressions, they haven’t. Ity’s just a matter of semantics.
Depression is a very fitting word if those numbers are even close to what’s going to happen.
The Fed blew three economic bubbles in succession. A deflationary bust has started. They blew bubbles trying to prevent “deflation” defined as falling consumer prices.
BIS Deflation Study
The BIS did a historical study and found routine price deflation was not any problem at all.
“Deflation may actually boost output. Lower prices increase real incomes and wealth. And they may also make export goods more competitive,” stated the BIS study.
Deflation is not really about prices. It’s about the value of debt on the books of banks that cannot be paid back by zombie corporations and individuals.
Blowing bubbles in absurd attempts to arrest “price deflation” is crazy. The bigger the bubbles the bigger the resultant “asset bubble deflation”. Falling consumer prices do not have severe negative repercussions. Asset bubble deflations are another matter.
Assessing the Blame
Central banks are not responsible for the coronavirus. But they are responsible for blowing economic bubbles prone to crash.
The equities bubbles before the coronavirus hit were the largest on record.
Dollar Irony
The irony in this madness is the US will be printing the most currency and have the biggest budget deficits as a result. Yet central banks can’t seem to get enough dollars. In that aspect, the dollar ought to be sinking.
But given the US 10-year Treasury yield at 1.126% is among the highest in the world, why not exchange everything one can for dollars earning positive yield.
This is all such circular madness, it’s hard to say when or how it ends.
Shedlock: Supply And Demand Shocks Coming Up
Dual economic shocks are underway simultaneously. There are shortages of some things and lack of demand for others.
The coronavirus is delivering a one-two punch to the world economy, laying it low for months to come and forcing investors to reprice equities and bonds to account for lower company earnings.
From one side, the epidemic is hammering the capacity to produce goods as swathes of Chinese factories remain shuttered and workers housebound. That’s stopping production of goods there and depriving companies elsewhere of the materials they need for their own businesses.
With the virus no longer contained to China, increasingly worried consumers everywhere are reluctant to shop, travel or eat out. As a result, companies are likely not only to send workers home, but to cease hiring or investing — worsening the hit to spending.
How the two shocks will reverberate has sparked some debate among economists, with Harvard University Professor Kenneth Rogoff writing this week that a 1970s style supply-shortage-induced inflation jolt can’t be ruled out. Others contend another round of weakening inflation is pending.
Some economists argue that what’s happened is mostly a supply side shock, others have highlighted the wallop to demand as well, to the degree that the distinction matters.
Slowest Since the Financial Crisis
Inflationary or Deflationary?
In terms of prices, it’s a bit of both, but mostly the latter.
There’s a run on sanitizers, face masks, toilet paper ect. Prices on face masks, if you can find them, have gone up.
But that is dwarfed by the demand shock coming from lack of wages for not working, not traveling, not eating out etc.
The lost wages for 60 million people in China locked in will be a staggering hit alone.
That has also hit Italy. It will soon hit the US.
Next add in the fear from falling markets. People, especially boomers proud of their accounts (and buying cars like mad) will stop doing so.
It will be sudden.
Bad Timing
COVID-19 comes at a tricky time for the global economy. Take Japan. The Oct sales tax hike saw GDP fall 1.6% q/q in Q4, taking year-over-year growth negative (black). That's a weak base even before factoring in Q1 deterioration in the manufacturing (blue) & services (red) PMIs… pic.twitter.com/iUZwQ1U2LA
'The stockpiling crisis that has hit supermarkets across Asia has spread to Europe as consumers start hoarding groceries and hygiene products amid fears of a coronavirus pandemic.' https://t.co/uV5OK1zLJj
Like in many other places, Euro zone is vulnerable to COVID-19 because its starting point is so weak. Growth in Q4 was just 0.1% q/q and it's hard to see how 2020 will be much better than 0.5% overall, far below the ECB forecast of 1.1% (as of Dec). Deflation risk is rising… pic.twitter.com/oLUbIKwHLg
The COVID-19 shock is likely to accelerate the structural shift away from brick & mortar retail in the US. Growth in core retail sales was already weak through Jan, even before virus anxiety built (top lhs). COVID-19 is, unfortunately, another reason to order online (top rhs)… pic.twitter.com/feu30pC4pW
There's a debate if COVID-19 is a supply or demand shock. There's evidence of supply disruption in longer delivery times in manufacturing. But we don't for a second worry that prices will rise, because weak demand swamps all that. Net net: negative demand shock dominates by far. pic.twitter.com/OtyMoJHTDT
Deflation is not really about prices. It’s about the value of debt on the books of banks that cannot be paid back by zombie corporations and individuals.
That is what the Fed fears. It takes lower and lower yields to prevent a debt crash. But it is entirely counterproductive and it does not help the consumer, only the asset holders. Fed (global central bank) policy is to blame.
These are the important point all the inflationistas miss.
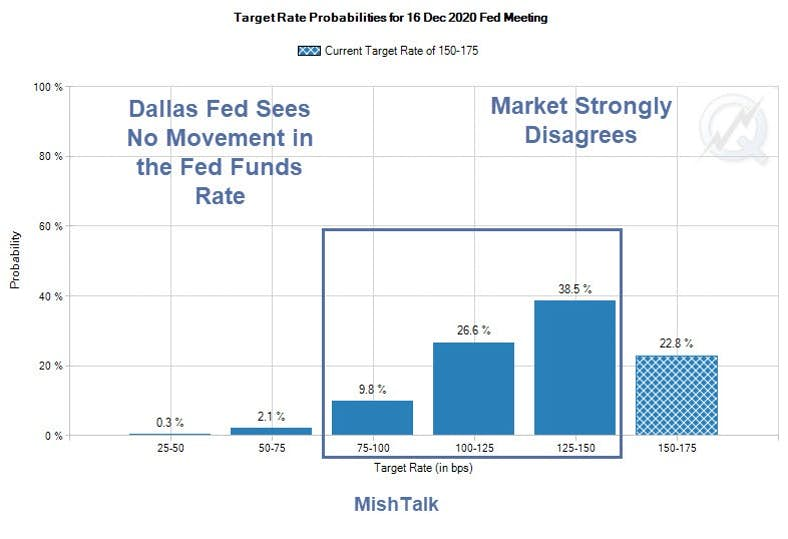
Dallas Fed President Sees “No Move” In Fed Funds Rate
Dallas Fed President Robert Kaplan made some interesting comments today on interest rates, repos, and the coronavirus.
Dallas Fed President Robert Kaplan was on panel discussion today at the University of Texas McCombs School of Business on the “2020 Business Outlook: Real Estate and the Texas Economy” in Austin, Texas.
Bloomberg Econoday Synopsis
Dallas Fed President Robert Kaplan is neutral right now on monetary policy, saying neither a rate cut nor a rate hike are necessary in the medium term. “My base case is no movement up or down in the Fed funds rate [in 2020], but I’ll be monitoring [things] carefully … this year,” Kaplan said in a panel discussion.
Kaplan believes the outlook for the economy has stabilized and if anything has “firmed”, and though he now has “a more confident outlook” he isn’t ready to commit to a rate hike saying it’s “too soon to judge if a hike is coming, and you’ve got a number of [risky] factors going on.”
Regarding a so-called “coronavirus cut” to reassure markets, Kaplan doesn’t see justification yet adding, however, that he is carefully watching how the virus unfolds and that he will have a better sense of its effects over the next few months. Kaplan also noted that he will be watching the first-half impact of the Boeing 737 production shutdown.
On repo operations, Kaplan described the rise in the Fed’s balance sheet through year-end as “substantial” but he sees slowing growth through June. “I’d be hopeful and expect that as we continue bill purchases during the second quarter, the repo usage will begin to decline and the headline net balance-sheet growth for the Fed will moderate – certainly far more moderate than what’s we’ve seen to this period.”
On inflation, Kaplan’s base case is an upward trend toward 2 percent in the medium term. Kaplan said the Fed is debating whether to lengthen out its look at inflation from a one-year average to perhaps a two-year average. “We look at a variety of factors to make our judgment.”
Regarding no interest rate movement, the market disagrees, and so do I.
On inflation, the entire fed is clueless about what it is.
David Rosenberg explores Recession Arithmetic in today’s Breakfast With Dave. I add a few charts of my own to discuss.
Rosenberg notes “Private fixed investment has declined two quarters in a row as of 2019 Q3. Since 1980, this has only happened twice outside of a recession.”
Here is the chart he presented.
Fixed Investment, Imports, Government Share of GDP
Since 1980 there have been five recessions in the U.S.and only once, after the dotcom bust in 2001, was there a recession that didn’t feature an outright decline in consumption expenditures in at least one quarter. Importantly, even historical comparisons are complicated. The economy has changed over the last 40 years. As an example, in Q4 of 1979, fixed investment was 20% of GDP, while in 2019 it makes up 17%. Meanwhile, imports have expanded from 10% of GDP to 15% and the consumer’s role has risen from 61% to 68% of the economy. All that to say, as the structure of the economy has evolved so too has its susceptibility to risks. The implication is that historical shocks would have different effects today than they did 40 years ago.
So, what similarities exist across time? Well, every recession features a decline in fixed investment (on average -9.8% from the pre-recession period), and an accompanying decline in imports (coincidentally also about -9.5% from the pre-recession period). Given the persistent trade deficit, it’s not surprising that declines in domestic activity would result in a drawdown in imports (i.e. a boost to GDP).
So, what does all of this mean for where we are in the cycle? Private fixed investment has declined two quarters in a row as of 2019 Q3. Since 1980, this has only happened two other times outside of a recession. The first was in the year following the burst of the dotcom bubble, as systemic overinvestment unwound itself over the course of eight quarters. The second was in 2006, as the housing market imploded… and we all know how that story ended.Small sample bias notwithstanding, we can comfortably say that this is not something that should be dismissed offhand.
For now, the consumer has stood tall. Real consumption expenditures contributed 3.0% to GDP in Q2, and 2.1% in Q3. Whether the consumer can keep the economy from tipping into recession remains to be seen.
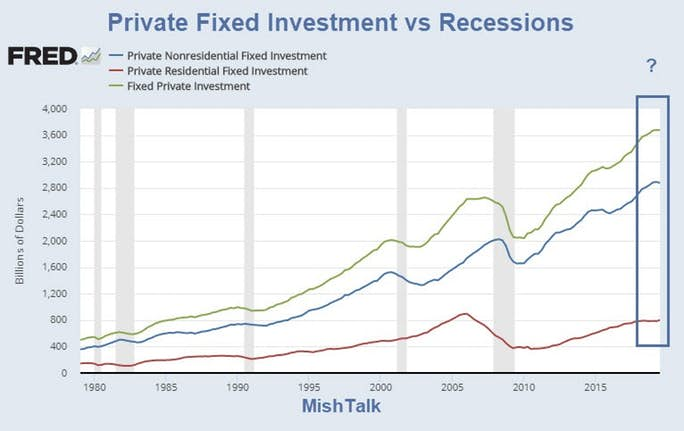
Dave’s comments got me thinking about the makeup of fixed investment. It does not take much of a slowdown to cause a recession. But there are two components and they do not always move together.
Fixed Investment Year-Over-Year
One thing easily stands out. Housing marked the bottom in 12 of 13 recessions. 2001 was the exception.
Fixed Investment Year-Over-Year Detail
Fixed Investment Tipping Point
We are very close to a tipping point in which residential and nonresidential fixed investment are near the zero line. The above chart shows recessions can happen with fixed investment still positive year-over-year.
Pater Tenebrarum at the Acting Man blog pinged me with this idea: The only caveat remains the large net speculative long position, but at the moment this strikes me almost as a “bear hook” that is keeping people on the sidelines waiting for the “inevitable” pullback while the train is leaving the station.
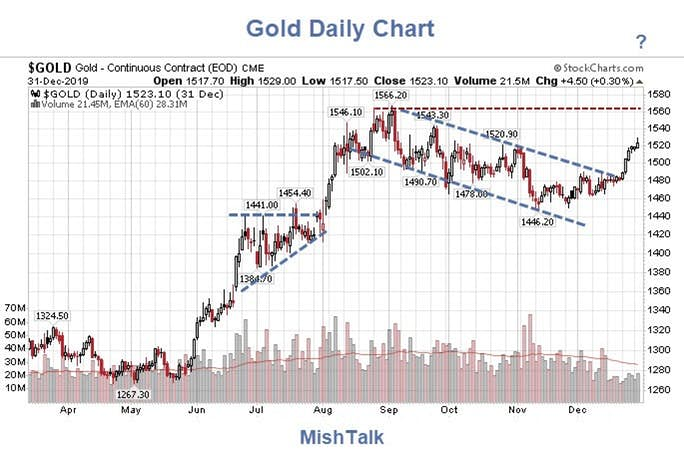
With the 6-year consolidation over, there is every reason fundamentally and technically for gold to continue up.
So, be my guest if you want to time gold to COT positions.
Technically Speaking
Technically, there is short-term monthly resistance between here and $1566. Perhaps there’s a pullback now, but with technical and fundamentals otherwise aligned why bet on it?
The next technical resistance area is the $1700 to $1800 area so any move above $1566 is likely to be a fast, strong one, perhaps with a retest of the $1566 area from above that.
It is important to note that nearly every ounce of gold ever mined is still in existence. A small fraction of that mined gold has been lost, and other small fractions sit in priceless statues in museums etc., and is thus not available for sale.
Otherwise, someone has to hold every ounce of gold ever mined, 100% of the time. That is the true supply. Jewelry buying and mine output are insignificant in comparison. We are not about to run out of gold as some gold shills suggest.
Mises refers to the desire to hold gold as “Reservation Demand“, that is the desire of people to hold their gold coins, bullion, bars, and jewelry rather than trading it for something else.
If we strike out jewelry buying, central bank buying, the dollar, and mine supply, what then determines “Reservation Demand” to own gold vs some other asset?
Faith in Central Banks
Talk of normalization was nonsense, as were various “Dot Plots” that suggested the Fed was on a major hiking cycle.
The market did not believe the Fed, neither did I, and neither did gold.
Once again we are back to my central gold theme question.
Is everything under control or not?
We respect your privacy and will only send you email that is related to what you subscribed to and why you subscribed. You can unsubscribe whenever you want with just a click of your mouse. For more information please see... Disclosure & Privacy Policy.