Cartography Corner – April 2020
J. Brett Freeze and his firm Global Technical Analysis (GTA) provides RIA Pro subscribers Cartography Corner on a monthly basis. Brett’s analysis offers readers a truly unique brand of technical insight and risk framework. We personally rely on Brett’s research to help better gauge market trends, their durability, and support and resistance price levels.
GTA presents their monthly analysis on a wide range of asset classes, indices, and securities. At times the analysis may agree with RIA Pro technical opinions, and other times it will run contrary to our thoughts. Our goal is not to push a single view or opinion, but provide research to help you better understand the markets. Please contact us with any questions or comments. If you are interested in learning more about GTA’s services, please connect with them through the links provided in the article.
The link below penned by GTA provides a user’s guide and a sample of his analysis.
March 2020 Review
E-Mini S&P 500 Futures
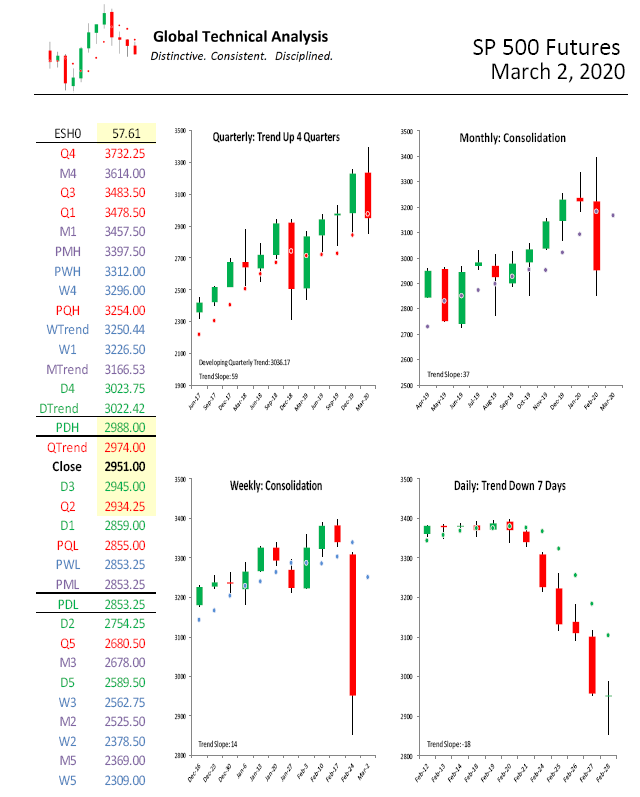
We begin with a review of E-Mini S&P 500 Futures (ESM(H)0) during March 2020. In our March 2020 edition of The Cartography Corner, we wrote the following:
In isolation, monthly support and resistance levels for March are:
- M4 3614.00
- M1 3457.50
- PMH 3397.50
- MTrend 3166.53
- Close 2951.00
- PML 2853.25
- M3 2678.00
- M2 2525.50
- M5 2369.00
Active traders can use 3166.50 as the pivot, whereby they maintain a long position above that level and a flat or short position below it.
Figure 1 below displays the daily price action for March 2020 in a candlestick chart, with support and resistance levels isolated by our methodology represented as dashed lines. The first trading session of March saw the market price rise, reflecting market participants’ “buy-the-dip” mentality towards February’s weakness and anticipation of the Federal Reserve responding with further monetary stimulus. The high trade for March was realized during the second trading session at 3137.00, just under our isolated pivot at March Monthly Trend, MTrend: 3166.53. The following two trading sessions saw lower highs, yet they also afforded market participants reasonable opportunities to sell against March Monthly Trend. On March 6th, 2020, the market price began to break lower, with clustered support at QTrend: 2974 and Q2: 2934.25 being surpassed intra-session and the market price settling the session below QTrend.
During the following session, March 9th, the market price gapped lower on the open, breaking and settling below another clustered support zone at PQL: 2855.00 and PML:2853.25. The following two trading sessions were spent with the market price oscillating between PQL / PML now acting as resistance and isolated support at M3: 2678.00. On March 12th, the market price descended below isolated support at M3: 2678 and M2: 2525.50, stopping short of achieving the Monthly Downside Exhaustion level for March at M5: 2369.00. The following three trading sessions were spent with the market oscillating between M3: 2678.00 now acting as resistance and support at M5: 2369.00. The Monthly Downside Exhaustion level was first achieved on March 16th, 2020.
With the market price having achieved our isolated Monthly Downside Exhaustion level, our focus turned immediately to our weekly support levels. The following four trading sessions, March 18th through March 23rd, saw the market price continue to descend below M5: 2369.00. The low price for March was achieved on March 23rd at the price of 2174.00.
On March 23rd, the Federal Reserve committed to unlimited quantitative easing (QE). That action stopped the market price descent and a rally ensued. The final six trading sessions of March saw the market price rise sharply from the low, with monthly (and weekly) support levels acting as resistance.
Active traders following our monthly analysis had the opportunity to capture a 24% profit.
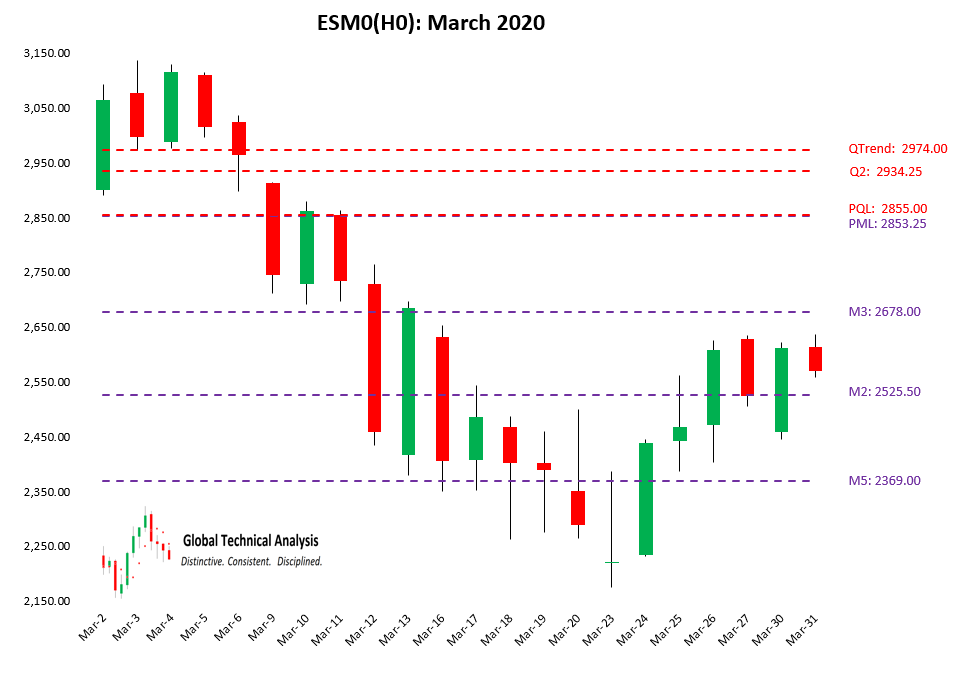
Figure 1:
Gold Futures
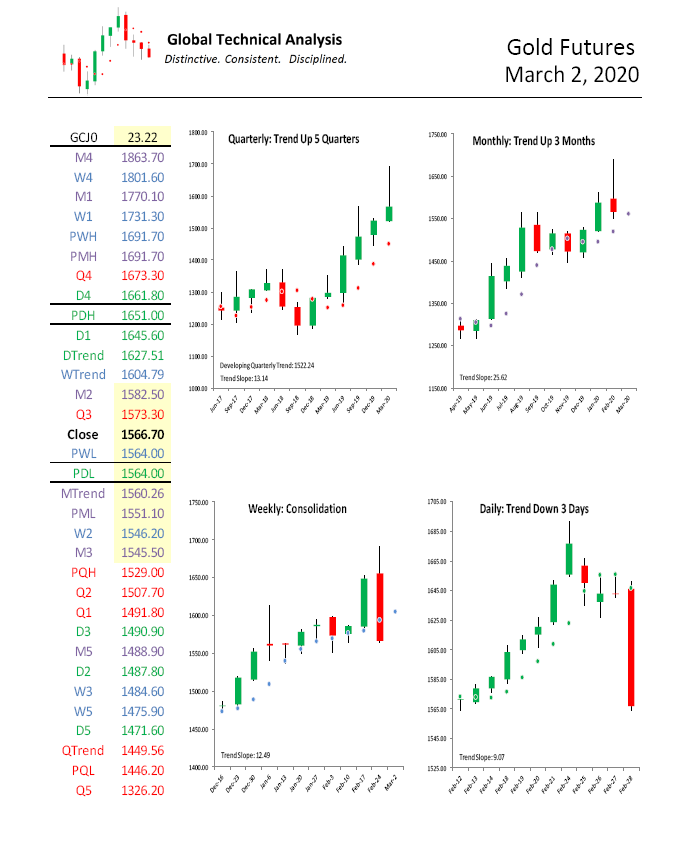
We continue with a review of Gold Futures (GCM(J)0) during March 2020. In our March 2020 edition of The Cartography Corner, we wrote the following:
In isolation, monthly support and resistance levels for March are:
- M4 1863.70
- M1 1770.10
- PMH 1691.70
- M2 1582.50
- Close 1566.70
- MTrend 1560.26
- PML 1551.10
- M3 1545.50
- M5 1488.90
Active traders can use 1545.50 as the pivot, whereby they maintain a long position above that level and a flat or short position below it.
Figure 2 below displays the daily price action for March 2020 in a candlestick chart, with support and resistance levels isolated by our methodology represented as dashed lines. The first six trading sessions of March, aided by the Federal Reserve’s actions on March 3rd, saw the market price ascend to and surpass intra-session February’s high price at PMH: 1691.70. However, the market price did not settle above February’s high.
Over the following four trading sessions, the market price descended through multiple isolated support levels, including our isolated pivot at M3: 1545.50. On March 16th, our Monthly Downside Exhaustion level for March at M5: 1488.90 was achieved and exceeded intra-session. The low price for the month at 1451.74 was realized during that session. The following four sessions were spent with the market price oscillating between clustered support levels at MTrend: 1560.26 / PML: 1551.10 / M3: 1545.50, now acting as resistance, and Monthly Downside Exhaustion level acting as support.
The Federal Reserve announcement of unlimited quantitative easing on March 23rd re-ignited market participant’s enthusiasm for Gold. The market price cleared the clustered support levels at MTrend: 1560.26 / PML: 1551.10 / M3: 1545.50, now acting as resistance. On March 24th and March 25th, the market price ascended to and surpassed intra-session February’s high price at PMH: 1691.70. The final four trading sessions of March were spent with the market price essentially drifting sideways, with a final push lower towards isolated support at M2: 1582.50.
Our analysis essentially bound the realized range for March.
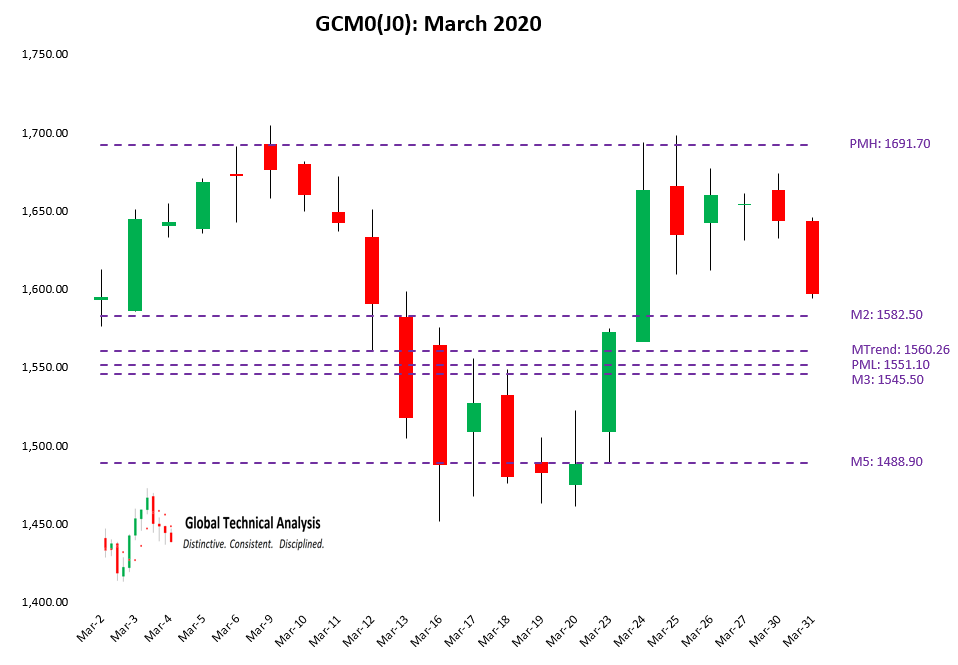
Figure 2:
April 2020 Analysis
E-Mini S&P 500 Futures
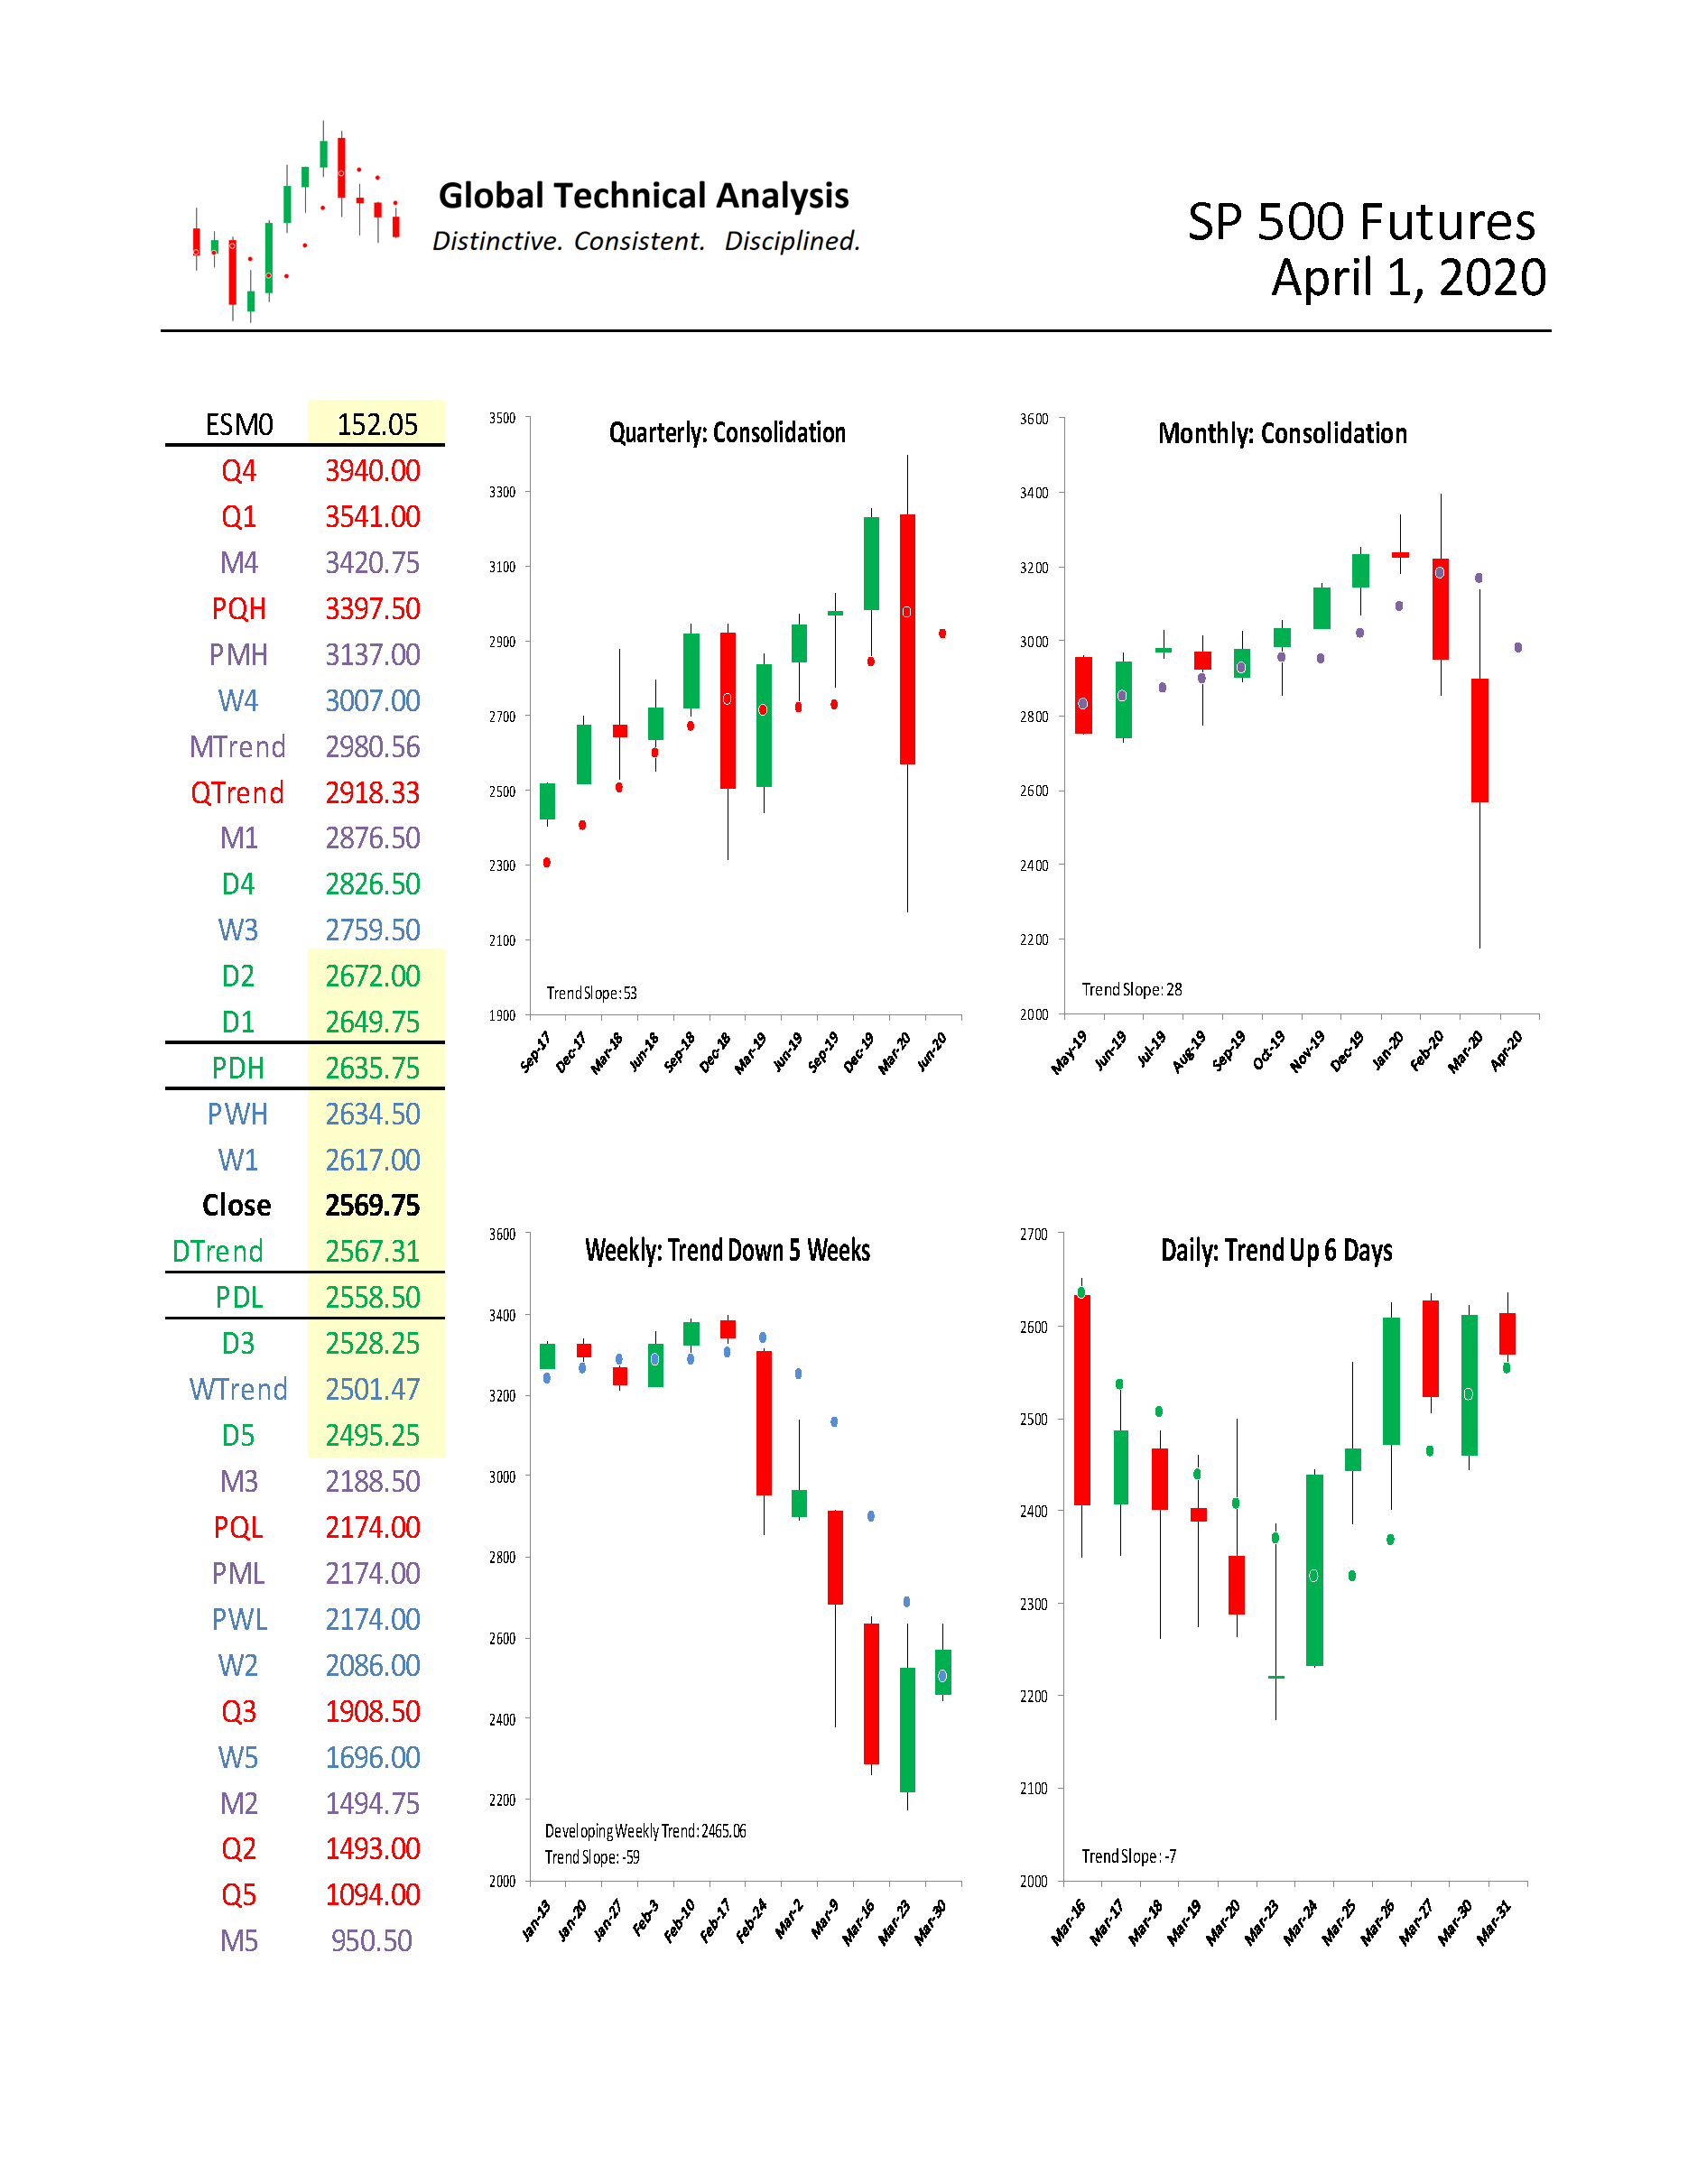
We begin by providing a monthly time-period analysis of E-Mini S&P 500 Futures (ESM0). The same analysis can be completed for any time-period or in aggregate.
Trends:
- Monthly Trend 2980.56
- Quarterly Trend 2918.33
- Current Settle 2569.75
- Daily Trend 2567.31
- Weekly Trend 2501.47
In the quarterly time-period, the chart shows that E-Mini S&P 500 Futures are in “Consolidation”, after having been “Trend Up” for four quarters. Stepping down one time-period, the monthly chart shows that E-Mini S&P 500 Futures are in “Consolidation”, settling below Monthly Trend for two months. Stepping down to the weekly time-period, the chart shows that E-Mini S&P 500 Futures have been “Trend Down” for five weeks. The relative positioning of the Trend Levels has lost its bullish posture.
We wrote in March, “The final piece of the sustained Trend Reversal puzzle is a quarterly settlement under Quarterly Trend at QTrend: 2974.00.” March’s settlement completed the puzzle.
One rule we have is to anticipate a two-period high (low), within the following four to six periods, after a Downside (Upside) Exhaustion level has been reached. We now anticipate a 2-period high in the quarterly time- period over the next four to six quarters, in the monthly time-period over the next four to six months, and in the weekly time-period within two weeks. This does not mean the market price will immediately reverse higher, as those two-period highs can occur at lower absolute levels. In our judgment, in bear markets, two-period highs are the safest place to sell. Illustrations of this concept, in the monthly time-period, can be found in our April 2018 commentary.
Support/Resistance:
In isolation, monthly support and resistance levels for April are:
- M4 3420.75
- PMH 3137.00
- MTrend 2980.56
- M1 2876.50
- Close 2569.75
- M3 2188.50
- PML 2174.00
- M2 1494.75
- M5 950.50
Given that the first monthly resistance and support levels are roughly 300 and 400 points away from the current market price, we suggest active traders rely upon our weekly analysis to guide them directionally.
For less-active market participants with an intermediate or long time-period focus, we suggest using MTrend: 2980.56 and QTrend: 2918.33 as the pivot, respectively. Maintain a flat or short position below the pivot and a long position above the pivot.
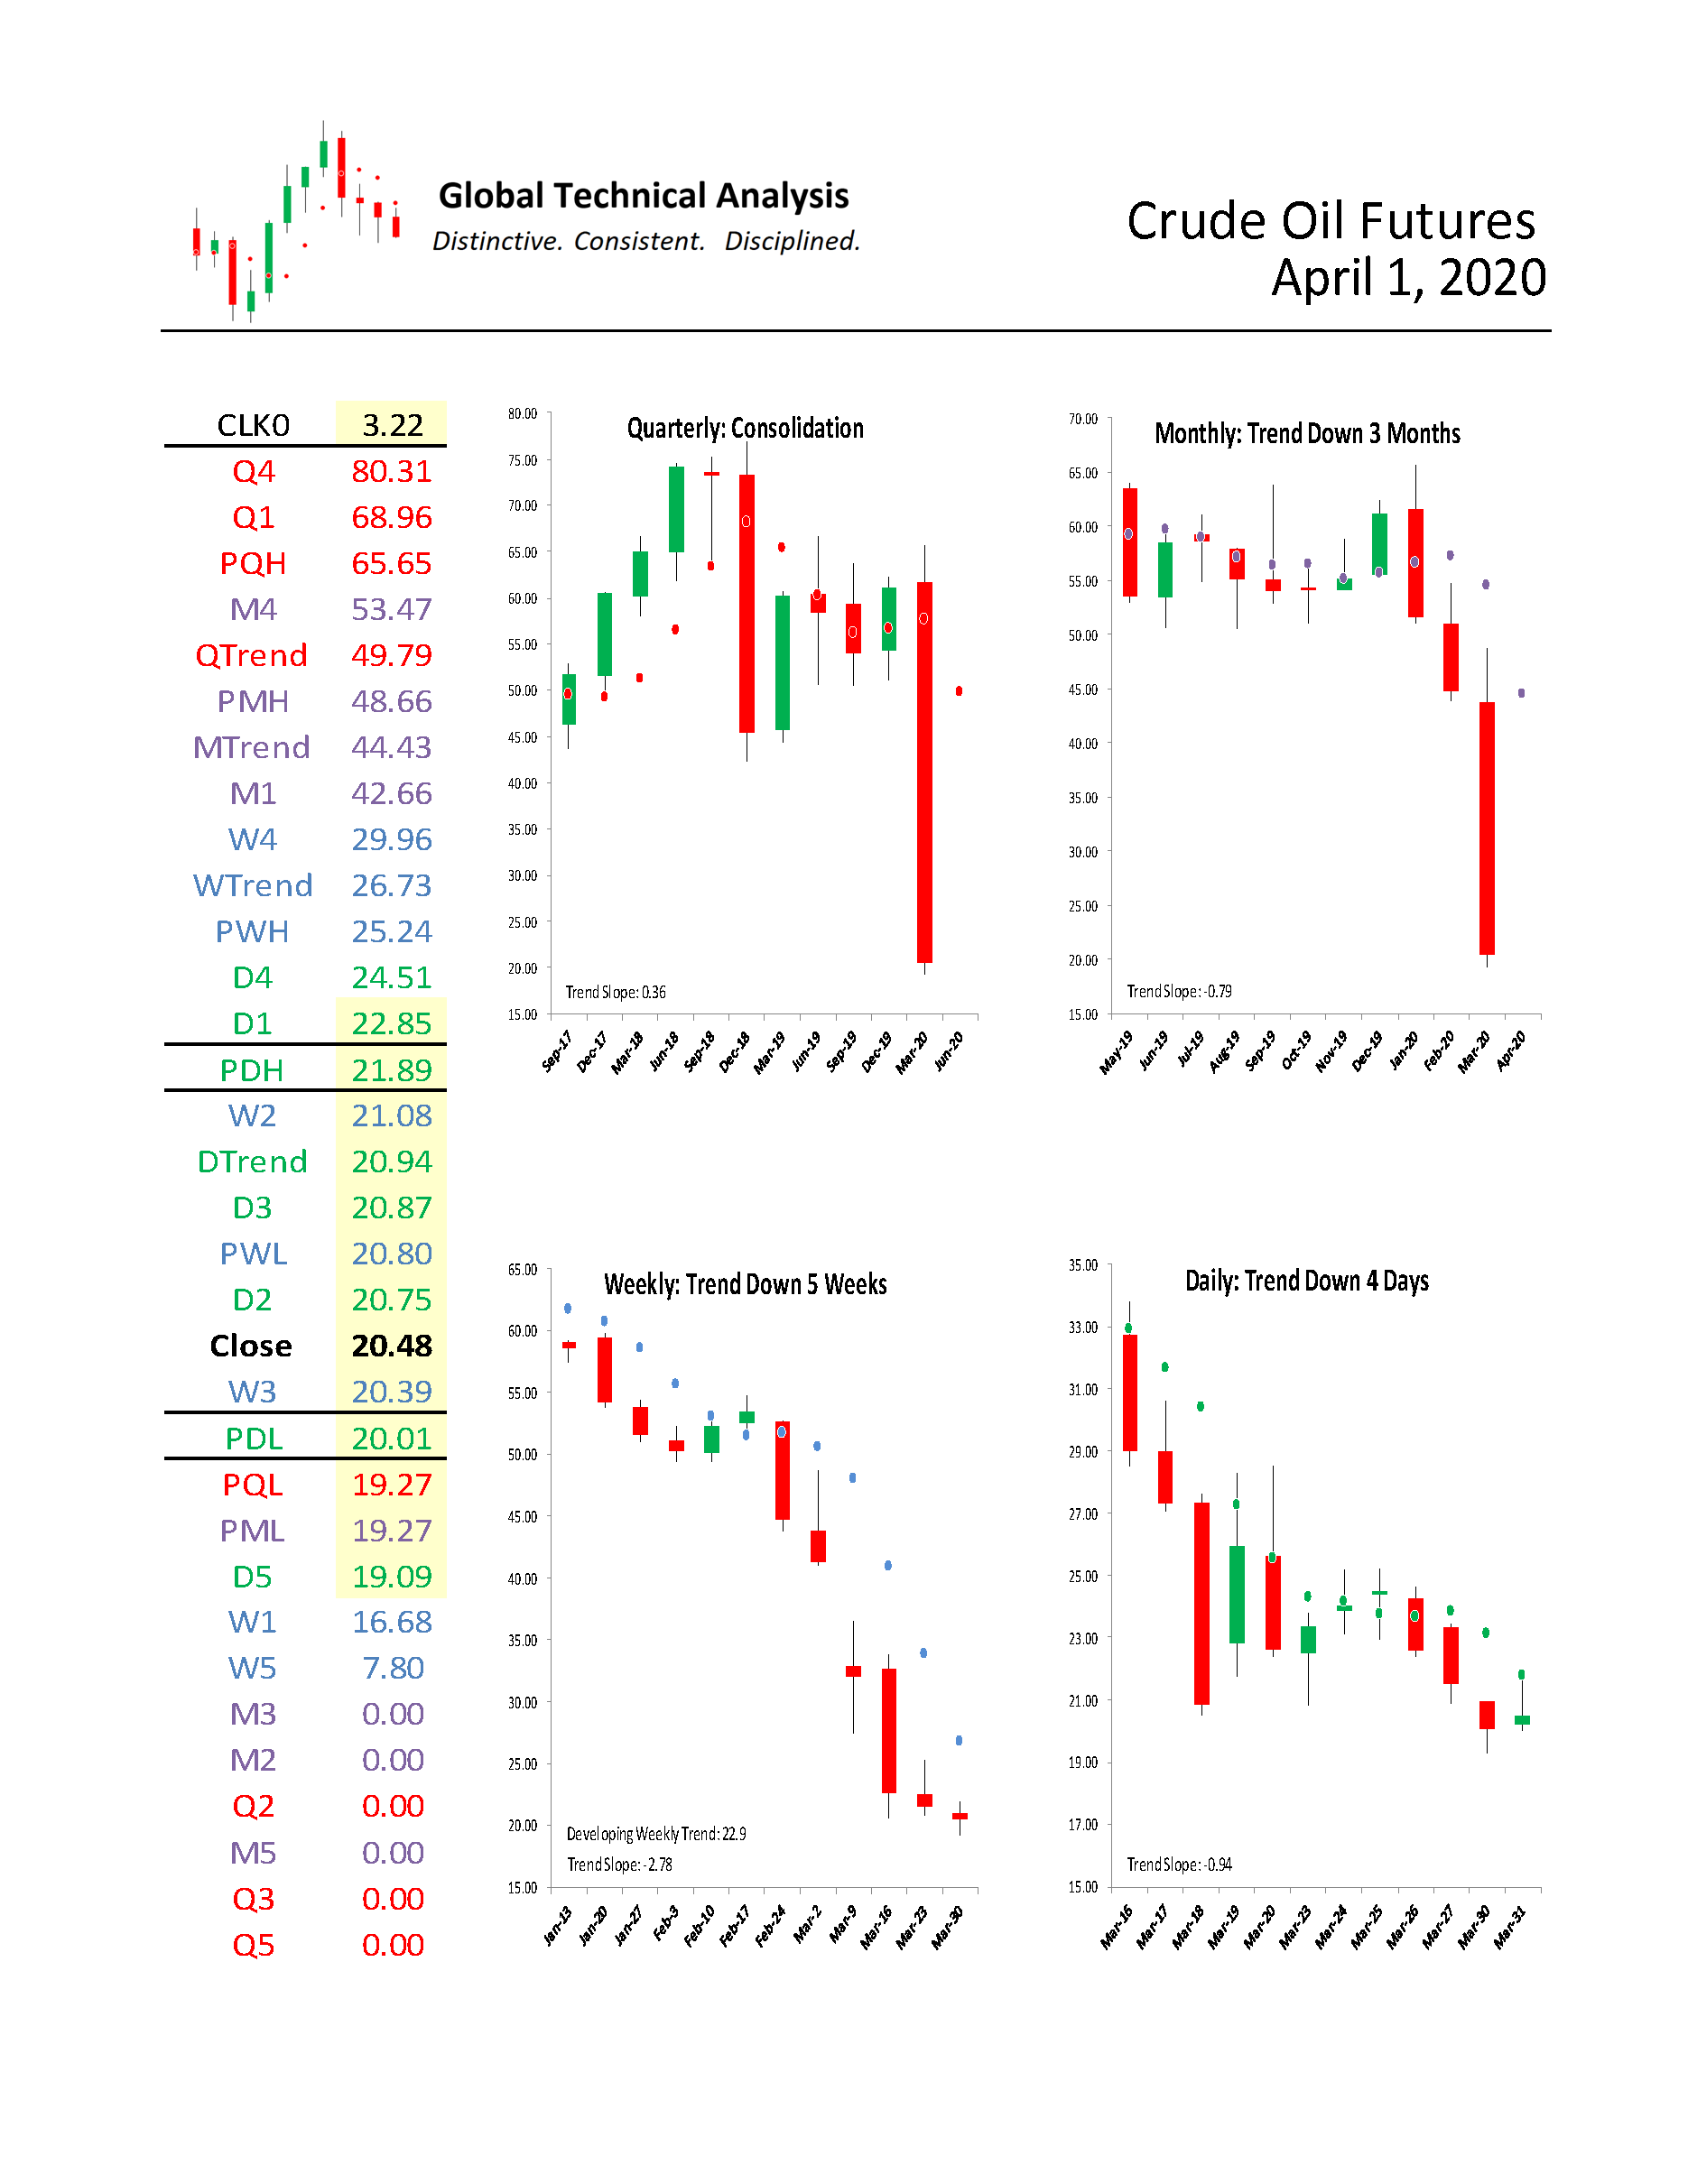
WTI Crude Oil Futures
For April, we focus on WTI Crude Oil Futures (“Crude”). We provide a monthly time-period analysis of CLK0. The same analysis can be completed for any time-period or in aggregate.
Trends:
- Quarterly Trend 49.79
- Monthly Trend 44.43
- Weekly Trend 26.73
- Daily Trend 20.94
- Current Settle 20.48
As can be seen in the quarterly chart below, Crude is in “Consolidation”. Stepping down one time-period, the monthly chart shows that Crude has been “Trend Down” for three months. Stepping down to the weekly time-period, the chart shows that Crude has been “Trend Down” for five weeks.
Our model got short Crude in January with the break of Monthly Trend. We had no insight into the actions of Saudi Arabia concerning oil output and pricing. As we have, please consider the following words of wisdom from Ed Seykota:
“A surprise is an event that catches someone unaware. If you are already on the trend, the surprises seem to happen to the other guys.”
To our knowledge, no one predicted that Saudi Arabia would boost production and cut its selling price for oil.
Support/Resistance:
In isolation, monthly support and resistance levels for April are:
- M4 53.47
- PMH 48.66
- MTrend 44.43
- M1 42.66
- Close 20.48
- PML 19.27
- M3 0.00
- M2 0.00
- M5 0.00
Active traders can use 19.27 as the pivot, whereby they maintain a long position above that level and a flat or short position below it.
Summary
The power of technical analysis is in its ability to reduce multi-dimensional markets into a filtered two-dimensional space of price and time. Our methodology applies a consistent framework that identifies key measures of trend, distinct levels of support and resistance, and identification of potential trading ranges. Our methodology can be applied to any security or index, across markets, for which we can attain a reliable price history. We look forward to bringing you our unique brand of technical analysis and insight into many different markets. If you are a professional market participant and are open to discovering more, please connect with us. We are not asking for a subscription; we are asking you to listen.