Tag Archives: Apple

Quick Take: The Great “Tesla” Hysteria Of 2020

“Let us see how high we can fly before the sun melts the wax in our wings.” – E. O. Wilson

Since January 1, 2020, Tesla’s (TSLA) stock price has risen by $462 or 110%. TSLA’s market cap now exceeds every automaker except for Toyota. In fact, it exceeds not only the combined value of the “big three” automakers GM, Ford, and Chrysler/Fiat, but also companies like Charles Schwab, Target, Deere, Eli Lily, and Marriot to name a few large companies.

Seem crazy? Not as crazy as what comes next. Crazy are the expectations of Catherine Wood of ARK Invest. This well-known “disruptive innovation” based investor put out the following chart showing an expected price of $7,000 in 2024 with a $15,000 upside target.

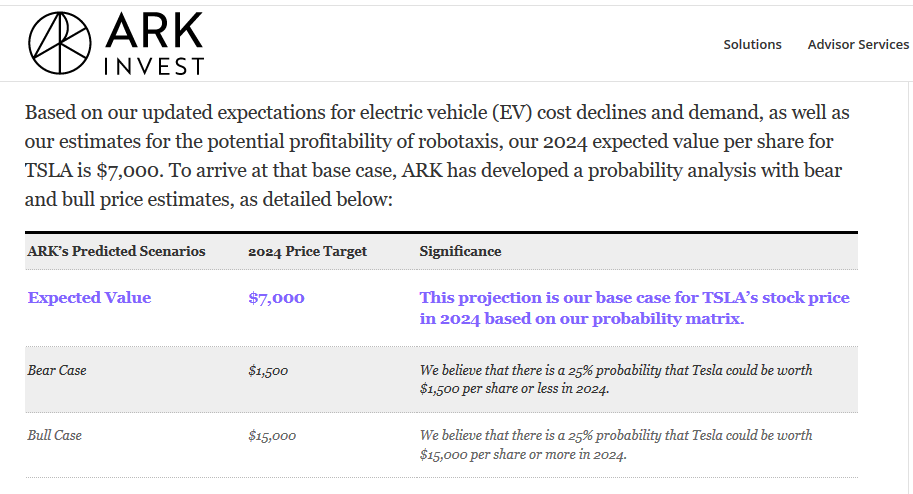
Siren songs such as the one shown above encourage investors to chase the stock higher with reckless abandon, and maybe that is ARK’s intent. Given their large holding of TSLA, it certainly makes more sense than their price targets. Instead of taking her recommendations with blind faith, here are some statistics to illustrate what is required for TSLA to reach such lofty goals.

To start, let’s compare TSLA to their peer group, the auto industry. The chart below shows that TSLA has the second largest market cap in the auto industry, only behind Toyota. Despite the market cap, its sales are the lowest in the industry and by a lot. According to figures published on their website, TSLA sold 367,500 cars in 2019. General Motors sold 2.9 million and Ford sold 2.4 million.

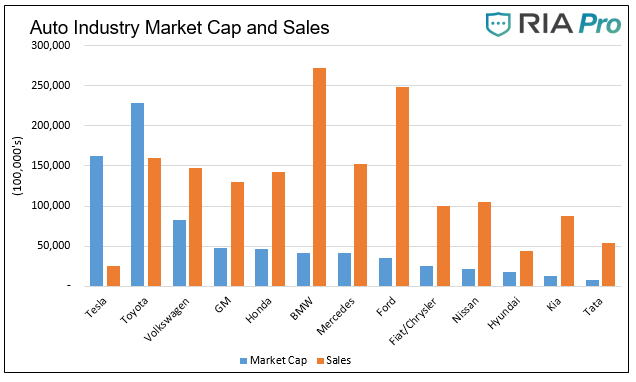
Clearly investors are betting on the future, so let’s put ARK’s forecast into context.  

If the TSLA share price were to rise to their baseline forecast of 7,000, the market cap would increase to $1.26 trillion. Currently, the auto industry, as shown above, and including TSLA, aggregates to $772 billion. At the upside scenario of 15,000, the market cap of TSLA ($2.7 trillion) would be almost four times the current market cap of the entire auto industry.  More stunning, it would be greater than the combined value of Apple and Microsoft.

Even if we make the ridiculous assumption that TSLA will be the world’s only automaker, a price of 15,000 still implies a valuation that is three to four times the current industry average based on price to sales and price to earnings. At 7,000, its valuation would be 1.6 times the industry average. Again, and we stress, that is if TSLA is the world’s only automaker.

Summary

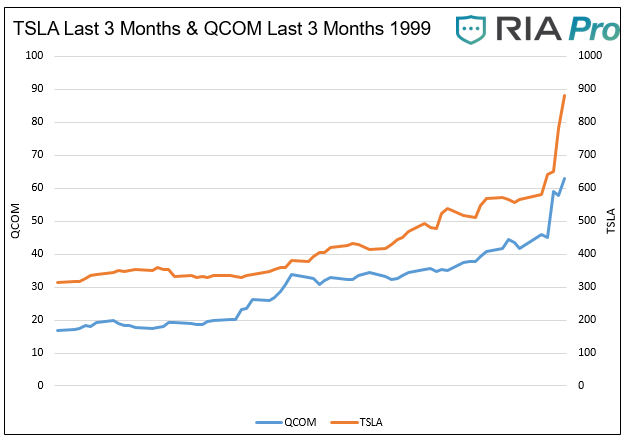
Tesla is one of a few poster children for the latest surge in the current bull market. That said, it’s worth remembering some examples from the past. For instance, Qualcomm (QCOM) was a poster child for the tech boom in the late 1990s. Below is a chart comparing the final surge in QCOM (Q4 1999) to the last three months of trading for TSLA.

In the last quarter of 1999, QCOM’s price rose by 277%. TSLA is only up 181% in the last three months and may catch up to QCOM’s meteoric rise. However, if history is any guide, QCOM likely offers what a textbook example of a blow-off top is. By 2003 QCOM lost 90% of its value and would not recapture the 1999 highs for 15 years. 

Tesla may be the next great automaker and, in doing so, own a sizeable portion of market share. However, to have estimates as high as those proposed by ARK, they must be the only automaker and assume fantastic growth in the number of cars bought worldwide. Given their technology is replicable and given the enormous incentives for competitors, we not only find ARK’s wild forecast exceedingly optimistic, but we believe it is already trading near a best-case scenario level.

One final factor that ARK Invest also seems to have neglected is the risk of an economic downturn. Although they do highlight a “Bear Case” price target of $1,500, that too seems incoherent. Given that TSLA is still losing money and is also heavily indebted, an economic slowdown would raise the risk of their demise. In such an instance, TSLA would probably become the property of one of the major car companies for less than $50 per share.

TSLA’s stock may run higher. Its price is now a function of all the key speculative ingredients – momentum, greed, FOMO, and of course, short covering. The sky always seems to be the limit in the short run, but as Icarus found out, be careful aiming for the sun.

**As we published the article Tesla was up 20% on the day. The one day jump raised their market cap by an amount greater than the respective market caps of KIA, Hyundai, Nissan, and Fiat/Chrysler!!

Looking Beyond Apple and Microsoft

As the 1970s came to a close, six of the world’s ten largest companies were in the oil exploration, drilling, and services business. Just a few years earlier, on April 1, 1976, Steven Jobs and Steven Wozniak, two college dropouts working out of a garage, formed Apple Computers, Inc. In April 1975, Bill Gates and Paul Allen formed a company called Micro-Soft.

Four decades later, these two technology startups are the world’s largest companies, far surpassing the largest oil companies of the 1970s. In fact, the combined market capitalization of Microsoft and Apple is larger than the aggregate market cap of the domestic oil industry. Even more astounding, the combined market cap of Microsoft and Apple just surpassed the total market cap of the entire German stock market.

The table below shows the rotation of the world’s largest publically traded companies over the last fifty years. Of the companies shown below only five have been in the top ten for more than one decade.

Throughout history, most of the world’s largest companies are routinely supplanted by new and different companies from decade to decade. Furthermore, different industries tend to dominate each decade and then fade into the next decade as new industries dominate. For instance, in the 1970’s big oil accounted for six of the top ten largest companies. In the 1980’s, Japanese companies held eight of the top ten spots. In the 1990s it was telecom, the 2000s were controlled by banks and commodities, and this past decade was dominated by technology and social media companies.  

Throughout history, most of the world’s largest companies are routinely supplanted by new and different companies from decade to decade. Furthermore, different industries tend to dominate each decade and then fade into the next decade as new industries dominate. For instance, in the 1970’s big oil accounted for six of the top ten largest companies. In the 1980’s, Japanese companies held eight of the top ten spots. In the 1990s it was telecom, the 2000s were controlled by banks and commodities, and this past decade was dominated by technology and social media companies.  

While table offers several insights, we believe the most important lesson is that our investment strategies must focus on the future and our dependence on past strategies must be carefully considered. Today, two college dropouts in their parent’s basement fooling around with artificial intelligence, block chain, or robotics may prove to be worth more than Apple, Microsoft, or Amazon in just a few decades. The table also emphasizes the importance of selling high and rotating to that which has “value”.

To emphasize that point, we constructed the following graph. Although simple, it effectively illustrates the theme by comparing one stock looking backward and one stock looking forward as an investment strategy. The backward-looking strategy (blue line) buys the largest company at the end of each decade and holds it through the following decade. The forward-looking strategy (orange line), with the gift of 20/20 foresight, buys the company that will be the largest company at the end of the new decade and holds it for that decade.  For example, on January 1, 2010, the forward-looking strategy bought Microsoft and held it until December 31, 2019, while the backward-looking strategy bought Exxon and held it over the same period.

Due to the split-up of AT&T and poor price data, we used GM data which had the second largest market capitalization in 1969. For similar reasons, we also replaced Nippon Telephone and Telegraph (NTT) with The Bank of Tokyo. The graph is based on share price returns and is not inclusive of dividends.

The forward strategy beat the S&P 500 by over 12% a year, while the backward-looking strategy grossly underperformed with a negative cumulative annualized price return over the last 50 years. As startling as the differences are, they fail to provide proper context for the value of 50 years of compounding at the annualized rates of return as shown. If all three portfolios started with $100,000, the backward-looking portfolio would be worth $59,000 today, the S&P 500 worth $3,500,000 today, and the forward-looking portfolio would be worth $791,000,000 today.

Summary

Although no one knows what the top ten list will look like on December 31, 2029, we do know that the next ten years will not be like the last ten. The 2000’s brought two recessions and for the first time in recorded history, the 2010s brought NO recessions. Investors need to be opportunistic, flexible, creative and forward-looking in choosing investments. Investing in today’s winners is not likely to yield us the results of yesterday. It is difficult to fathom as Apple and Microsoft drive the entire market higher, but history warns that their breath-taking returns of the last decade should not be expected in the 2020’s. In fact, history and prudence argue one should sell high.