


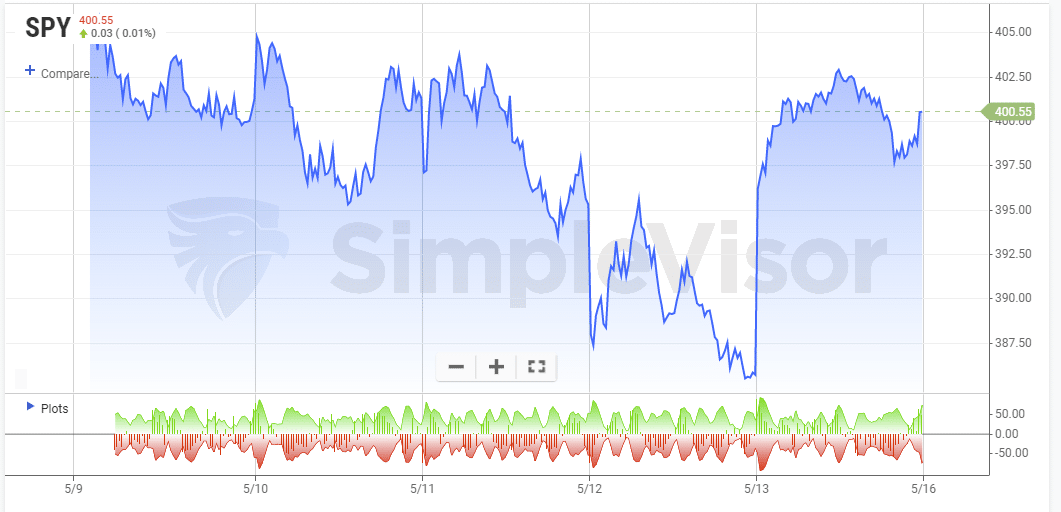
The S&P 500 capped off last week on a positive note with a rally to close above 4000. The index managed to hold on to its gains Friday after failing to do so several times during the volatile week. Friday could be the beginning of a short-term relief rally considering the poor investor sentiment and deeply oversold conditions.
If so, the index may face resistance near 4150, providing a decent opportunity to sell into the rally and reduce risk. Given the low levels of liquidity lately, we could be in store for another volatile week.

What To Watch Today
Economy
- 8:30 a.m. ET: Empire Manufacturing, May (15.0 expected, 24.6 during prior month)
- 4:00 p.m. ET: Net Long-Term TIC Outflows, March ($141.7 billion during prior month)
- 4:00 p.m. ET: Total Net TIC Outflows, March (162.6 billion during prior month)
Earnings
Before Market Open:
- • Warby Parker (WRBY) to report adjusted earnings of $0.00 on revenue of $154.5 million
- • Weber (WEBR) to report adjusted earnings of $0.19 on revenue of $660.25 million
After Market Close
- Take-Two Interactive (TTWO) to report adjusted earnings of $1.04 on revenue of $870.05 million
Market Trading Update
Are we near the bottom? That is the question we will explore this week. However, the market is as oversold, deviated, and negatively biased from a technical viewpoint since both the 2018 and 2020 lows.
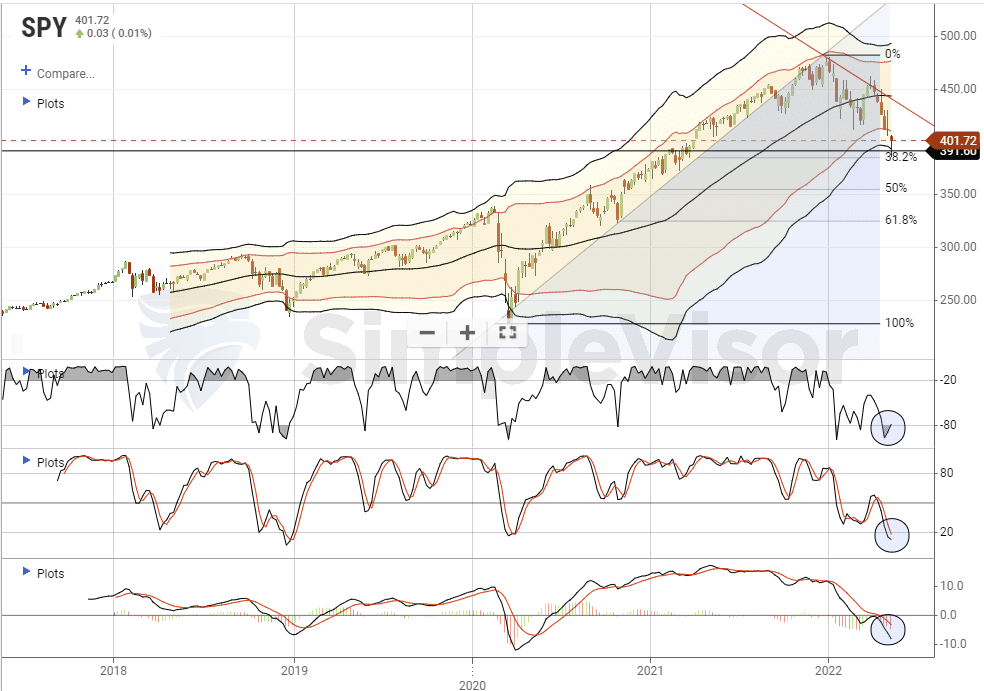
With the market pushing 3-standard deviations below the 1-year moving average, and all technical indicators testing weekly lows, such is historically consistent with reflexive rallies. While such was what we said last week, the selling pressure continued this week as investors panicked over the latest inflation print.
With inflation, earnings, and the Fed behind us temporarily, maybe the “lack of news” will be enough to allow for the bulls to reenter the market.
Technically Speaking
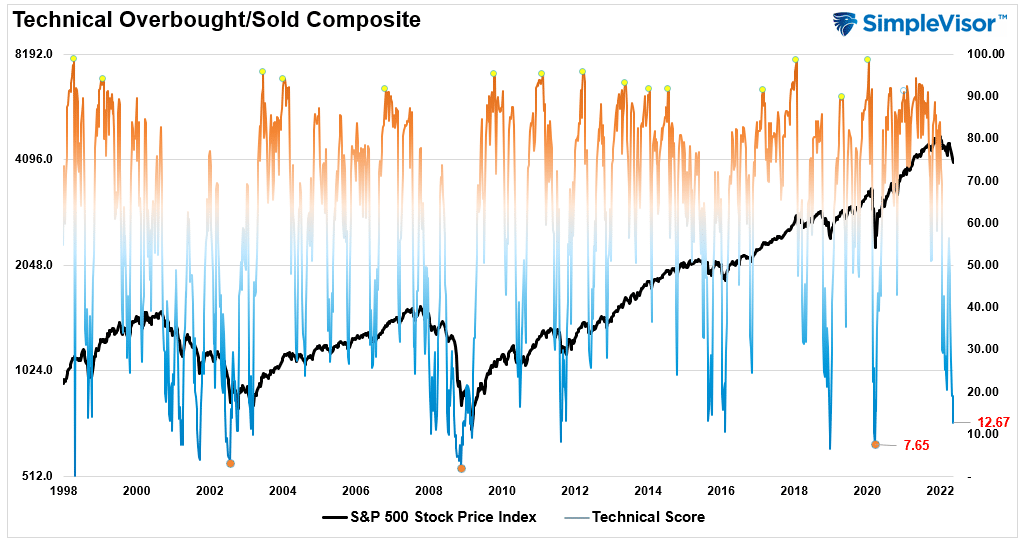
Our composite technical gauge which is a weekly measure of Williams %R, Stochastics, RSI, and several other measures combined has now reached its lowest level since March 2020. While technical measures can stay extremely oversold for quite some time, it is rare for all technical measures to be at these levels. Historical, such extremes don’t last long.
If you are a SimpleVisor.com subscriber (try FREE for 30-days) you can find a live version of all of our sentiment gauges here.
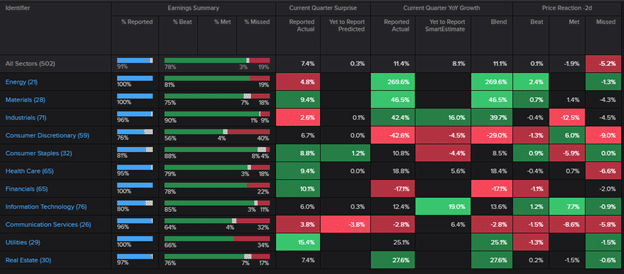
Earnings Season in the Rearview
Earnings season is almost behind us, with 91% of companies in the S&P 500 having reported results. The table below, via Refinitiv, shows that 78% of reported companies beat earnings estimates. Consumer discretionary had the worst beat rate (56%) while industrials had the highest beat rate (90%). As measured by the return from 1 day before to 1 day after reporting, on average, companies were punished for missing earnings estimates but were not rewarded for beating them.
Is a Freight Recession Looming?
The Cass Transportation Index Report for April points to a possible weakening in the freight cycle going forward. We have included a few of the key points below:
- “While truckload rates have had an extraordinary cycle, the key leading indicators have fallen sharply over the past few months, which we expect to limit further upside in the Cass Truckload Linehaul Index and change its trajectory over the course of the year.”
- “Normal contract timing would suggest there’s room for this index to continue to rise for a little longer after the peak in spot rates, but the clock is ticking.”
- “The combination of inflation, Fed monetary tightening, war in Europe, and substitution back to services from goods are all leading to a downshift in the freight cycle. And consistent with the fundamental reason for cyclicality in the freight sector, the capacity response is occurring just as the surge in demand is ebbing.”
The last bullet refers to the chart below. Shipping capacity tends to lag freight rates as new entrants come when times are good and exit when rates fade. If we enter a freight recession, freight rates will decrease until either enough capacity leaves the market or freight demand picks up meaningfully enough. On the bright side, deflation in freight rates would ease inflationary pressures on consumers and shippers alike.

The Week Ahead
Investors face another light week of economic data this week with several appearances by Fed speakers. Retail sales data for April will be released tomorrow. Expectations are for an increase of 0.8% MoM after gaining 0.5% MoM in March. The industrial production index will also be released tomorrow. On Wednesday, we will be watching April’s housing starts and permits data for indications of whether homebuilders are shifting course amid rising mortgage rates and record prices. Existing home sales for April will be released on Thursday. Expectations are for another decrease from 5.77M in March to 5.62M in April as rising mortgage rates crimp demand. We may face another volatile period in the markets this week unless we see an improvement in liquidity.
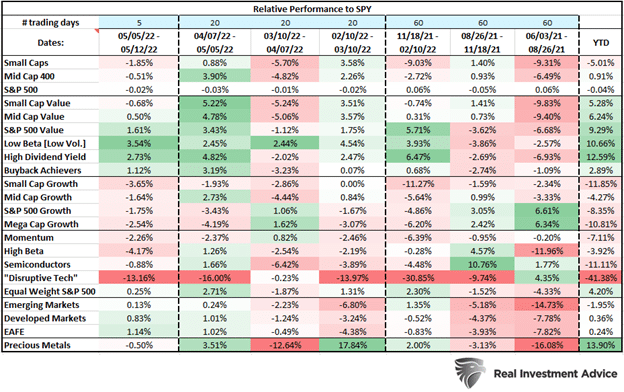
Factor Performance Update
Through Thursday’s close the S&P 500 has given up 17% YTD as investors sort out rising rates, inflation, and geopolitical uncertainty. The table below shows how relative factor performance trends have evolved over the last 245 trading days. Value-oriented factors are still outperforming YTD, with high dividend yield in the lead. The low volatility factor is picking up steam as volatile trading increases, however. It has gained 8.4% on SPY since March 10th versus 5.5% for high dividend yield. Aside from the ARKK “disruptive tech” basket, the areas underperforming most YTD are small-cap growth, semiconductors, and mega-cap growth.
Consumer Sentiment Reaches its Lowest Point Since 2011
The University of Michigan Consumer Sentiment Index reached its lowest point since 2011 in the preliminary results for May. The reading of 59.1 came in well below estimates of 63.7 and last month’s 65.2. It’s no secret that skyrocketing food and energy prices are negatively impacting the consumer. The correction in asset prices YTD has further worked to reduce the “wealth effect” felt by consumers, which also is likely dragging on sentiment. We are creeping on levels of sentiment that existed during the GFC. Notably, the message from this survey is quite contradictory to the Fed’s messaging on the strength of the economy.

Please subscribe to the daily commentary to receive these updates every morning before the opening bell.
If you found this blog useful, please send it to someone else, share it on social media, or contact us to set up a meeting.
Also Read


