Stocks Struggle As The Bull Market In Virus Cases Rises 07-17-20


In this issue of, “Stocks Struggle As The Bull Market In Virus Cases Rises”
- Technically Trapped
- Economic Expectations Slow
- Who Ya Gonna Believe
- The Risk Of Confirmation Bias
- MacroView: Value Is Dead. Long Live Value.
- Sector & Market Analysis
- 401k Plan Manager
Follow Us On: Twitter, Facebook, Linked-In, Sound Cloud, Seeking Alpha
We Are Hiring…

Catch Up On What You Missed Last Week

Technically Trapped
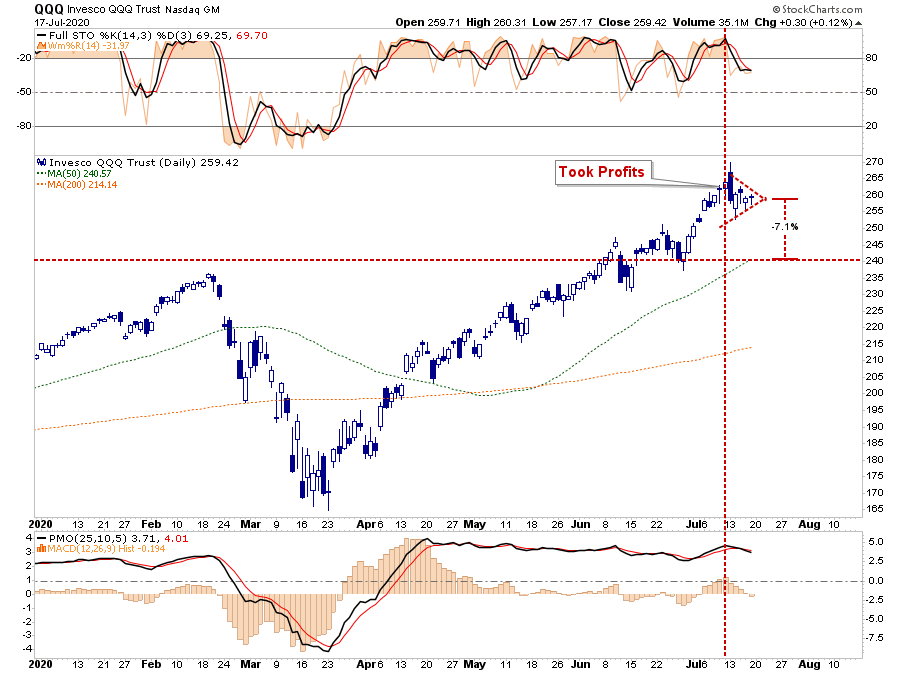
Last week, we discussed why we were taking profits in positions that had gotten egregiously overbought for the second time this year. To wit:
“For the second time in a single year, we have begun the profit-taking process within our most profitable names. Apple, Microsoft, Netflix, Amazon, Costco, PG, and in Communications and Technology ETFs.”
That turned out to be timely as technology shares struggled to maintain their altitude. The tight “wedge” pattern that has developed suggests a downside break could quickly lead to a test of the 50-dma. Such would equate to about a 7% decline.
Furthermore, the S&P 500 continues to remain “technically trapped” between the June highs and the recent consolidation lows. With the market overbought on a short-term basis, the upside has remained limited. However, there is substantial support between the current uptrend line and the 50- and 200-dma’s, limiting downside risk at this juncture.
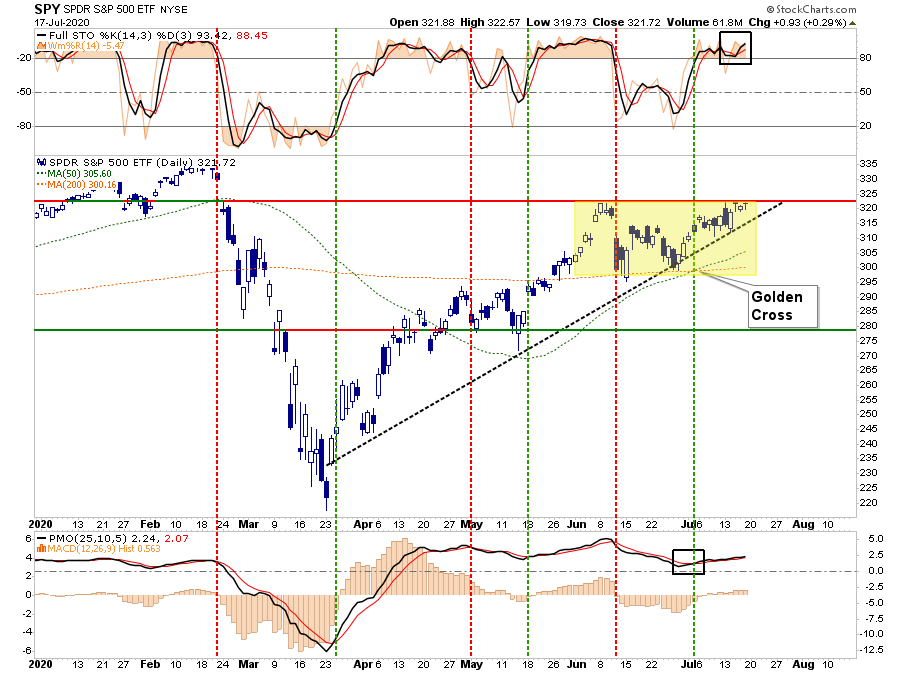
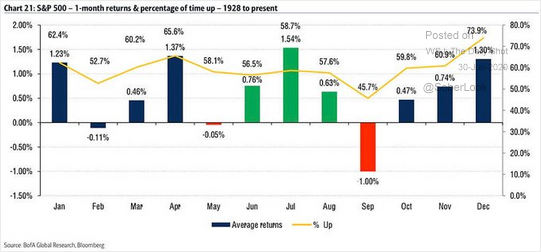
We will update our risk/reward ranges below. However, as noted previously, July held to its historical performance tendencies. However, the risk comes in August and September, where outcomes tend to be more volatile.
“In the short-term, the bulls remain in charge currently, and as such, we must be mindful of those trends. Also, the month of July tends to be one of the better performing months of the year.”
The Bull Market In Virus Cases
August and September’s seasonal tendencies will also be impacted by the ongoing “bull market” in “virus” cases. Our colleague Jeffrey Marcus noted a critical point for our RIAPro subscribers (30-day Risk-Free Trial)
“The question for clients is this: ‘Is the pattern of the past 5-days a broadening of the rally since
March 23rd lows, or are investors moving too far out on the risk curve?’ Experian’s 4 possible Covid-19 economic scenarios may provide an answer. The worst scenario was a W-shaped.”
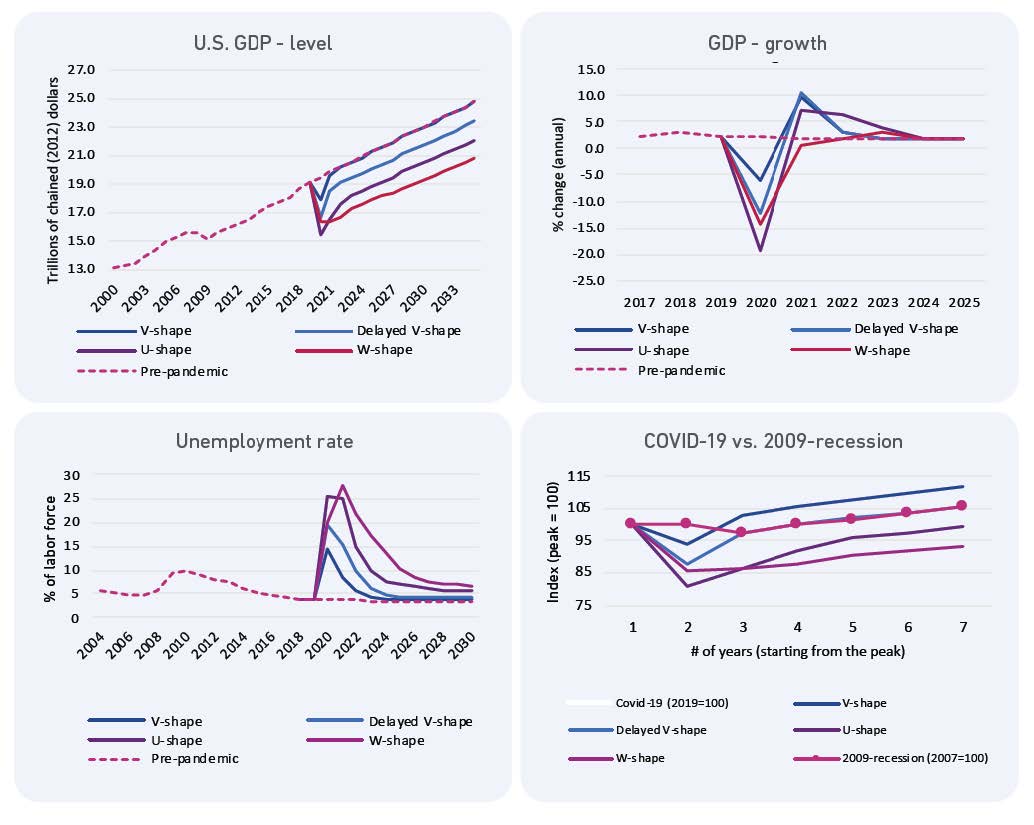
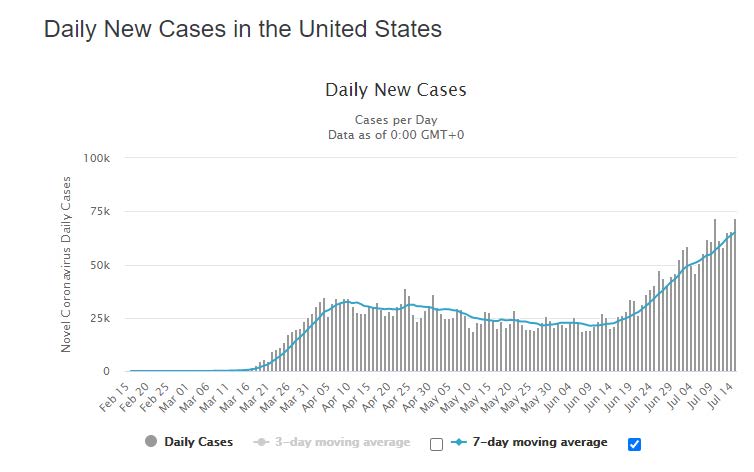
“There were 72,045 new cases of Covid-19 in the U.S. The second worst daily number to date (chart below). Although the market seems to have ignored the worsening numbers so far, the V-shaped scenario seems a long-shot at this juncture.
Can the U.S economy somehow rebound with ever-increasing cases of Covid-19? The market action over the past 5-days seems to depend on the belief of recovery, and the hope cheap valuations will buffer against tough financial conditions. Clients should own stocks of companies that can prosper during a pandemic ridden economy. Such is as opposed to just ‘hoping’ stocks with rocky roads ahead will continue to rally.”
It is unlikely that a “bull market” in the number of new virus cases can co-exist with a bull market in stocks for long.

Economic Expectations Slow
The most significant risk to the current bull market in stocks comes in two specific headwinds – Congress and the Fed. At the end of the month, the additional $600/week in jobless benefits will expire. Such is no small matter, as noted by CNBC:
- 25.6 million individuals will lose the additional benefit on July 25th.
- $15.4 billion in additional weekly economic benefit nationwide up from states spending less than $1 billion pre-pandemic.
These payments have been a big part of the boost to retail sales over the last couple of months. Retail sales comprise roughly 40% of Personal Consumption Expenditures, which equates to about 70% of the GDP calculation. In other words, it is not a trivial matter.
While it seems like a “no-brainer,” that Congress should extend the benefits, there are some issues which could get in the way:
- Political football (R) – Republicans intend to end the enhancement to jobless benefits as they view it as a disincentive for people to return to work.
- Political football (D) – Democrats realize an election is soon. If the economy is doing well due to the benefits, the odds increase for a re-election of the incumbent.
- Debt Ceiling Debate – With the debt-ceiling, the debate on the next “continuing resolution” will become problematic. For conservative Republicans up for re-election, unbridled spending is going to become problematic.
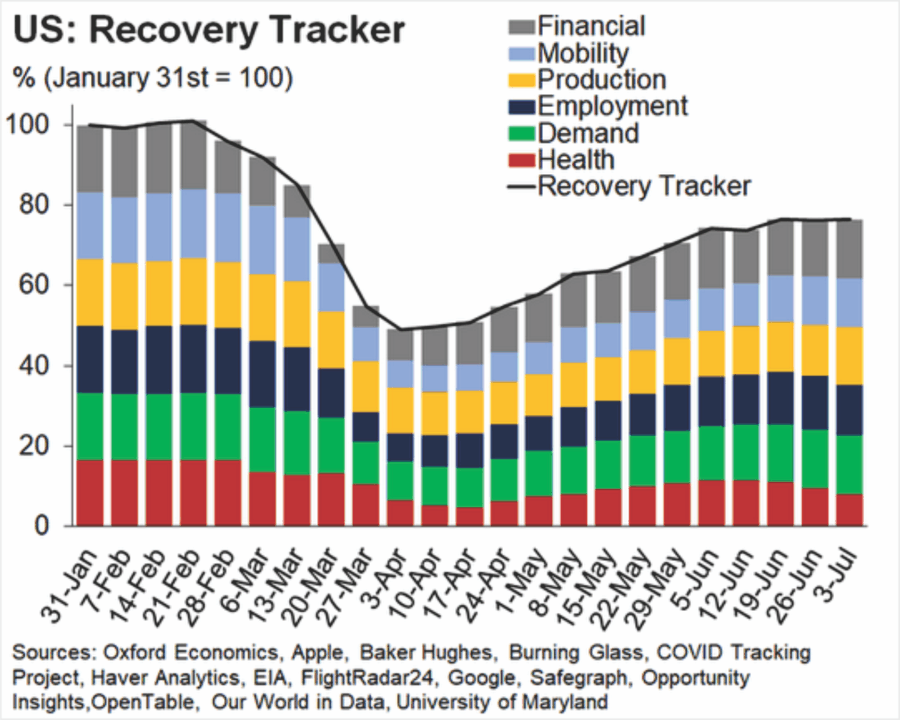
Even with the current support in place, the initial rebound of economic activity off the lows has begun to slow and stabilize at a level lower than pre-pandemic.
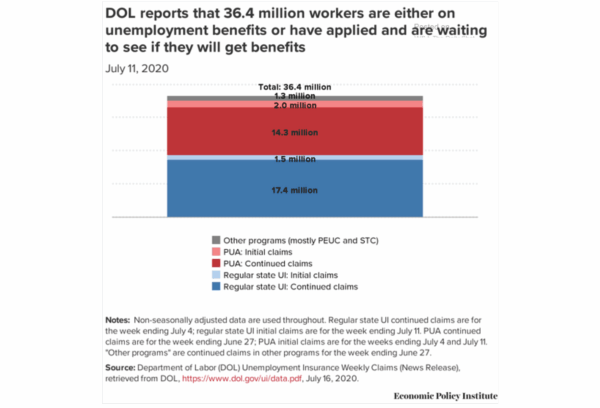
Such should NOT be a surprise with 36.4 million workers either on, or waiting for, unemployment benefits.
Federal Contraction
The other headwind for the market comes from the very thing that boosted asset prices to start with – the Fed’s balance sheet expansion. Over the last couple of months, the slowing rate of advance for the market has coincided with a reduction in the Fed’s “emergency measures.”
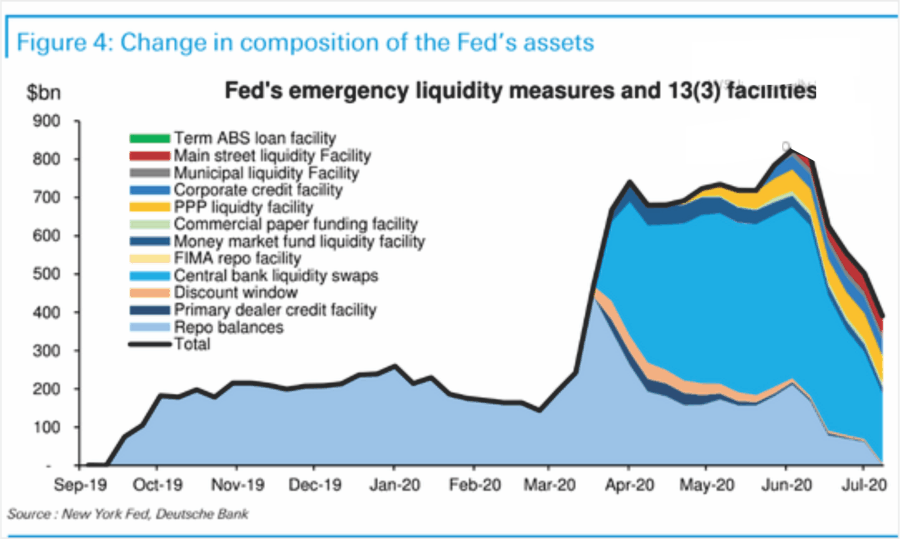
As noted previously, the limit to the Fed’s QE program is the Government’s Treasury issuance. An improving economy increased tax revenues, and improved outlooks began limiting the Fed’s ability to engage in more extensive monetary interventions.
Jerome Powell noted the Fed has to be careful not to “run through the corporate bond market.” The Fed is aware if they absorb too much of the Treasury or Corporate credit markets, they will distort pricing and create a negative incentive to lend. Such impairment would run counter to the very outcome they are trying to achieve.
As noted last week, there is already a “diminishing rate of return” on QE programs.
“Instead, as each year passed, more monetary policy was required just to sustain economic growth. Whenever the Fed tightened policy, economic growth weakened, and financial markets declined. The table shows it takes increasingly larger amounts of QE to create an equivalent increase in asset prices.”
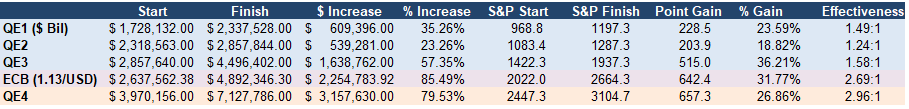
“As with everything, there is a “diminishing rate of return” on QE over time. Since QE requires more debt to be issued, the consequence is slower economic growth over time.“

Who Ya Gonna Believe
My friend Doug Kass also made a salient comment regarding the economic risk in front of us.
“Some fundamental investors (like myself) are looking closely at the flattening high-frequency economic data, and the rising chorus of company executives flagging economic and market uncertainties over the last few days.
Specifically, the management of Citigroup, Wells Fargo, JPMorgan, and Goldman Sachs all echoed the same mantra. They are surprised by how optimistic the economic and business forecasts have grown, and the enthusiastic embrace of the capital markets.
These wise managers of businesses have their feet on the ground and virtually dismiss a “V” type recovery that many have endorsed. To paraphrase, they all see many possible outcomes (many of which are adverse and not market-friendly).
Look to the ground, not to the sky – believe them (bank CEOs) and not the markets’ seductive lying eyes.”
As noted above, the data does confirm those views. More importantly, there is another issue that derives from a weaker economic outlook.
Stocks Are About To Get A Lot More Expensive
As Eric Parnell recently wrote:
“The current forward price-to-earnings ratio on the S&P 500 based on 2020 earnings is 35.6 times earnings. The historical average forward price-to-earnings ratio on the S&P 500 dating back a century and a half is 15.6 times. Thus, today’s valuation is more than +125% greater than the historical average.
The forward P/E ratio on the S&P 500 has been higher than 35.6 only two other times in history. Both are recent episodes. The first was from 2001-Q1 to 2002-Q2 during the bursting of the technology bubble. The second was from 2008-Q2 to 2009-Q1 during the Great Financial Crisis.
During both of these past episodes, the P/E ratio moved in excess of 35 times forward earnings, because while the S&P 500 price was falling (the “P” in the P/E ratio), the earnings were falling much faster (the “E” in the P/E ratio). In contrast, the P/E ratio has moved in excess of 35 times forward earnings today because the S&P 500 price is rising even though earnings are falling considerably.”
More To Go
That is correct, and the issue currently is that expectations for earnings are still far too high through the end of 2020, and into 2021. As I discussed previously:
“Currently, estimates have only been reduced by 34% of their previous peak. Such comes at a time where economic growth is weaker, job loss is higher, and consumption will drop lower than any previous point except during the ‘Great Depression.'”
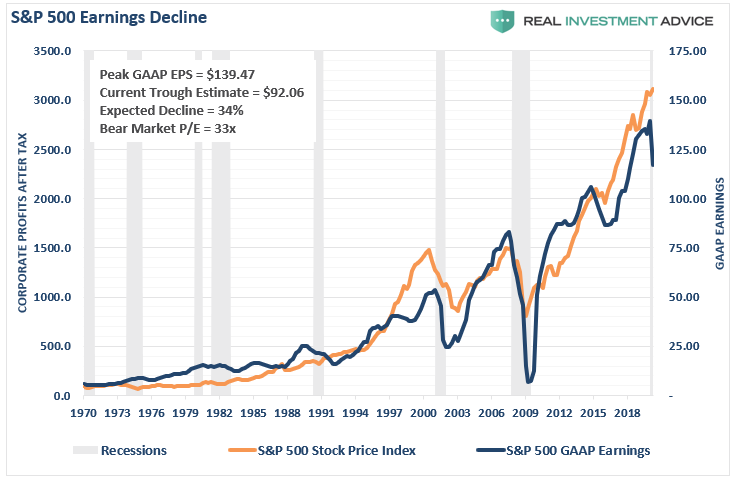
“We are watching the chart closely as we expect that earnings will eventually drop closer to $60/share to align with historical norms. As such, stock prices will have to correct to align with those earnings.”
(Note: Since that writing, trough estimates have declined to $91.79. The current bear market P/E is currently 35.13x.)
However, even those estimates are likely optimistic, given the data that is coming in. We would not be surprised to see a negative sign in front Q2-GAAP earnings before it is over.
At the moment, such “fundamental relics” like earnings may not seem to matter. Such has always seemed to be the case, just before they begin to matter, and matter a lot.

Updating Risk/Reward Ranges
“The [advice to reduce risk] played out well this past week, given daily swings in the market. While the market was up for the week, it has not reclaimed the June highs. As such, the consolidation continues with risk/reward remaining primarily ‘neutral’ with a ‘negative’ bias.”
That advice remains this week. After several failed tests of the June highs this week, we derisked our portfolios and added to our hedges. Even with those adjustments, our portfolios continued to perform as the rotation to “risk-off” sectors kept markets stable. The reason for the derisking is the negative tilt to the risk/reward ranges currently.
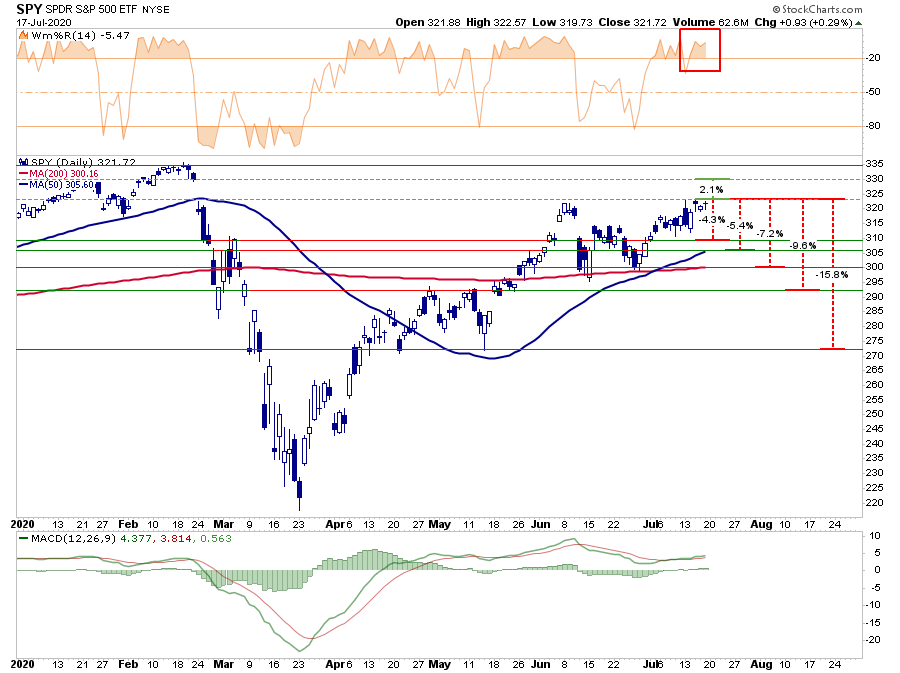
- -4.3% to initial March reflex rally top vs. +2.1% all-time highs.* (Negative)
- -5.4% to 50-dma support vs. +2.1% to all-time highs.* (Negative)
- -7.2% to 200-dma support vs. +2.1% to all-time highs.* (Negative)
- -9.6% to -15.8% to previous consolidation vs. +2.1% to all-time highs.* (Negative)
(* If the market breaks out to all-time this analysis is no longer valid and risk/reward ranges will recalibrate for the breakout.)
The Risk Of Confirmation Bias
I have written many times previously about the dangers of getting trapped into a “bullish” or “bearish” mindset. As an investor or portfolio manager, your job is to view the markets for opportunities to increase capital and protect it from loss.
As Doug noted this week:
“There are many who see the markets as “Them versus Us.” The bulls vs. the bears, the fundamentalists vs. the technicians, and so on. I view the investment marketplace as me vs. the markets, and not me vs. opposing views.“
The most significant risk to any investor long-term is getting trapped in “confirmation bias.” Such is the psychological impediment of seeking out information that confirms your existing predisposition. However, such inherently leads to adverse outcomes as investors become blind to the risk that inherently upends their future outcome.
In the end, it does not matter IF you are “bullish” or “bearish.” The reality is that the “broken clock” syndrome owns both “bulls” and “bears” during the full-market cycle. However, grossly important in achieving long-term investment success is not necessarily being “right” during the first half of the cycle, but by not being “wrong” during the second half.

The MacroView
If you need help or have questions, we are always glad to help. Just email me.
See You Next Week
By Lance Roberts, CIO
Market & Sector Analysis
Data Analysis Of The Market & Sectors For Traders
MISSING THE REST OF THE NEWSLETTER?
This is what our RIAPRO.NET subscribers are reading right now! Risk-Free For 30-Day Trial.
- Sector & Market Analysis
- Technical Gauge
- Sector Rotation Analysis
- Portfolio Positioning
- Sector & Market Recommendations
- Client Portfolio Updates
- Live 401k Plan Manager
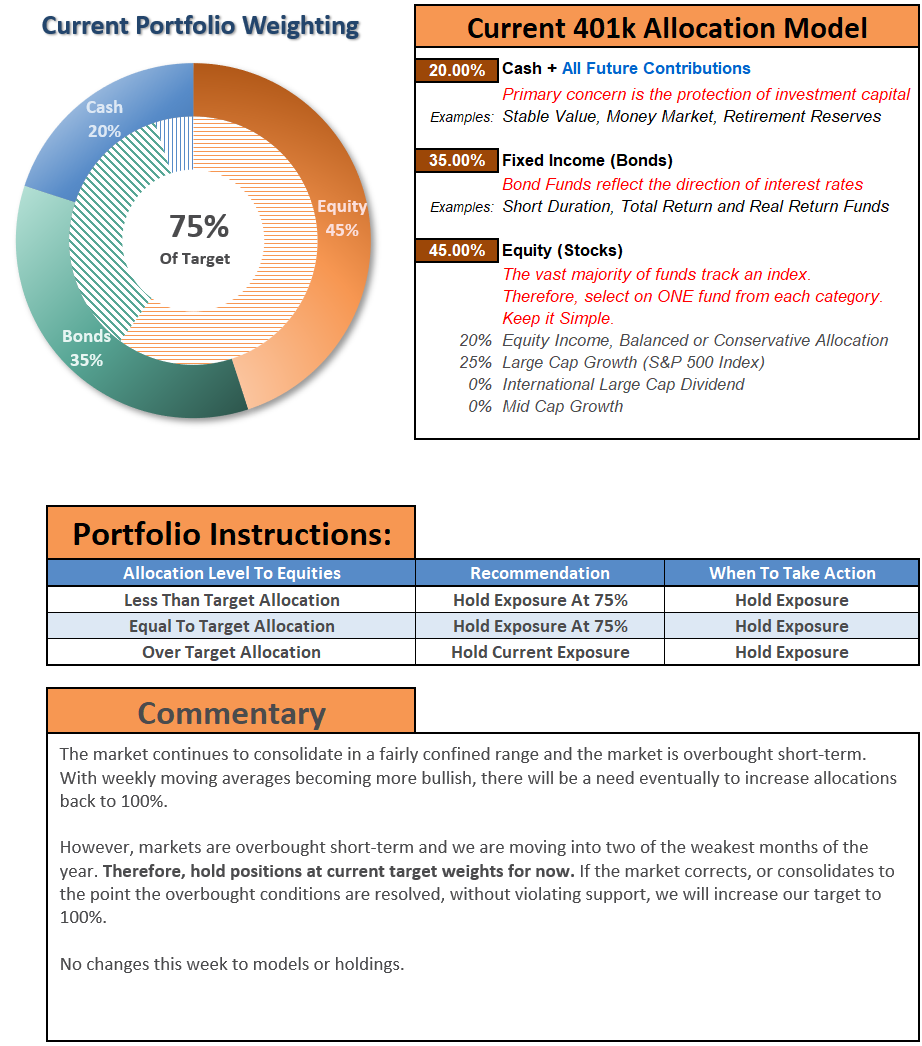
THE REAL 401k PLAN MANAGER
A Conservative Strategy For Long-Term Investors
If you need help after reading the alert; do not hesitate to contact me
Model performance is a two-asset model of stocks and bonds relative to the weighting changes made each week in the newsletter. Such is strictly for informational and educational purposes only and should not be relied on for any reason. Past performance is not a guarantee of future results. Use at your own risk and peril.

401k Plan Manager Live Model
As an RIA PRO subscriber (You get your first 30-days free) you have access to our live 401k plan manager.
Compare your current 401k allocation, to our recommendation for your company-specific plan as well as our on 401k model allocation.
You can also track performance, estimate future values based on your savings and expected returns, and dig down into your sector and market allocations.
If you would like to offer our service to your employees at a deeply discounted corporate rate, please contact me.

q


