


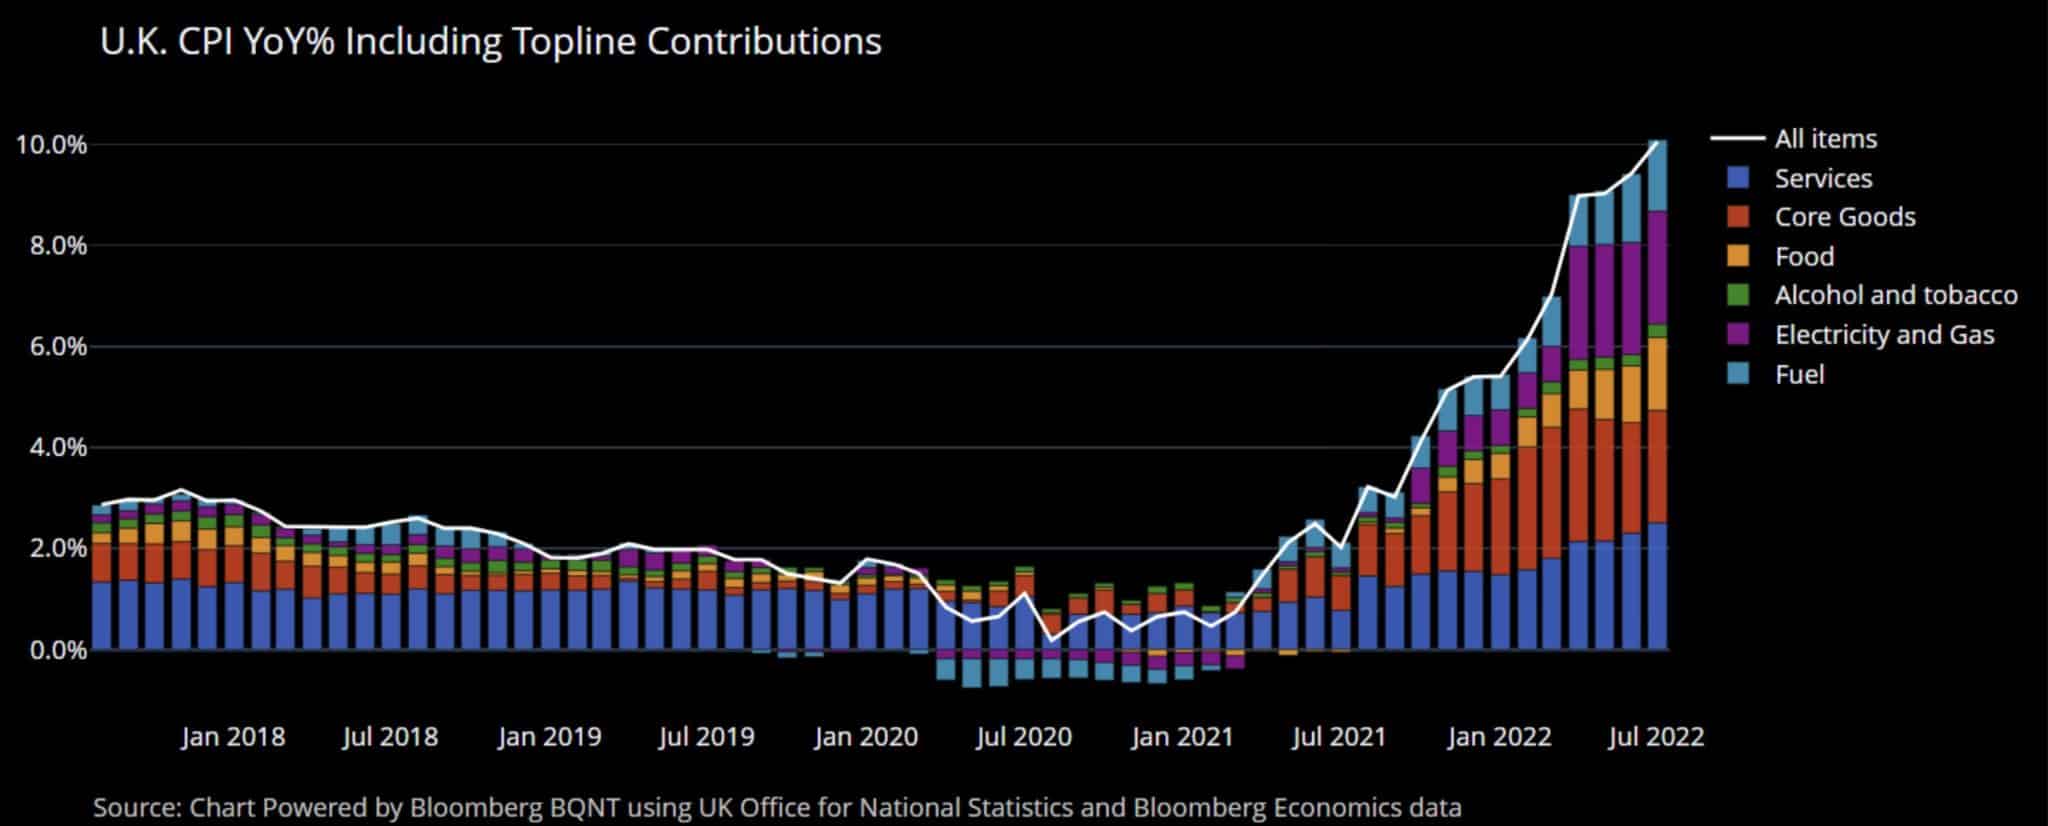
Stock markets have been on fire since the last round of inflation data which showed inflation was lower than expected. On Wednesday morning, the United Kingdom (UK) may have put water on that fire. UK year-over-year CPI rose 10.1%, above expectations of 9.8%. That was the largest increase in 40 years. Worse, every inflation number in the report, including core CPI, was also higher than expected. The UK has some unique issues driving inflation, such as the weakening pound and repercussions from the Russia/Ukraine conflict. However, given the nature of global trade and the fact that inflation for most developed nations tends to be well correlated, we must be careful to dismiss this unexpected jump in inflation.
While U.S. inflation may have peaked in July, the UK data may warn that high inflation rates may be stickier than markets would like to believe. If CPI is slow to fall, the Fed will have no choice but to continue to hike rates. Such is not what the pivot bulls want to hear.

What To Watch Today
Economy
- Initial jobless claims, the week ended August 13 (265,000 expected, 262,000 prior)
- Continuing claims, the week ended August 6 (1.428 prior)
- Philadelphia Fed Business Outlook Index, August (-4.5 expected, -12.3 prior)
- Existing Home Sales, July (4.85 million expected, 5.12 million prior)
- Existing Home Sales, month-over-month, July (-5.3% expected, -5.4% prior)
- Leading Index, July (-0.5% expected, -0.8% prior)
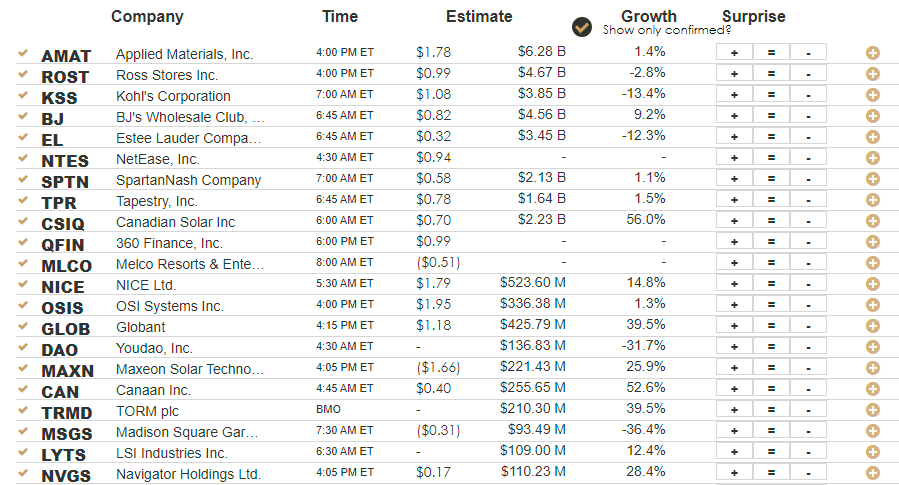
Earnings
Market Trading Update
The Fed’s latest FOMC minutes had a little something for everyone. As Michael Lebowitz commented following the release of UK inflation and the FOMC minutes:
“On one side, there’s a risk they’ll not do enough to bring inflation down before higher prices grow entrenched. However, officials for the first time acknowledged the risks that they’d overdo it.“
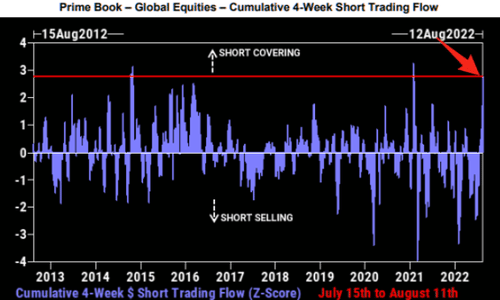
While the statement was perceived as a “Goldilocks” scenario, not too hot or cold, stocks staged a nice comeback from the day’s lows as hopes of a “Fed pivot” grew more emboldened. “Meme stocks” continue to pace the way higher as the short-squeeze over the last several weeks has been one for the record books.
Lastly, while the market is challenging the 200-dma, the 2-standard deviation from the 50-dma is also at levels that historically preceded short-term pullbacks and corrections. With a very elevated Relative Strength Index (RSI), use pullbacks to support at either the 20- or 50-dma to increase equity exposure.

The 50% Retracement “Sure Bet.”
One of the “bullish memes” as of late has been that a 50% retracement of the peak to trough decline has always marked the end of a bear market. As shown below, that is true, except for a couple of important points. First, as shown, there was only one period where the market rallied while the Fed was hiking rates, and the bear market, induced by higher rates, recovered and went on to new highs. However, such was the beginning of a multiple bear market sequence that ended in the 1974 bear market that brought valuations down to 7x earnings.
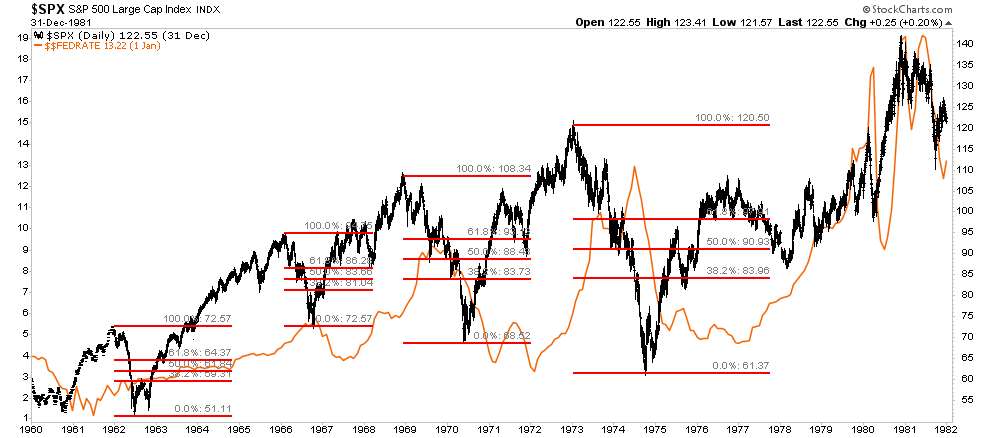
Notably, during this entire period, the Fed was regularly hiking and cutting interest rates to combat a period of steadily rising inflationary pressures. Yes, each 50% retracement rallied to new highs as the Fed cut rates, only to collapse back to lower lows again.
While it is very likely that the current 50% retracement rally could indicate a continued rally for a while longer, if we are “replaying the tape” of the 70s, such would also suggest the “bear” isn’t completely back into hibernation just yet.
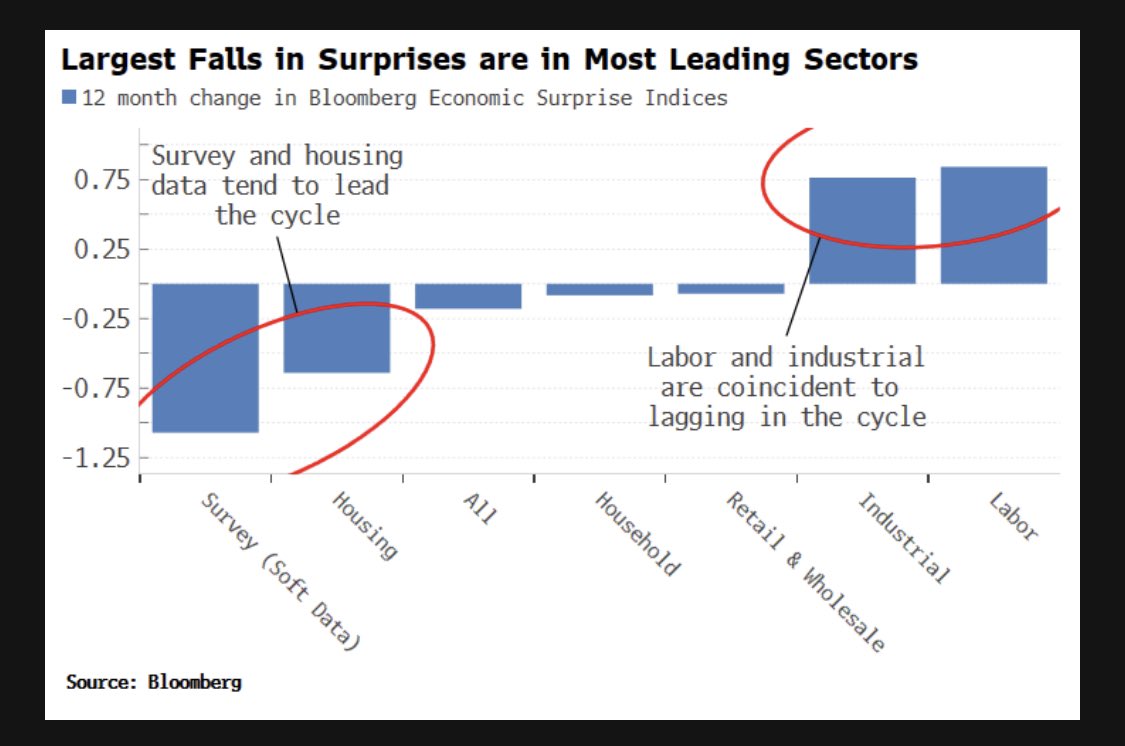
Leading and Lagging Economic Indicators
Tuesday’s commentary led with a review of the unexpected plunge in the New York State Empire Manufacturing Index. Yesterday’s discussed the miserable sentiment amongst new home builders and slowing construction activity. The graph below shows why these lesser followed economic indicators are important. As the graph notes, survey and housing data are leading economic indicators. Most regional surveys point to economic contraction. Housing is likely already in a recession. Conversely, data like industrial production and employment have been relatively strong but tend to lag or coincident indicators. If leading indicators are correct, we should start seeing employment markets deteriorate shortly, which would confirm a recession in the next six to nine months or even sooner.
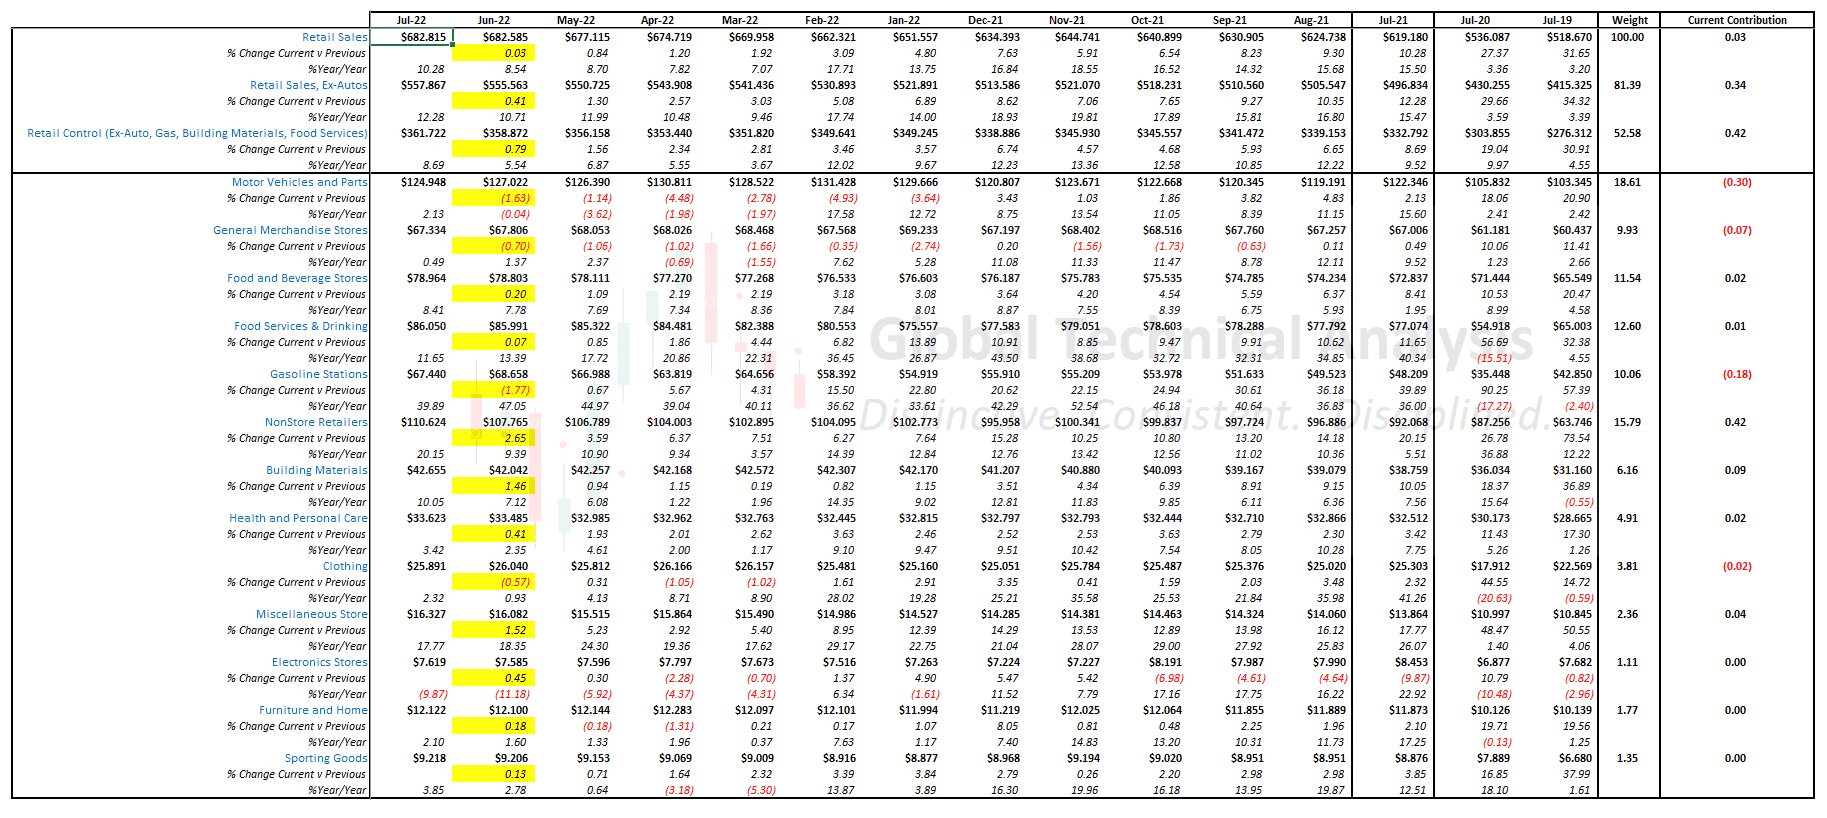
Retail Sales Miss
Retail Sales for July were flat, falling 0.1% below expectations and a full percentage behind June’s number. Excluding volatile gas and vehicle sales, retail sales grew 0.7%, slightly better than expectations. The control group, which directly feeds GDP, rose 0.8%. GDP estimates for the third quarter will likely tick up on the new data. Year-over-year retail sales are now up 10.3%, about 1.8% higher than inflation over the same period. The yield curve steepened on the news as the markets increased the odds for more aggressive rate hikes. Fed Funds futures in mid-2023 priced in another 12 basis points of Fed rate hikes. The March 2023 contract is 3.70%, .25% more than it was right after last week’s CPI report.
The table below, courtesy of Brett Freeze, breaks down the data by contribution.
Rational Investor Theory
Many portfolio management models rest on theories that are not necessarily true. For instance, Modern Portfolio Theory (MPT) assumes the following:
According to Fama’s theory, financial markets are efficient, investors make rational decisions, market participants are sophisticated, informed and act only on available information. Since everyone has the same access to that information, all securities are appropriately priced at any given time. -Investopedia
Let’s focus on the assumption that sophisticated investors make rational decisions. To disprove the assumption, we could show you how Bed Bath and Beyond (BBBY) which is up 315% over the past month despite no pertinent news from the company. However, to better make our point, we share the Tweet and question below. Which button would you press?
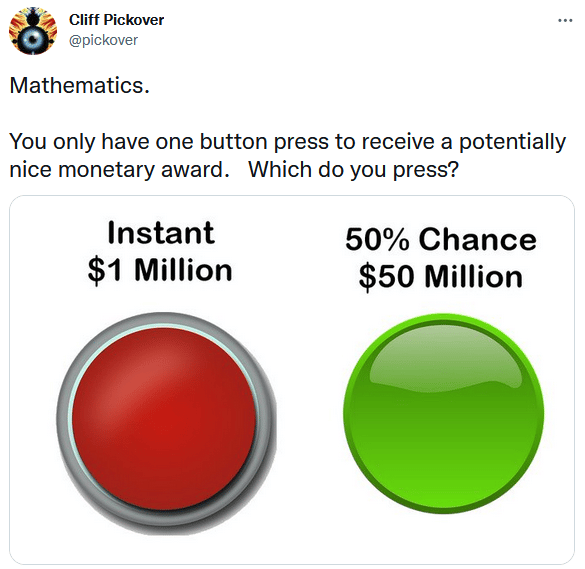
The expected return of the red button is $1mm. The expected return of hitting the green button is $25mm. Despite the math, over 95% of people asked the question consistently chose the red button.
Tweet of the Day

Please subscribe to the daily commentary to receive these updates every morning before the opening bell.
If you found this blog useful, please send it to someone else, share it on social media, or contact us to set up a meeting.
Also Read


