


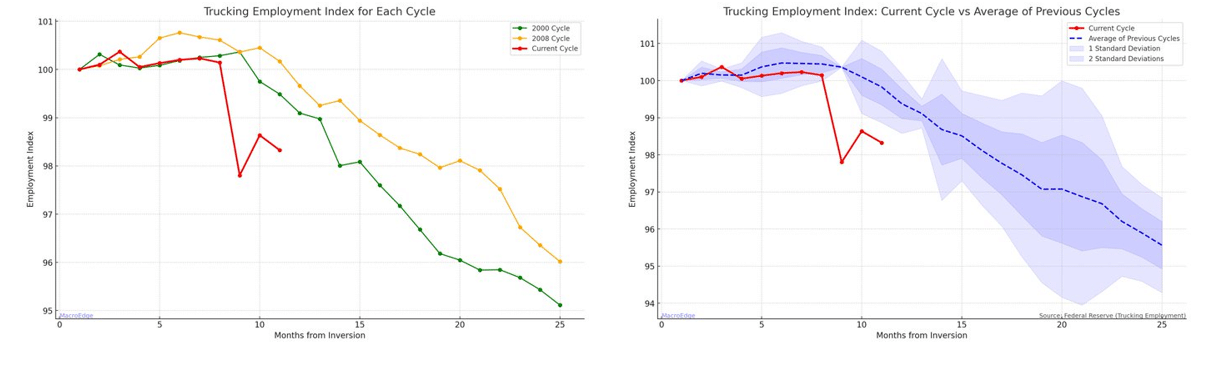
Our most recent article, CFNAI, The Most Important & Overlooked Economic Number, shares an important economic metric that many investors tend to ignore. Further, unlike the more popular economic data points, CFNAI is forward-looking. Speaking of economic statistics that are not well covered is the trucking industry. Trucking services account for nearly 6% of GDP; more importantly, trucks transport about 70% of domestic shipments. Per Statista, trucking contributed $369 billion to GDP, twice as much as air transport and multiples above all other forms of freight transportation services. As such, the health of the trucking industry is directly important for GDP calculations, but more importantly, demand for trucking informs us of the financial health of consumers and corporations. So, with that, let’s explore the health of the trucking industry.
Trucking employment is falling at a faster rate than the recessions of 2000 and 2008. This is not what we should expect in such a strong economy. The recent demise of Citizens Bank provides further evidence of trucking woes. The bank ties its failure to bad trucking loans. Yellow Corporation, founded 99 years ago with a 10% trucking services marketing share, failed earlier this year. Smaller companies are failing as well. Per Yahoo Finance, “rates on most lanes are at or below 2019 levels.” Lastly, as reported by FreightWaves, Convoy, a high-profile trucking brokerage, recently shut down for financial reasons. Other trucking services brokerages are also failing. The bottom line is that the state of trucking does not gibe with the most recent 4.9% GDP growth.
What To Watch Today
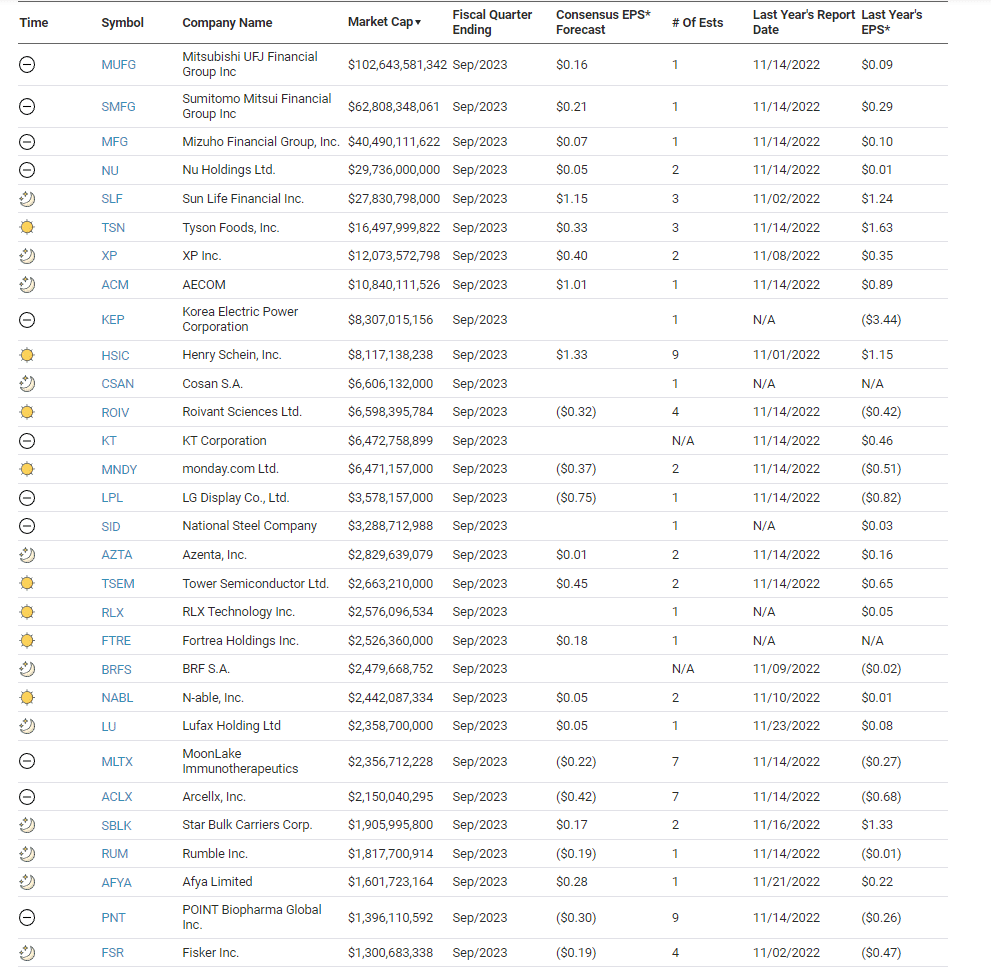
Earnings
Economy
- No notable economic releases
Market Trading Update
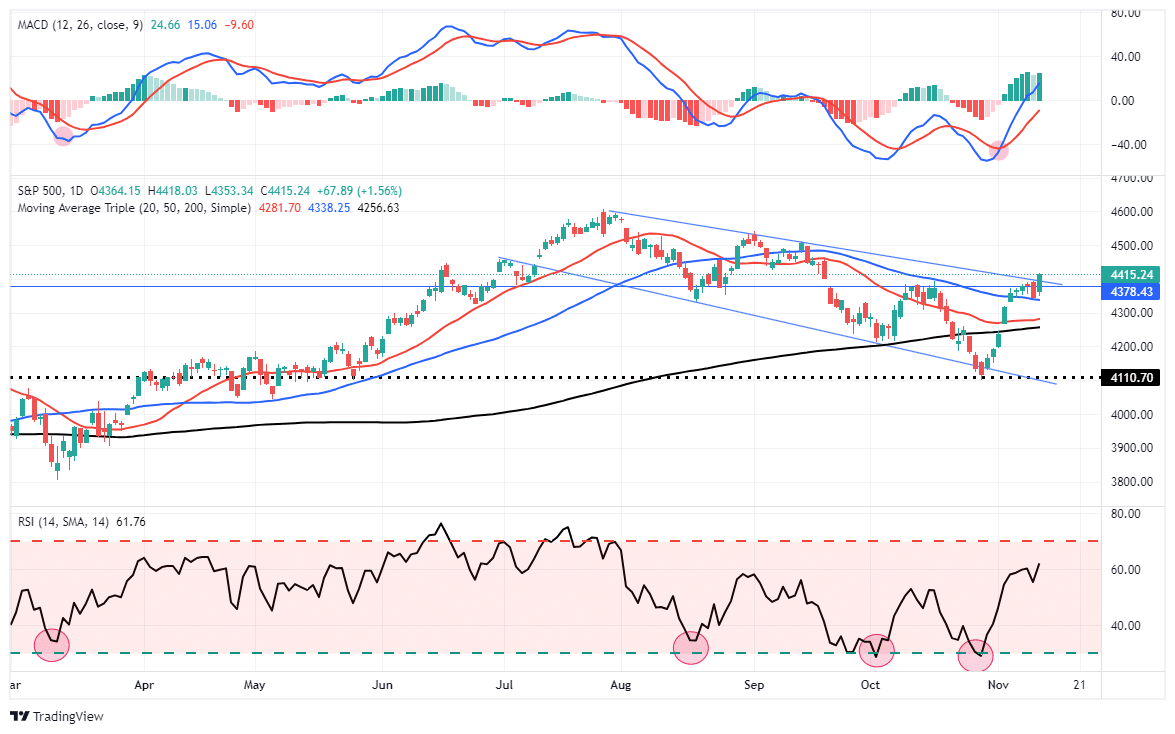
On Friday, the market recovered sharply following a couple of days of sloppy trading, with the market dismissing concerns about Jerome Powell’s hint at continued tight monetary policy. As noted through most this past week, the market is short-term overbought, but most likely, as we head into year-end, pullbacks will be shallow and brief, opportunities to add exposure. For now, money is continuing to pile into “momentum stocks” for the most part as a safe place to hide. As shown, there is little to suggest the rally that started at the beginning of November is in jeopardy.
On Friday, the market took out the upper downtrend line of the bearish channel from the July highs. If the market can hold above that previous resistance next week, our year-end target of 4500 becomes more viable. A retest of this year’s highs is certainly obtainable as well. However, it will most likely not be a straight advance higher. As we have suggested previously, we are using the rally to rebalance holdings in the portfolio, do some tax loss selling, and prepare portfolios for what we expect to be a challenging market in 2024.

The Week Ahead
CPI and PPI will be the most followed events of the week. Analysts expect CPI on Tuesday to be +0.3% monthly and fall to 3.3% annually. PPI is expected to rise by 0.1% versus 0.5% last month. The biggest driver of the CPI report will be shelter prices, accounting for over 30% of data. The pace at which CPI shelter prices catch up with declines in actual home and rental prices will help largely determine the path for CPI. Also of note, this week will be retail sales on Wednesday. After a robust 0.7% growth rate last month, expectations are for PPI to come in flat this month.
Bad 30-year Treasury Auction Or “Ransomware”?
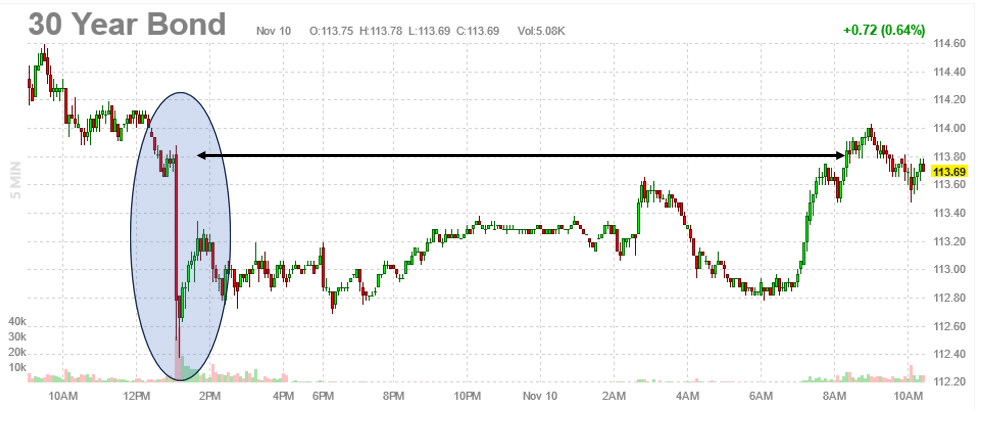
Yesterday’s Commentary touched on the bad 30-year U.S. Treasury auction and the ransomware attack that prevented ICBC from bidding on the auction or providing much-needed liquidity to other Treasury bidders. Given the market reaction on Friday morning, there appears to be truth to the ransomware story. The blue circle shows the immediate drop in 30-year bond futures upon the release of the auction’s results. The black arrow highlights that the post-auction swoon had been recovered by the market’s opening on Friday morning.
As we noted, the bond market is short-term overbought, so weakness is unsurprising. However, the historically bad auction results should probably not be taken as a sign that demand for bonds is non-existent, as some market narratives allude.
Small-Cap Stocks Are Struggling Versus Large-Caps
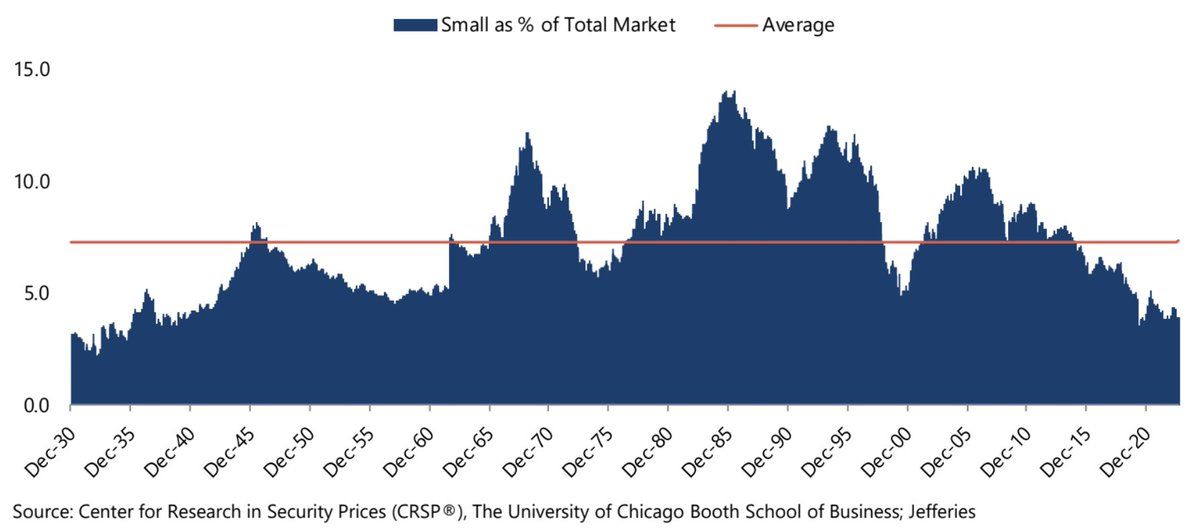
The two graphs below paint a troubling story for small-cap stock investors. The first graph below from Jefferies shows that the market cap of small-cap stocks as a percentage of the total market has fallen to levels last seen in the 1950s. The rapidly growing popularity of passive investment styles means that larger-cap stocks tend to find favor over small-cap stocks. Small-cap stocks generally require more research and analysis. Assuming that investors continue to lean toward passive approaches, requiring little homework, and away from active styles increasingly, the trend should continue.
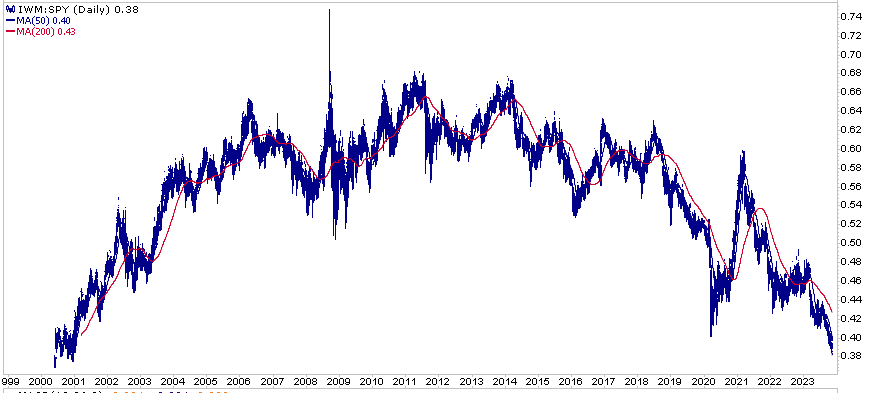
The second graph shows the price ratio of the Russell 2000 to the S&P 500. After significantly outperforming the S&P during the first decade of the 2000s, small-cap stocks have since given up those gains. The small-cap space has plenty of value, but many investors today are not value seekers. Small-cap stocks may again have their day in the sun when or if that changes.
Tweet of the Day
Please subscribe to the daily commentary to receive these updates every morning before the opening bell.
If you found this blog useful, please send it to someone else, share it on social media, or contact us to set up a meeting.
Also Read


