Oil Price Inflation & Interest Rates. What Is The Link?


Inside This Week’s Bull Bear Report
- The Link Between Oil Price Inflation & Interest Rates
- How We Are Trading It
- Research Report – A Recession Is Coming, Or Is It?
- Youtube – Before The Bell
- Market Statistics
- Stock Screens
- Portfolio Trades This Week
Market Update & Review
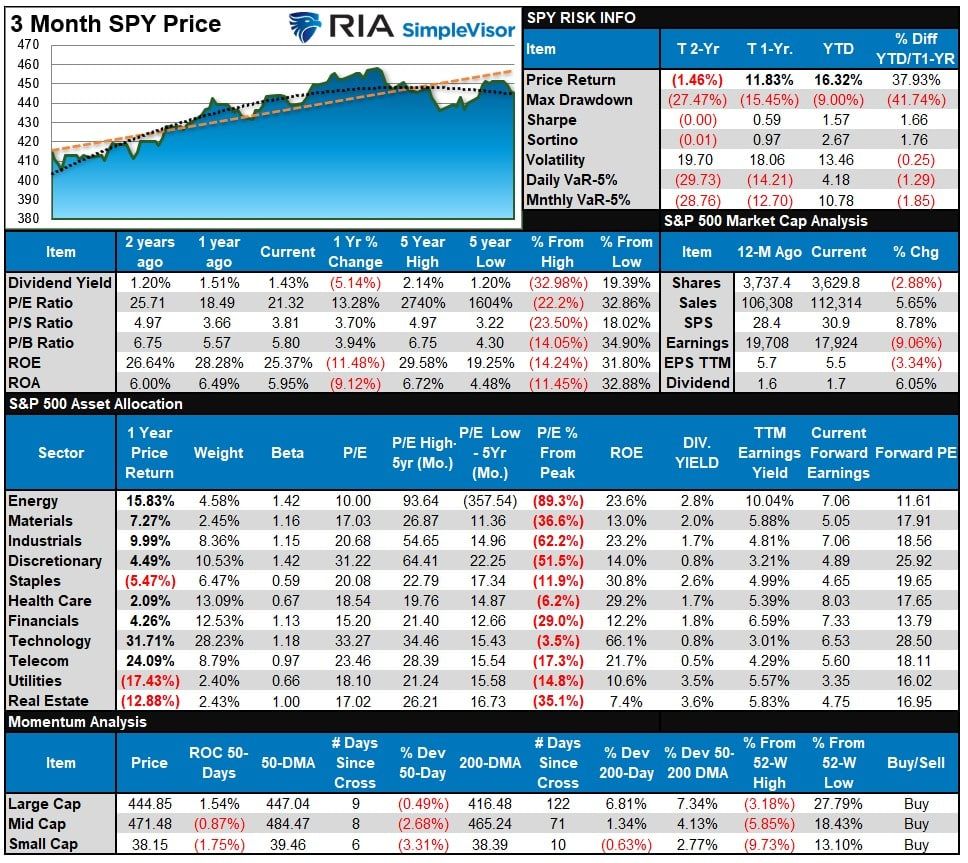
There was a lot of chatter this past week about the most recent oil price inflation and interest rates. This week, we will dig into higher oil prices, inflation, and the link between interest rates and the economy. However, before we delve into that topic, it was a sloppy first week of trading to start September.
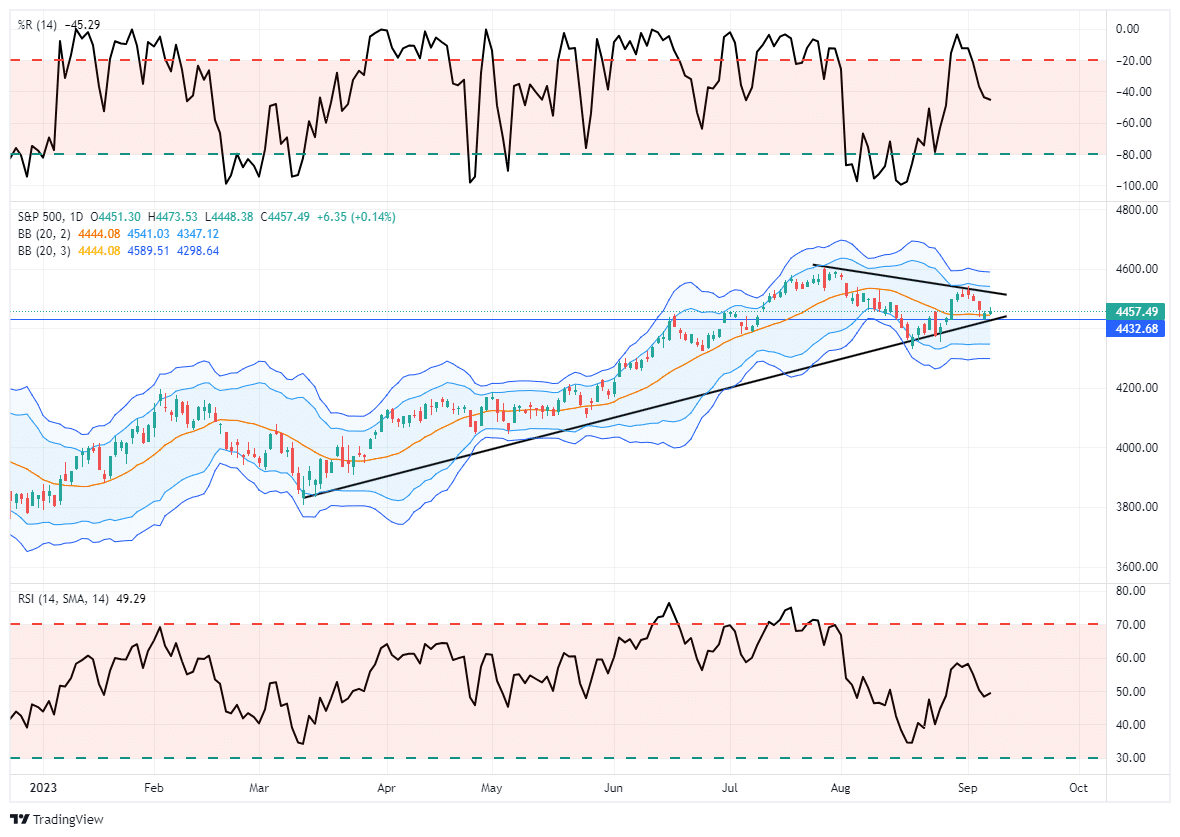
The market sold off decently over the last week, retesting the rising trend line and holding the 50-DMA. The more extreme overbought condition is about halfway through a corrective cycle, suggesting we could see further “sloppy” trading next week. With the market holding within a consolidation range, a breakout to the upside should confirm the start of the seasonal strong trading period into year-end.
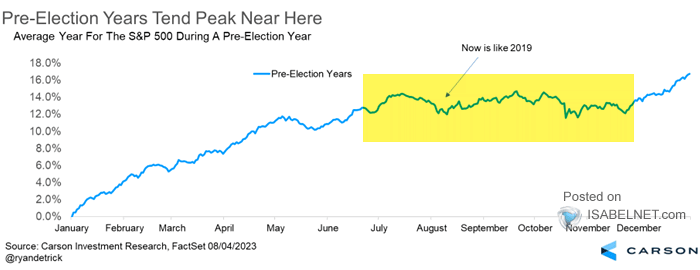
As shown, the July through October periods tend to trade sideways in pre-election years with a stronger year-end push as portfolio managers window-dress portfolios into year-end. This year, the market has tracked fairly closely to the historical norms and should continue into year-end, given no significant financial or economic upheaval.
We continue to suggest remaining allocated to the equity market for now. However, we recommend using short-term rallies to rebalance equity risks and overall allocations accordingly. While there is no evidence of a more severe market correction on the near-term horizon, such does not mean it can’t happen. As we get into 2024, the odds of a more meaningful contraction rise as the risk of economic recession grows. Continue to manage risk accordingly.
Now, about those rising oil prices.
Need Help With Your Investing Strategy?
Are you looking for complete financial, insurance, and estate planning? Need a risk-managed portfolio management strategy to grow and protect your savings? Whatever your needs are, we are here to help.

Oil Price, Inflation, And The Link To Interest Rates
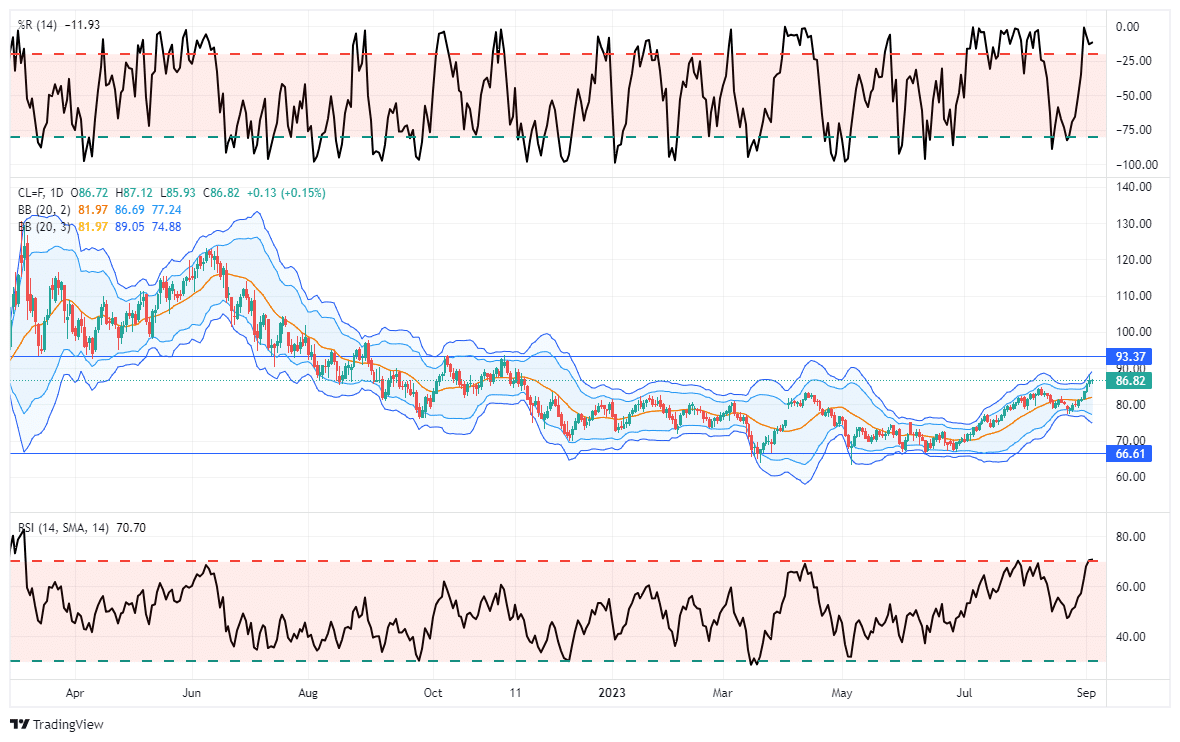
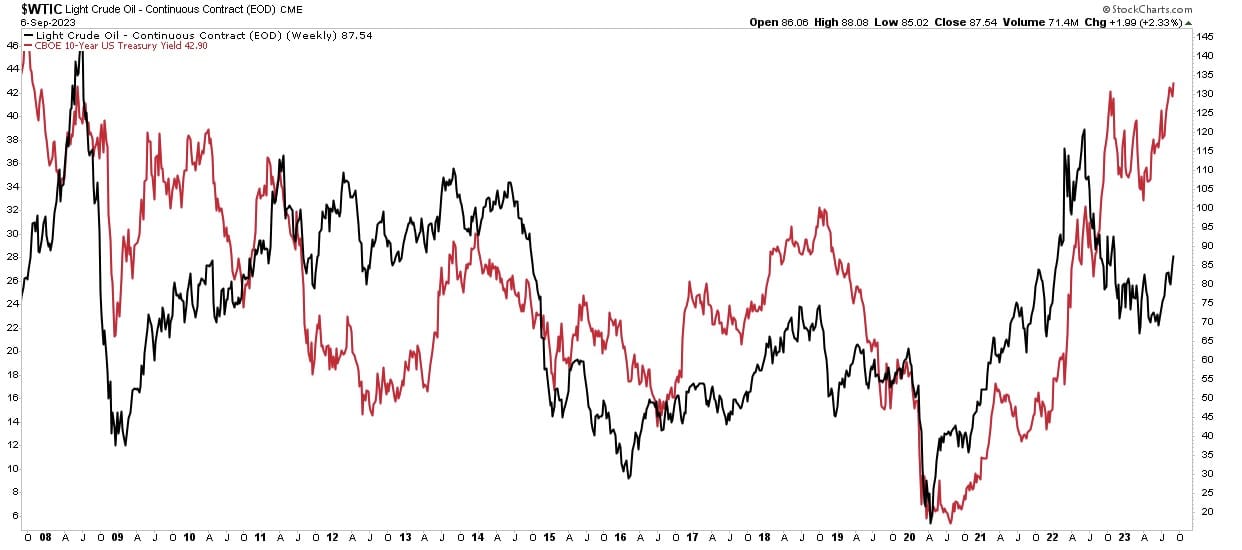
Last week, oil prices surged, sparking inflation fears as Russia and OPEC extended current production cuts. However, as is always the case, it is important to keep price movements in context. As shown in the chart below, oil prices had become oversold in August following the decline from the previous peak. Notably, oil prices are now back to more overbought levels where price corrections previously occurred. While there is much arm-waving and hand-wringing about the current oil price inflation, oil remains in a broad trading range from 2022.
While oil price inflation is certainly a worry, as it increases the burden on individuals, is the recent rise in oil prices warning of a surge in inflation? With the Federal Reserve recently suggesting its inflation battle is not yet won, what does that suggest for higher rates? Lastly, what about the impact of oil price inflation on the economy?
These are good questions we will explore. Let’s start with the linkage between oil prices and inflation.
Let’s take a look at what makes up the inflation index.
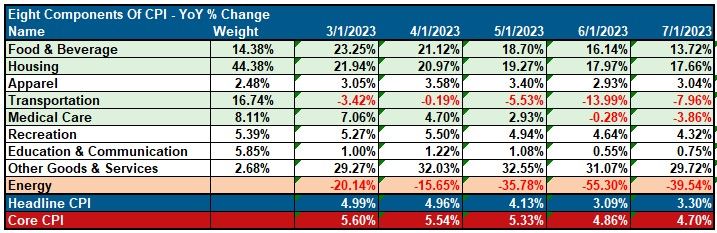
Notice that “Food & Beverage,” “Housing,” “Transportation,” and “Medical Care” are the most significant weights in the CPI calculation. While Energy is included and makes up about 7% of the total CPI calculation, it is excluded, along with food, in the core inflation calculation. While oil price inflation does negatively impact consumers, it is excluded by the Federal Reserve for monetary policy decisions. The chart below compares oil prices to the core inflation rate.
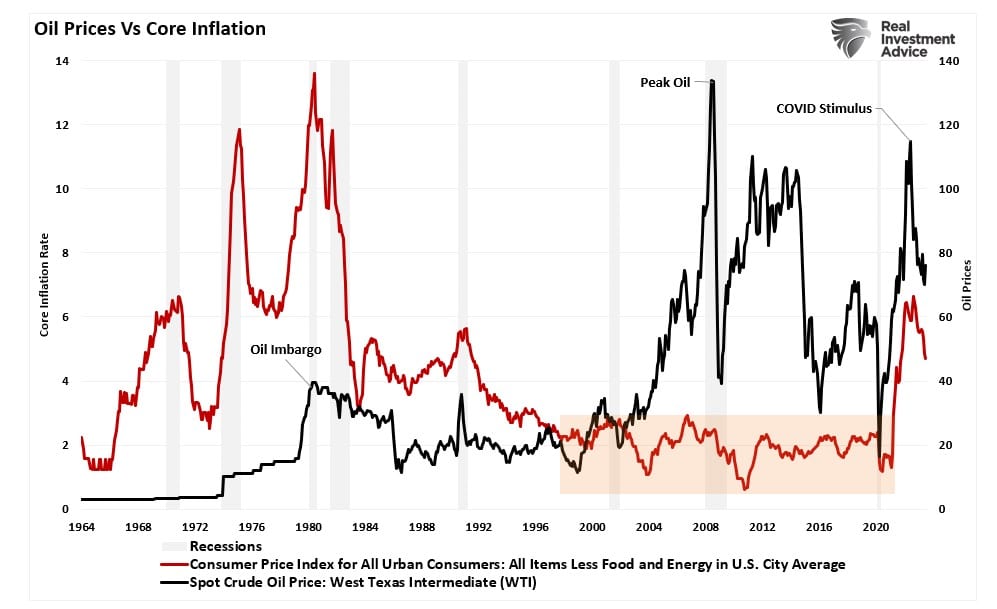
As you will notice, since 1980, there has been a very low correlation between oil prices and core inflation. Michael Lebowitz commented on that this past week.
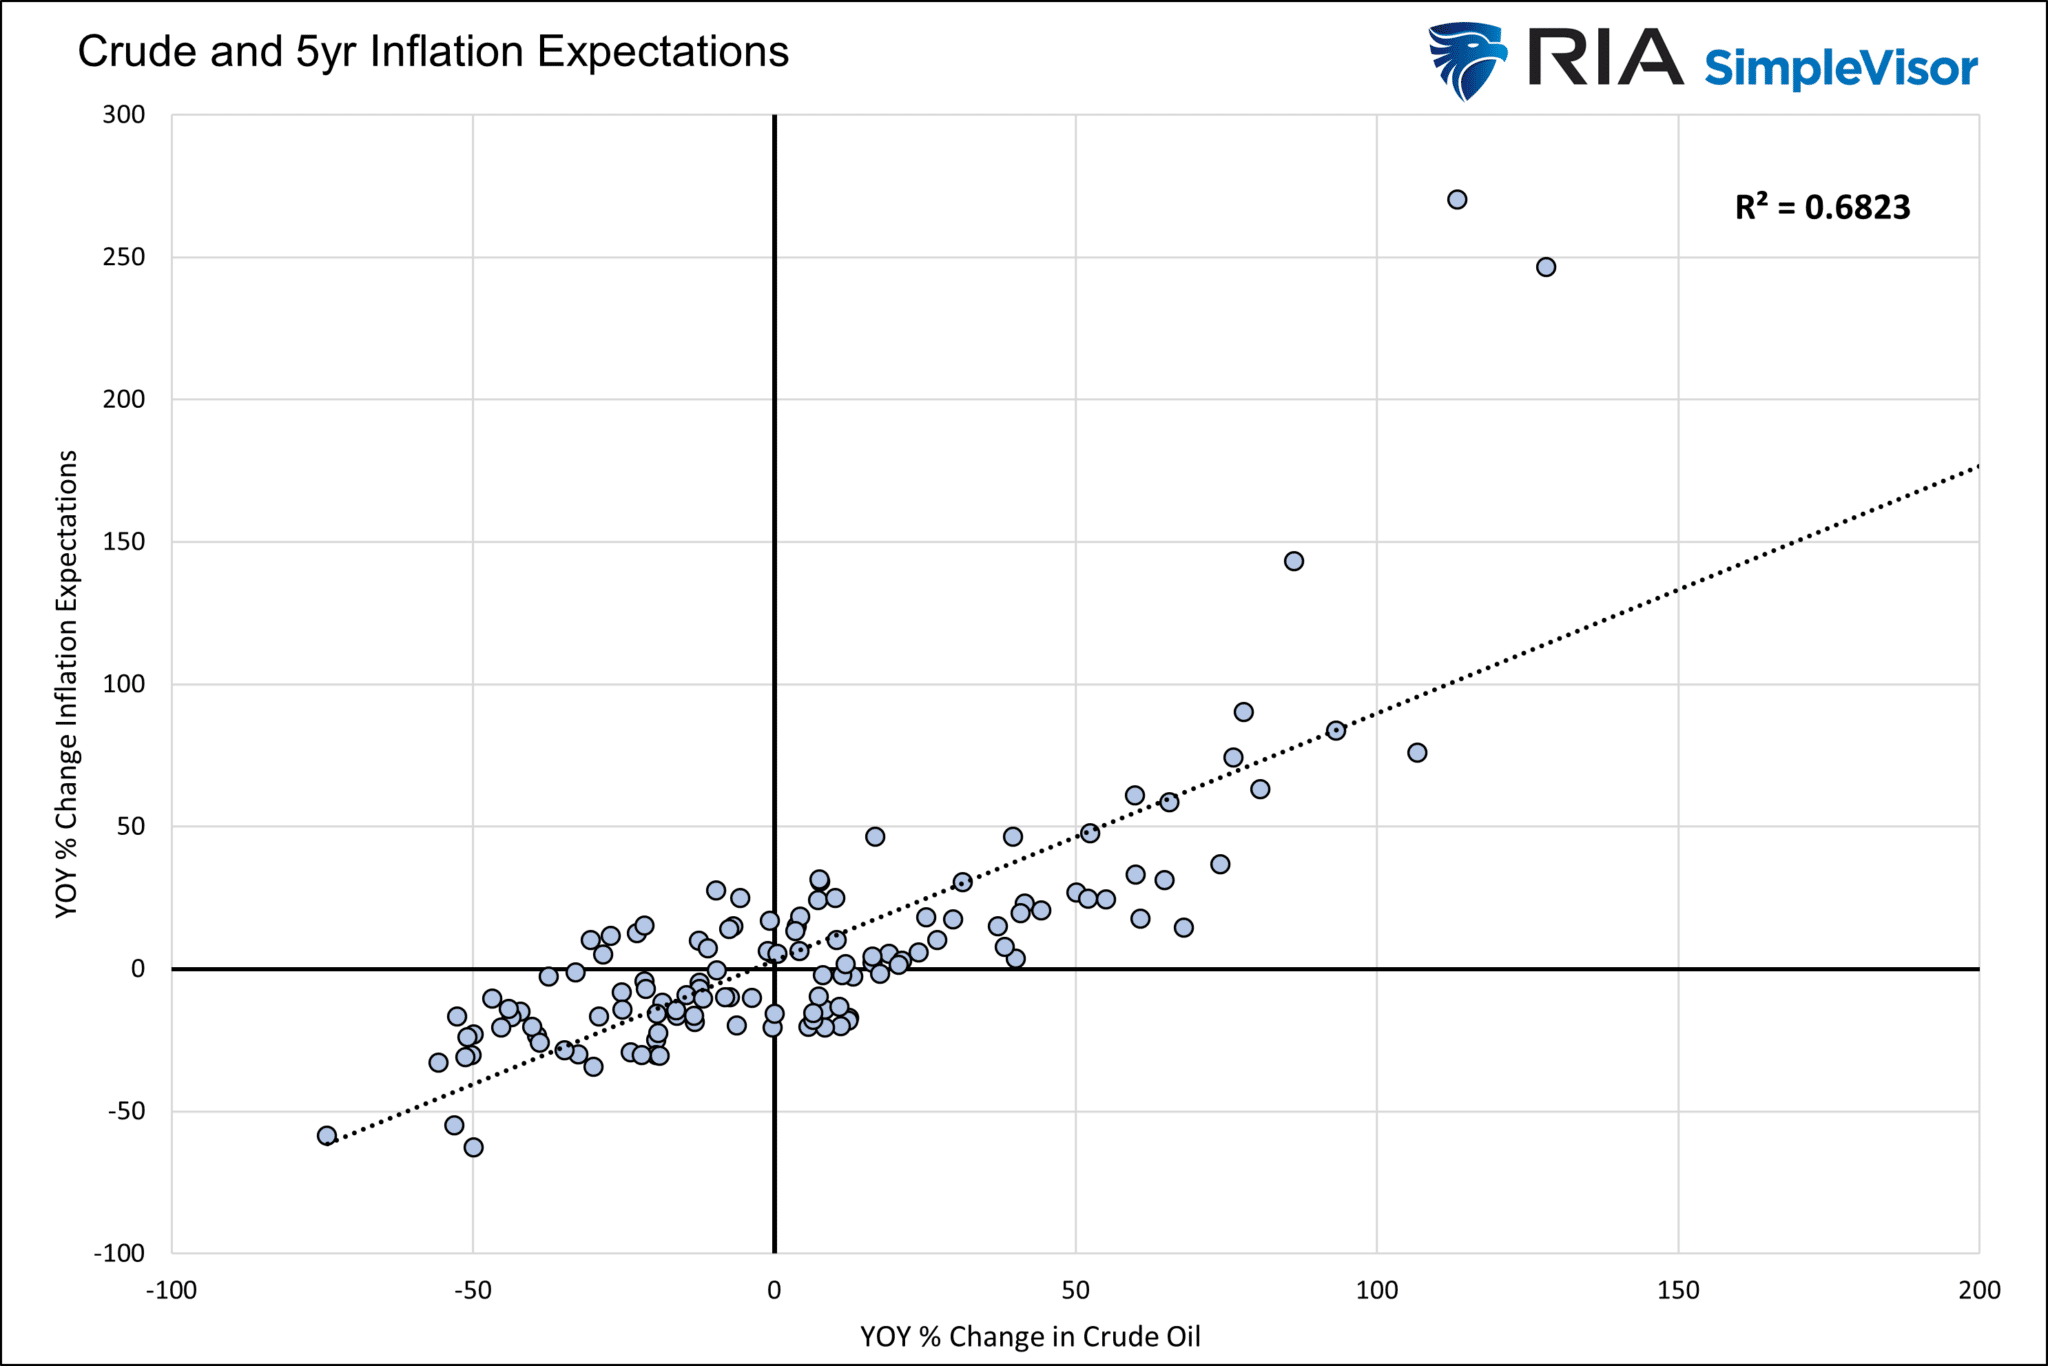
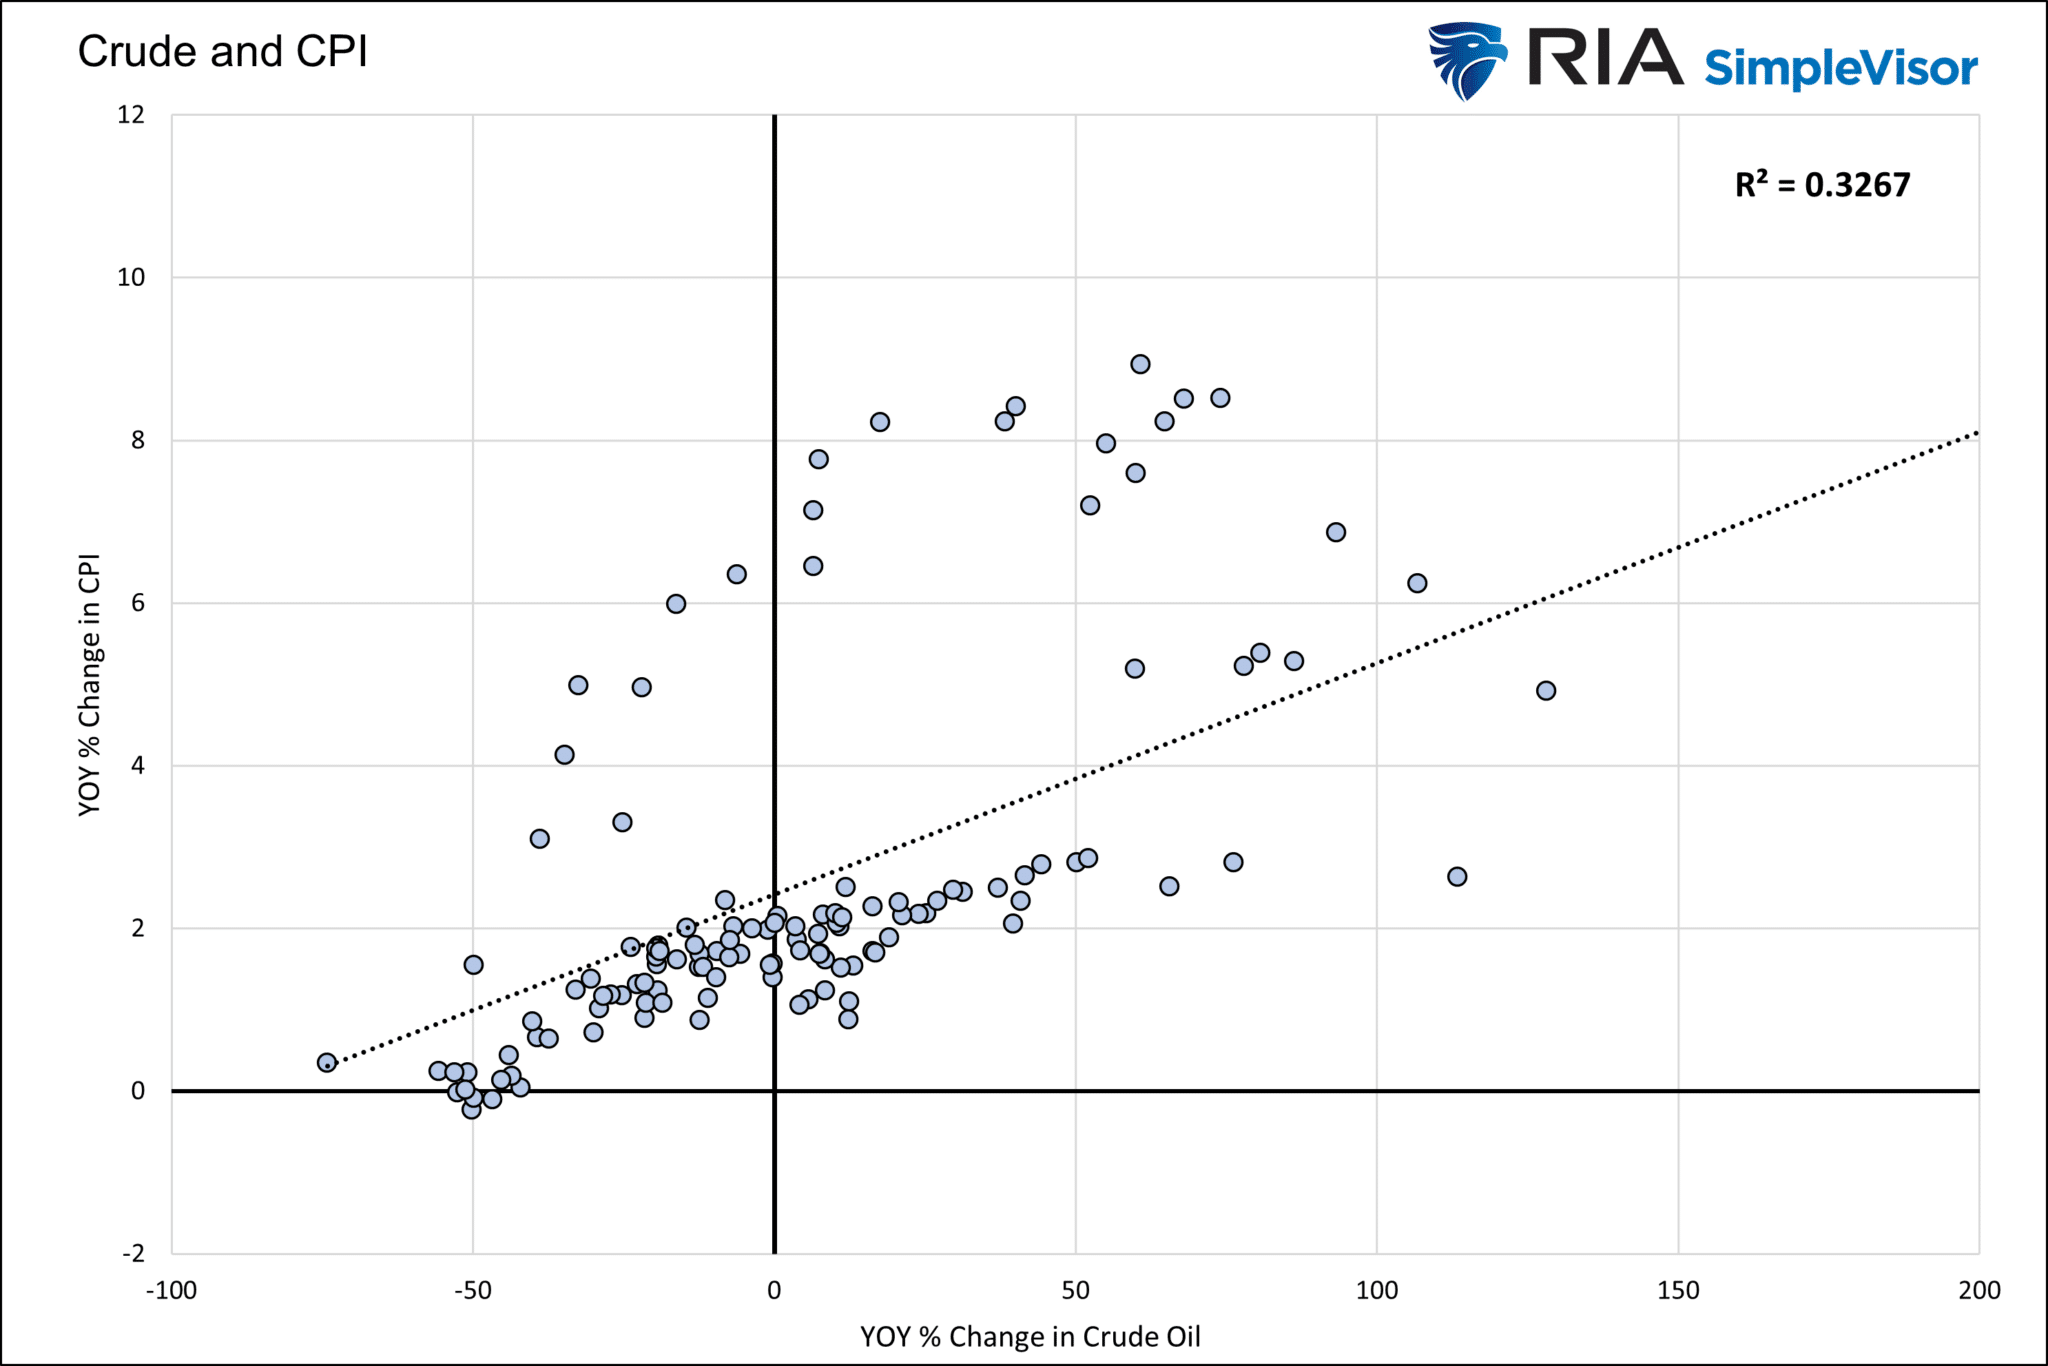
“While such a correlation between crude and inflation expectations is the norm, the correlation between CPI and crude is less robust. As we show below, crude oil prices have much less of an impact on inflation than traders expect. The first graph below shows the strong relationship between crude oil and 5-year inflation expectations. The second graph shows the relationship is strong when inflation is low, but it vanishes when CPI is above the Fed’s 2% target, as we have today.”
However, a critical aspect of surging oil prices is essential: its impact on economic outcomes.
Oil Price Inflation And Economic Outcomes
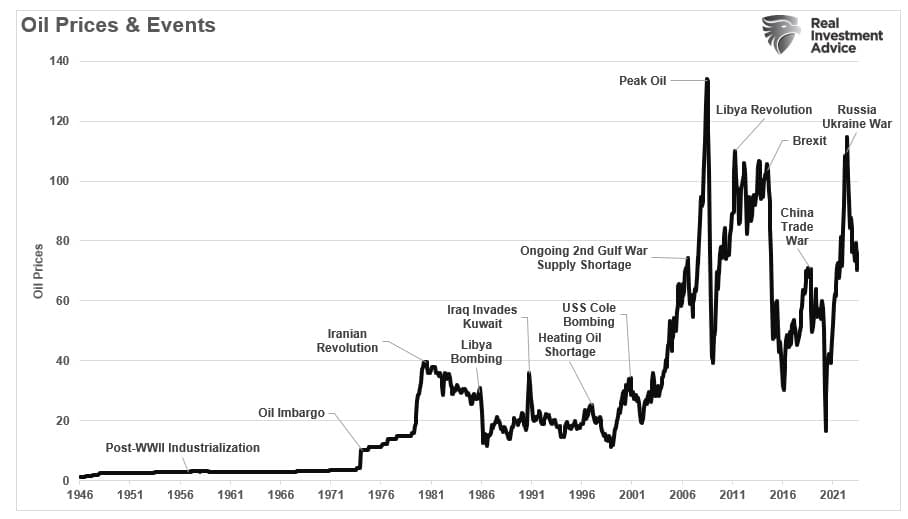
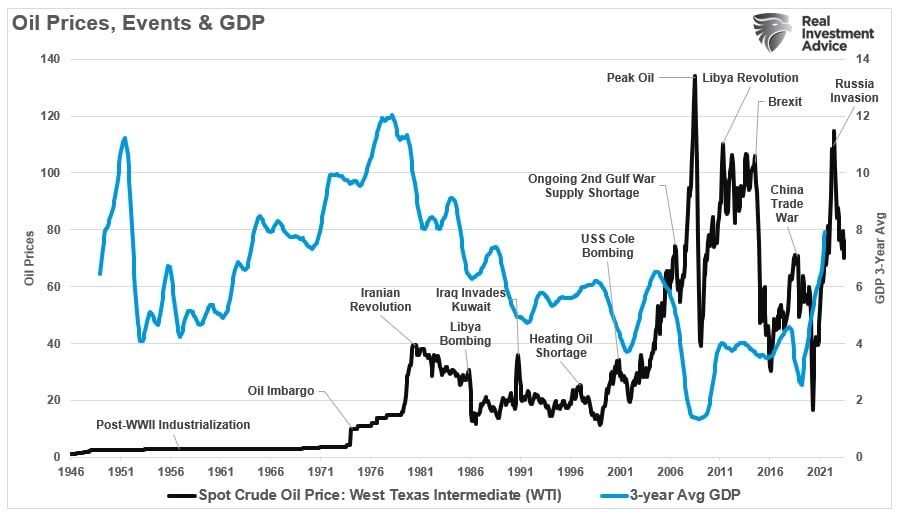
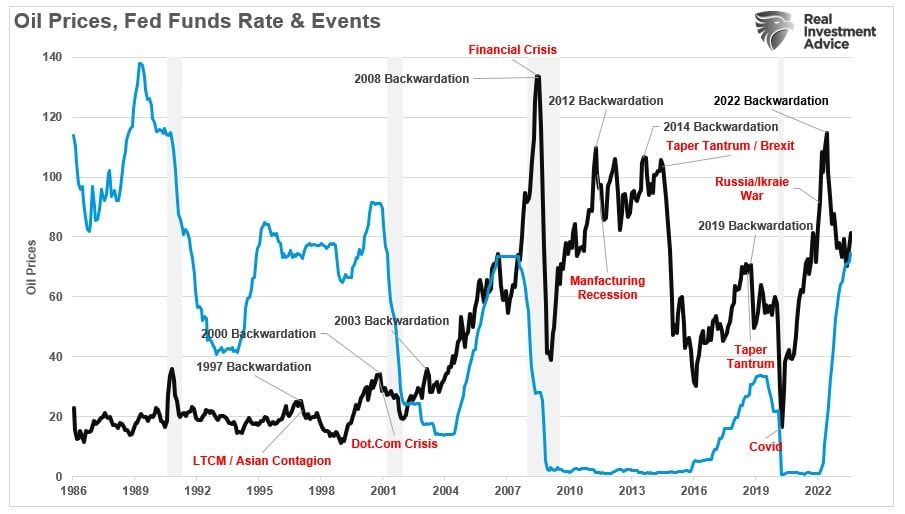
Oil spikes have historically negatively impacted economic outcomes. As the chart below shows, oil spikes typically are short-lived due to some exogenous geopolitical event. However, as was the case from 2003-2008, fundamental concerns, in this case, the fear of “peak oil,” can lead to more extended periods of higher prices.
The chart shows the inflation-adjusted price of oil since 1960.
While higher oil prices benefit oil companies by making the extraction process more profitable, the economy also has a negative impact.
“High oil prices add to the costs of doing business. And these costs are area also ultimately passed on to customers and businesses. Whether it is higher cab fares, more expensive airline tickets, the cost of apples shipped from California, or new furniture shipped from China, high oil prices can result in higher prices for seemingly unrelated products and services.” – Investopedia
Of course, high oil prices are immediately noticeable to consumers who fill up their gas tanks each week. While economic inflation reports strip food and Energy from the core calculation, the cost of food and fuel drives consumption patterns in the short term. Given that consumption comprises roughly 70% of the GDP calculation, the impact of higher oil prices is almost immediate.
Oil prices are crucial to the overall economic equation. As such, there is a correlation between oil prices, inflation, and interest rates.
The Link To Oil
We consume oil in virtually every aspect of our lives. From the food we eat to the products and services we buy. The demand side of the equation is a tell-tale sign of economic strength or weakness. We can see this clearly in the chart below, which combines rates, inflation, and GDP into one composite indicator.
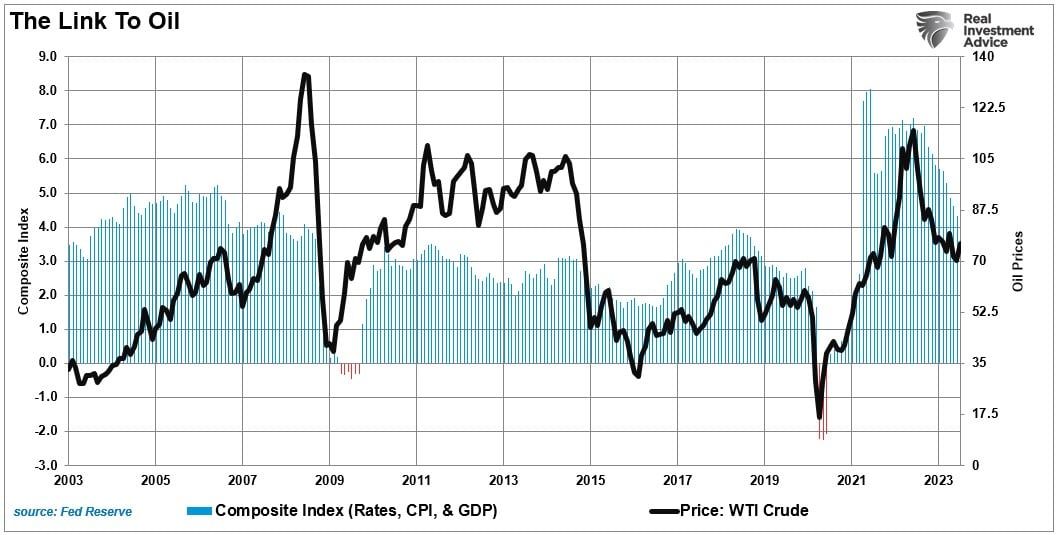
Notably, the oil industry is very manufacturing and production intensive. Therefore, price changes tend to be highly correlated to changes in the economic composite. While rising oil prices increase manufacturing and CapEx, reducing consumption subtracts from economic growth.
However, here is the most critical point.
“It should not be surprising that sharp spikes in oil prices have been coincident with downturns in economic activity, a drop in inflation, and a subsequent decline in interest rates.“
The most recent surge in oil prices started in early 2020. It was the direct result of the massive flood of fiscal policy, which created a consumption boom. However, this followed the collapse in oil prices as demand collapsed from the economic shutdown. However, the massive flood of stimulus into the economy artificially and, most importantly, temporarily created a demand surge. That demand surge, against a backdrop of reduced supply of inventory and labor, created inflation. As shown by the decline in oil prices from the previous peak, the decline in inflation will lead to an eventual decline in interest rates.
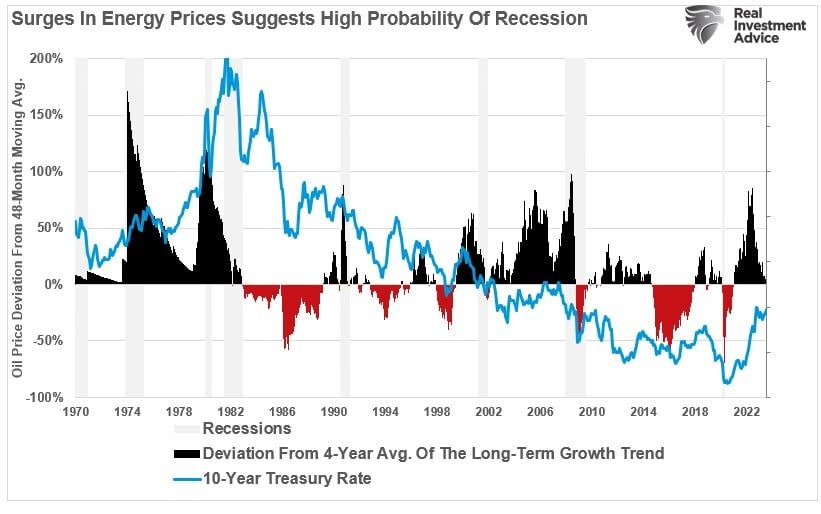
The short version is that oil prices reflect supply and demand. Economic demand is weakening as liquidity reverses, and surging oil prices divert disposable incomes from other consumption needs. As shown, the correlation between oil spikes and declines in economic growth (3-year average growth rate) should not be surprising.
Recessions Reduce Oil Prices
The risk of a recession is rising. The “artificial inflation” surge from the flood of liquidity against a supply shortage will eventually revert to a disinflationary trend. Debt and demographics will also continue to drive deflationary pressures, leading to a reversal of the inflation trade.
However, the recent oil price inflation drove investor’s fears about a resurgence of inflation. Such is not likely the case for the simple reason that higher oil prices are a drag on consumption. However, as the economic slowdown/recession takes hold later next year, such will coincide with a sharp decline in interest rates as deflation re-emerges.
Of course, the Federal Reserve’s monetary policy is currently the biggest drag on economic growth, with the highest propensity to induce a recession. Historically, when the Fed has hiked rates or tapered its balance sheet, oil prices fall due to slower economic growth. Again, such should be unsurprising as oil prices are a function of supply and demand.
Notably, with oil prices high, student loan payments restarting, and slowing job growth running headlong into elevated interest rates, the drag on the economy is significantly larger than economists currently expect.
Eventually, when history again repeats, it won’t be just oil prices and energy stocks brought down.
How We Are Trading It
Last week, I noted that:
“With portfolios near full target equity exposure, we will use the current rally to rebalance portfolio risks as needed. As in this week’s commentary, we are certainly not oblivious to the impact of tighter financial conditions. However, for now, traders are offsetting those risks with the “hope” the Fed will reverse policy sooner rather than later. Therefore, we must pay attention to what the market is doing in the short term but keep a vigilant watch on overall market action as we head into year-end.”
That remains the case this week, and while the market pulled back a bit after the recent run, unsurprisingly, there is no real sign of concern by market participants overall.
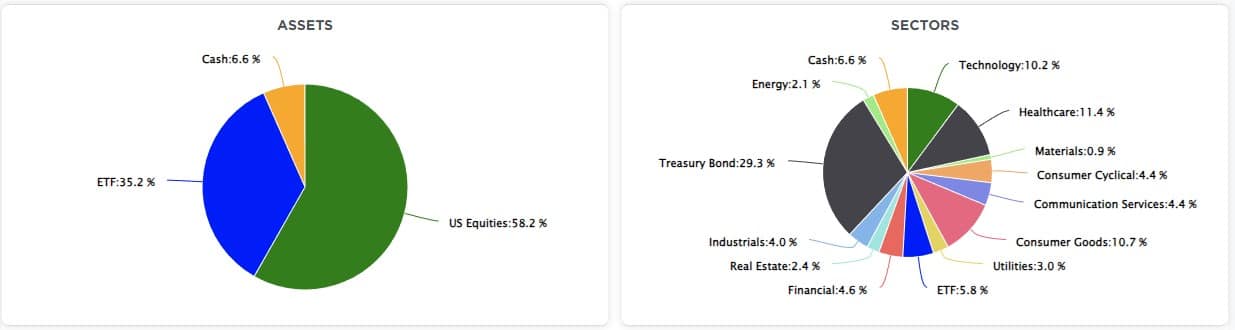
While our current allocation remains virtually the same heading into next week, we did execute the bond swap, as discussed last week. As we noted then, the reasons for swapping the majority of our portfolio allocations in Treasury Bond ETFs into a similar duration Treasury Bond were three-fold: 1) Provides a guaranteed, and slightly better, yield to the maturity, 2) maintains portfolio liquidity, and, 3) reduced the portfolio’s expenses overall.
Click on the Before The Bell link for the complete discussion on the bond swap and our reasonings for doing so.
September is living up to its sloppy month reputation, so maintain your risk management discipline accordingly.
See you next week.
Research Report
Subscribe To “Before The Bell” For Daily Trading Updates
We have set up a separate channel JUST for our short daily market updates. Please subscribe to THIS CHANNEL to receive daily notifications before the market opens.
Click Here And Then Click The SUBSCRIBE Button
Subscribe To Our YouTube Channel To Get Notified Of All Our Videos
Bull Bear Report Market Statistics & Screens

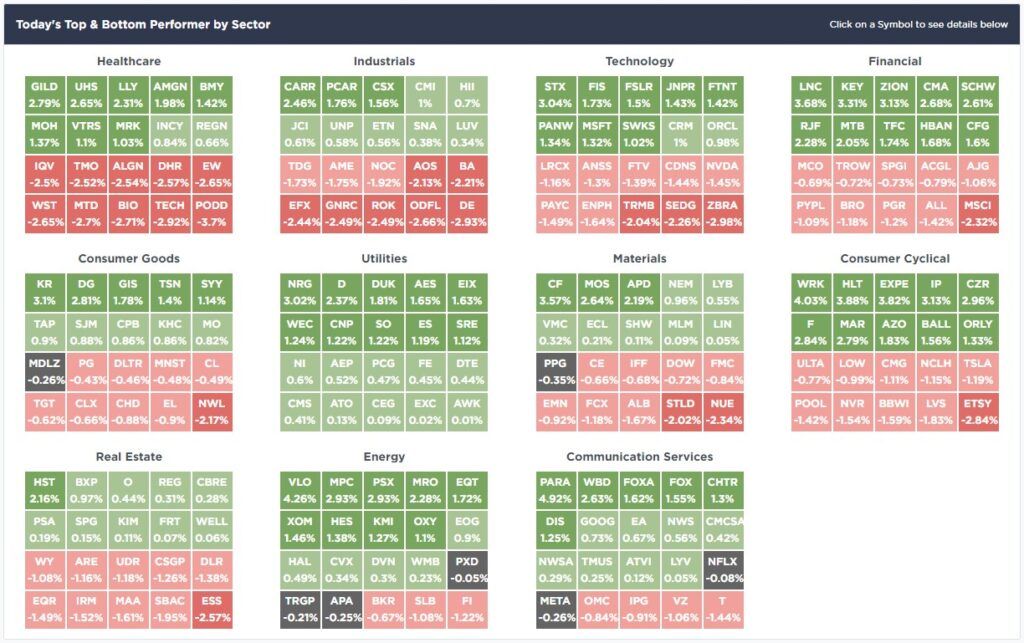
SimpleVisor Top & Bottom Performers By Sector
S&P 500 Weekly Tear Sheet
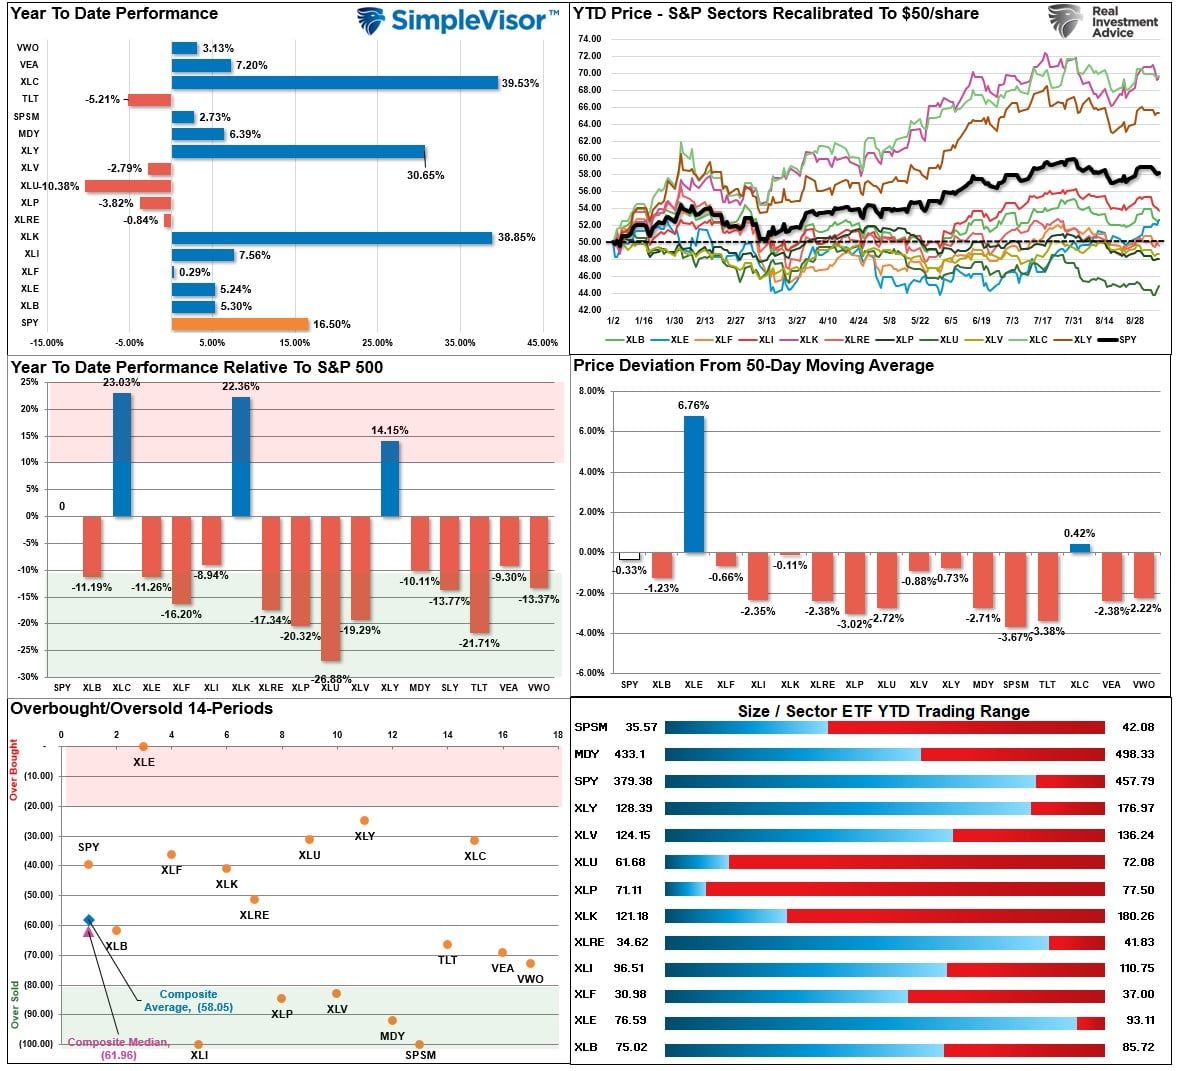
Relative Performance Analysis
Last week, we stated:
“With most major markets and sectors moving back into more overbought areas, a further rally will become more challenging in the short term. Look for pullbacks to support and a reversal of the more overbought conditions to add to portfolio positions. With the MACD buy signal in place, we want to increase exposure; however, we can make those increases more opportunistically.”
This past week that is what happened, as stocks sold off early in the week to retest the 50-DMA. That pullback provided a decent entry point to add exposure as needed. With Energy back to overbought, look for a potential rotation from Energy back to the “disinflation” trade of Technology, Communications, and Discretionary next week.
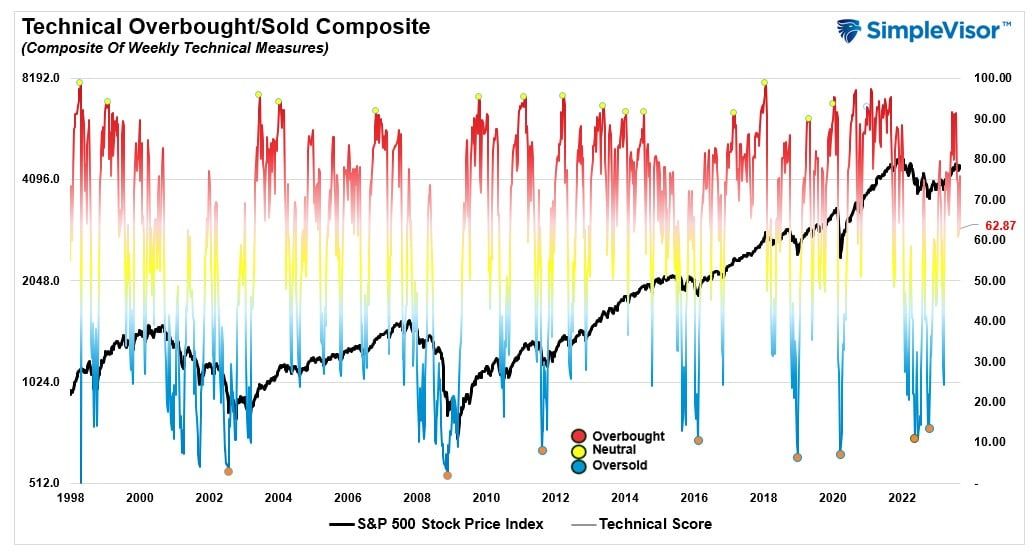
Technical Composite
The technical overbought/sold gauge comprises several price indicators (R.S.I., Williams %R, etc.), measured using “weekly” closing price data. Readings above “80” are considered overbought, and below “20” are oversold. The market peaks when those readings are 80 or above, suggesting prudent profit-taking and risk management. The best buying opportunities exist when those readings are 20 or below.
The current reading is 62.87 out of a possible 100.
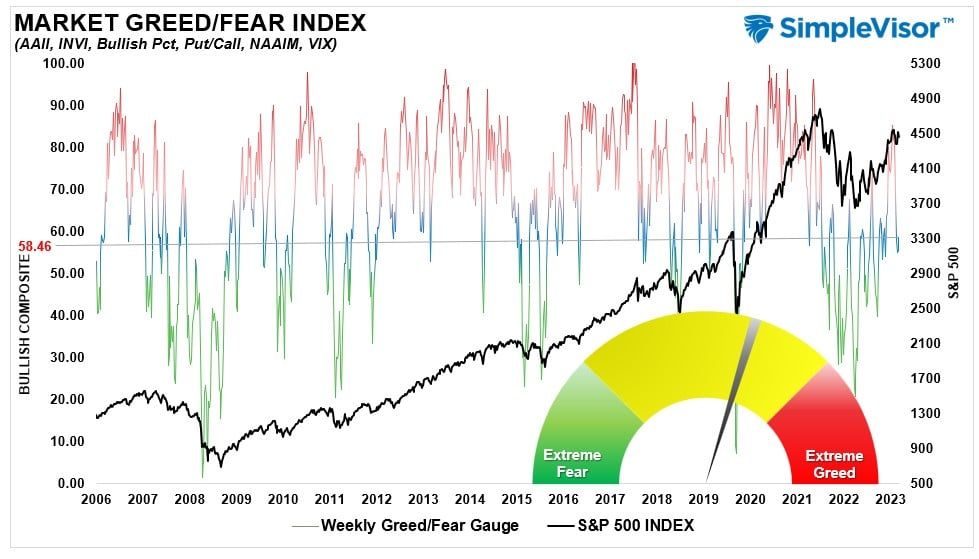
Portfolio Positioning “Fear / Greed” Gauge
The “Fear/Greed” gauge is how individual and professional investors are “positioning” themselves in the market based on their equity exposure. From a contrarian position, the higher the allocation to equities, the more likely the market is closer to a correction than not. The gauge uses weekly closing data.
NOTE: The Fear/Greed Index measures risk from 0 to 100. It is a rarity that it reaches levels above 90. The current reading is 58.46 out of a possible 100.
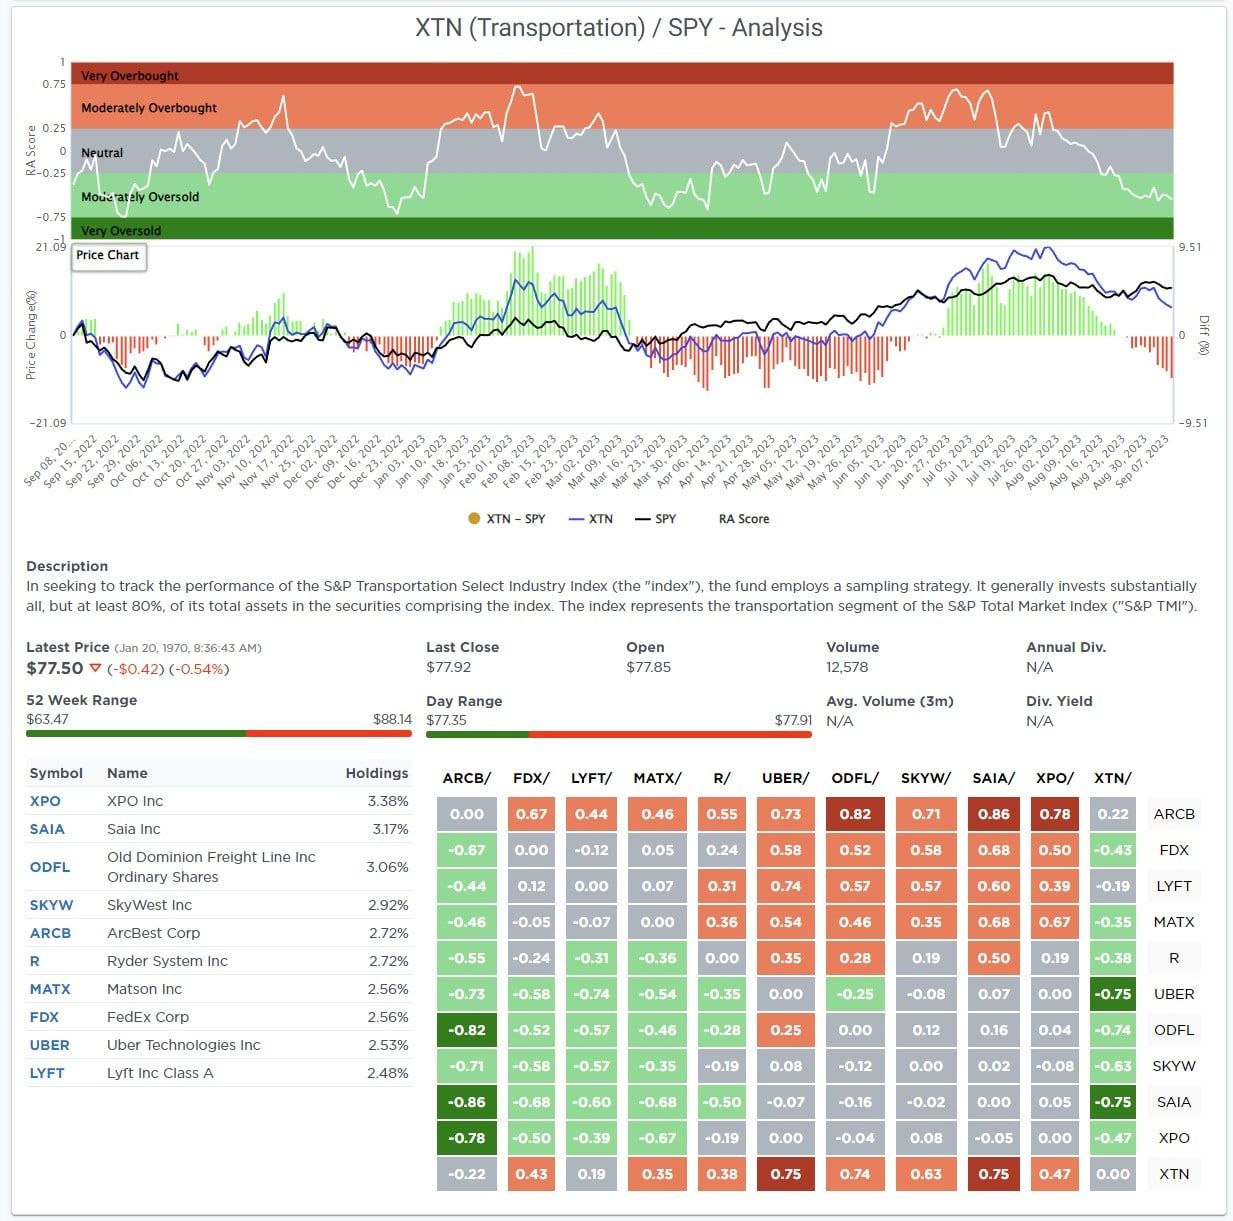
Relative Sector Analysis
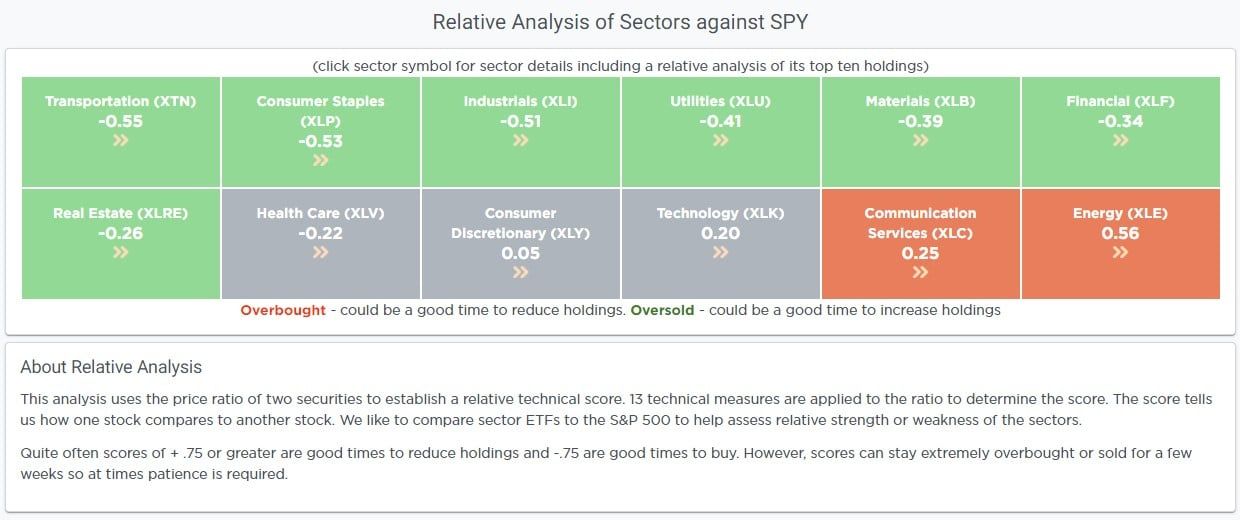
Most Oversold Sector Analysis
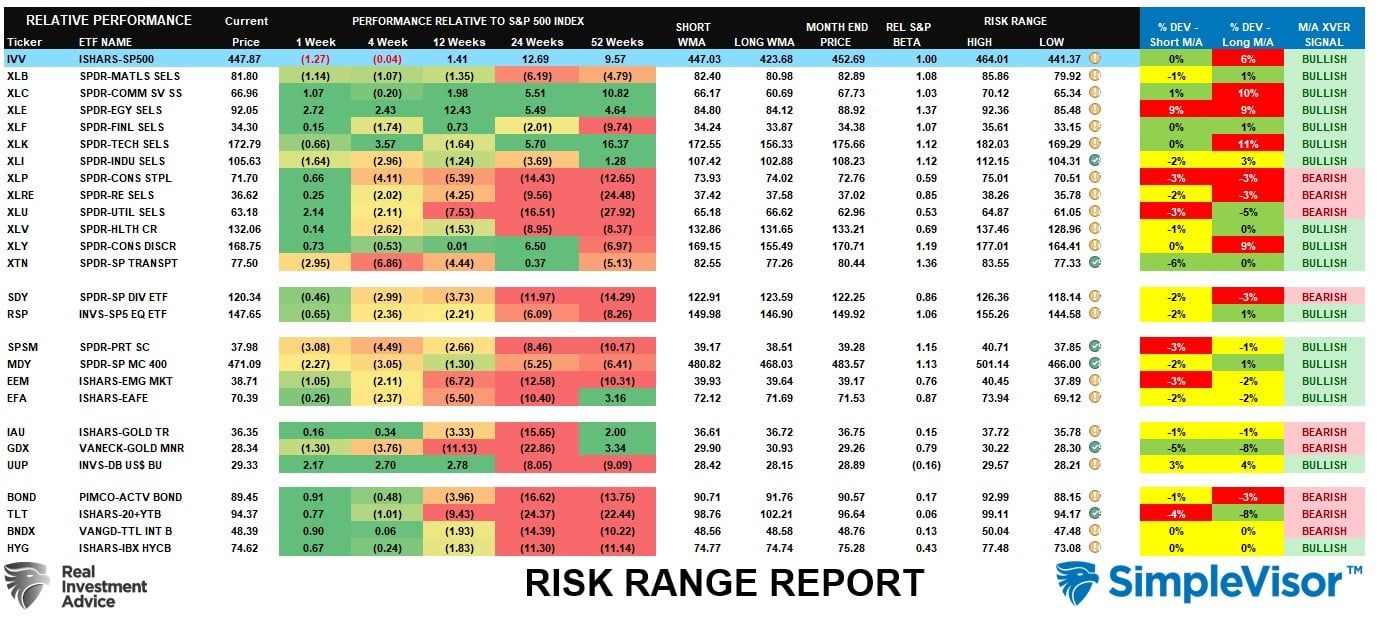
Sector Model Analysis & Risk Ranges
How To Read This Table
- The table compares the relative performance of each sector and market to the S&P 500 index.
- “MA XVER” (Moving Average Crossover) is determined by the short-term weekly moving average crossing positively or negatively with the long-term weekly moving average.
- The risk range is a function of the month-end closing price and the “beta” of the sector or market. (Ranges reset on the 1st of each month)
- The table shows the price deviation above and below the weekly moving averages.
There was much change to the risk/range analysis from last week as we are still within the first five trading days of the month. Next week should give us some better clues about the relevant risk ranges of the market on a month-to-date basis.
Weekly SimpleVisor Stock Screens
We provide three stock screens each week from SimpleVisor.
This week, we are searching for the Top 20:
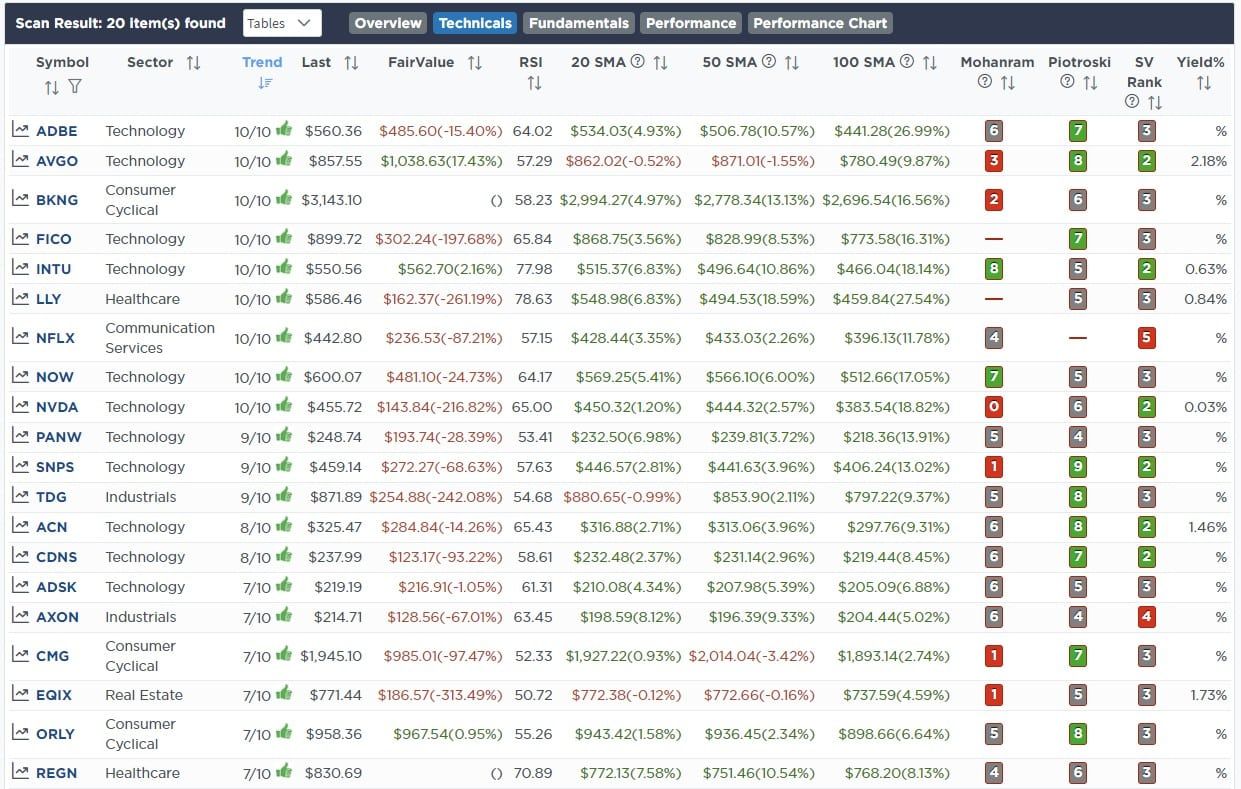
- Relative Strength Stocks
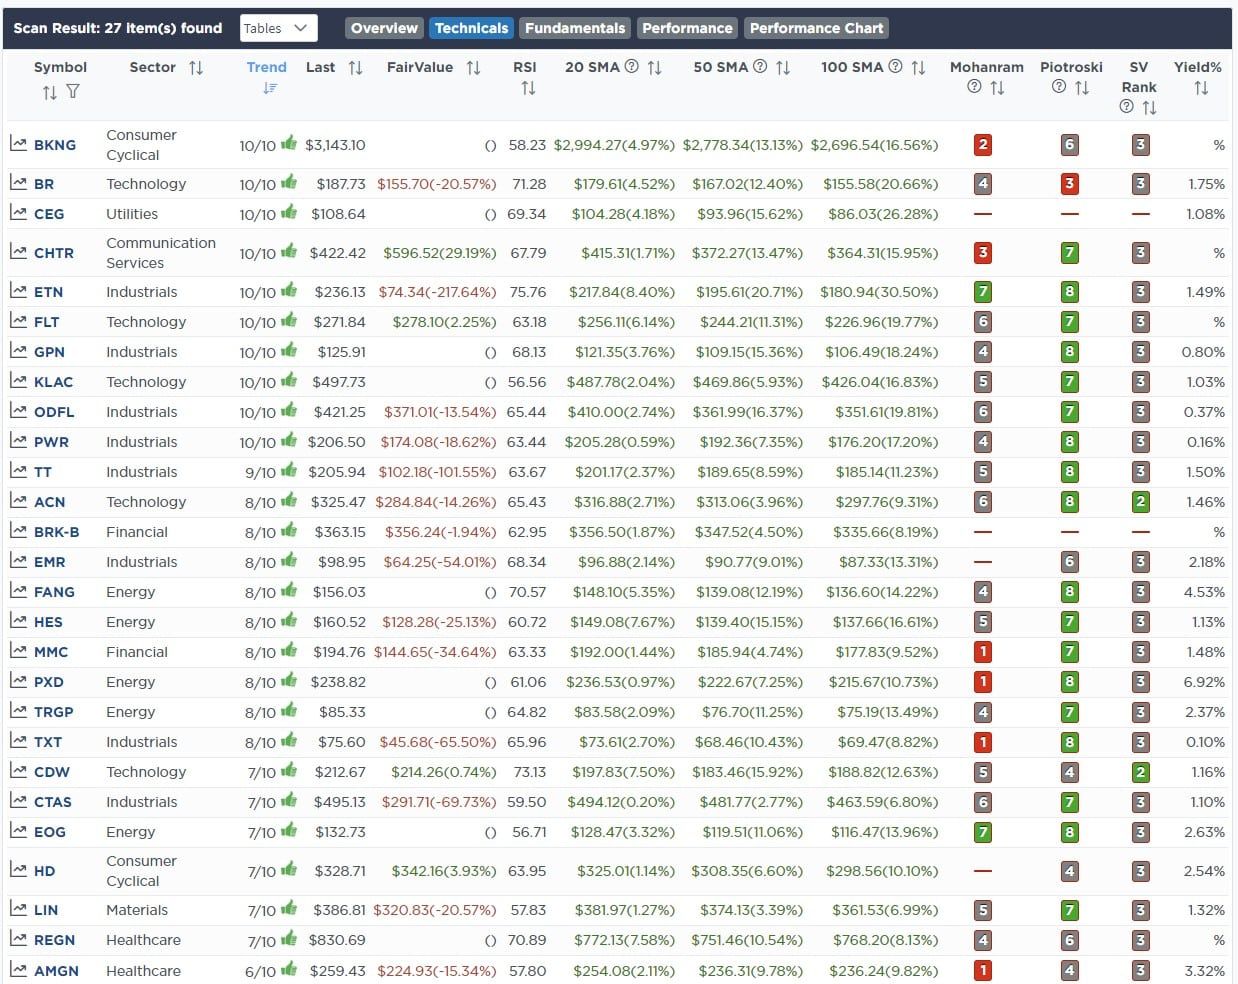
- Momentum Stocks
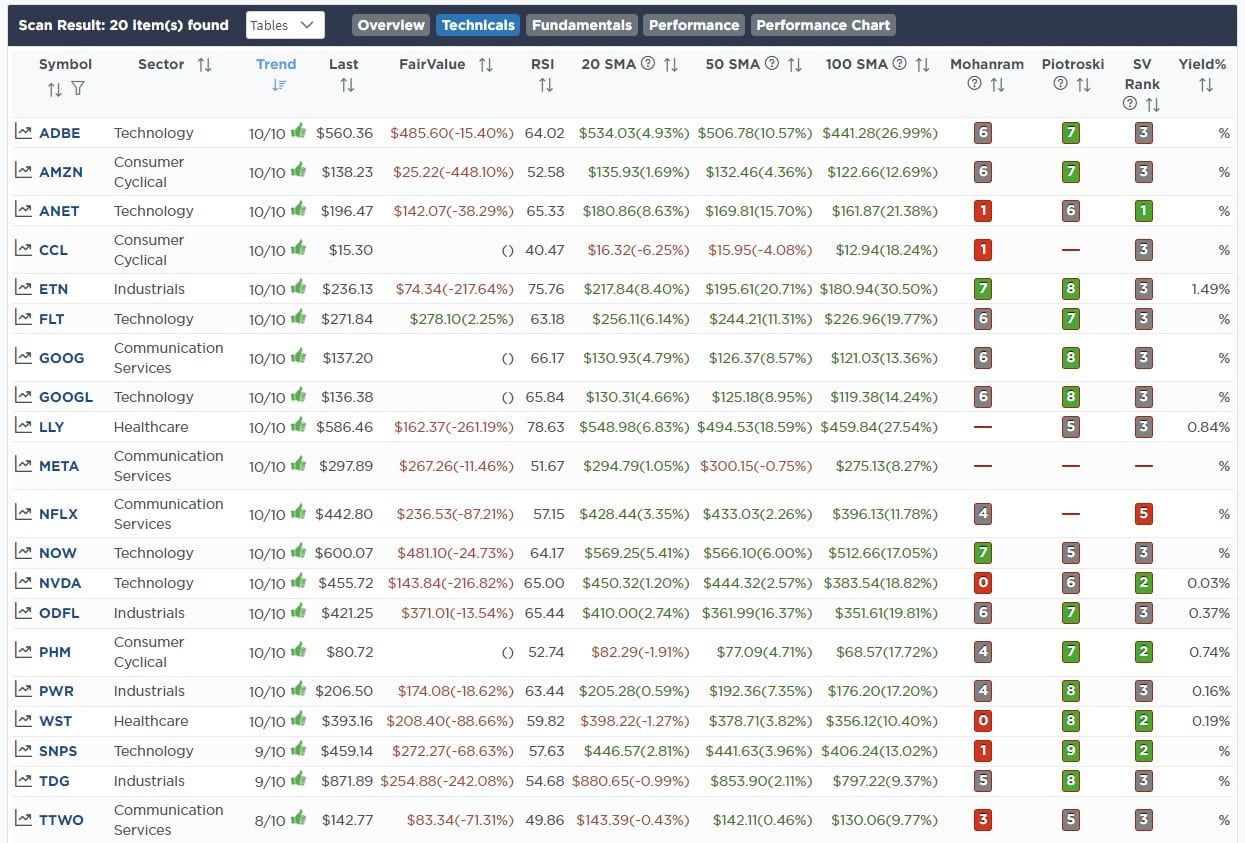
- Fundamental & Technical Strength
(Click Images To Enlarge)
R.S.I. Screen
Momentum Screen
Fundamental & Technical Strength
SimpleVisor Portfolio Changes
We post all of our portfolio changes as they occur at SimpleVisor:
September 6th
“As we have repeatedly discussed in our weekly newsletter, we have been waiting for the right opportunity to do a bond swap in our portfolios. We are taking that action today.
We are selling the iShares Treasury Bond ETF (TLT) and buying an equal weighting of the Vanguard Extended Duration Bond ETF (EDV). This action provides benefits for us heading into year-end. The first is that it extends our bond duration, providing a potentially higher return on investment when bond prices decline. Secondly, it boosts the yield to the portfolio while we await rates to decline heading into a recession.”
Both Models
- Sell 100% Of The iShares Treasury Bond ETF (TLT)
- Buy 13% Of The Portfolio In The Vanguard Extended Duration Bond ETF (EDV)

Lance Roberts, C.I.O.
Have a great week!


