


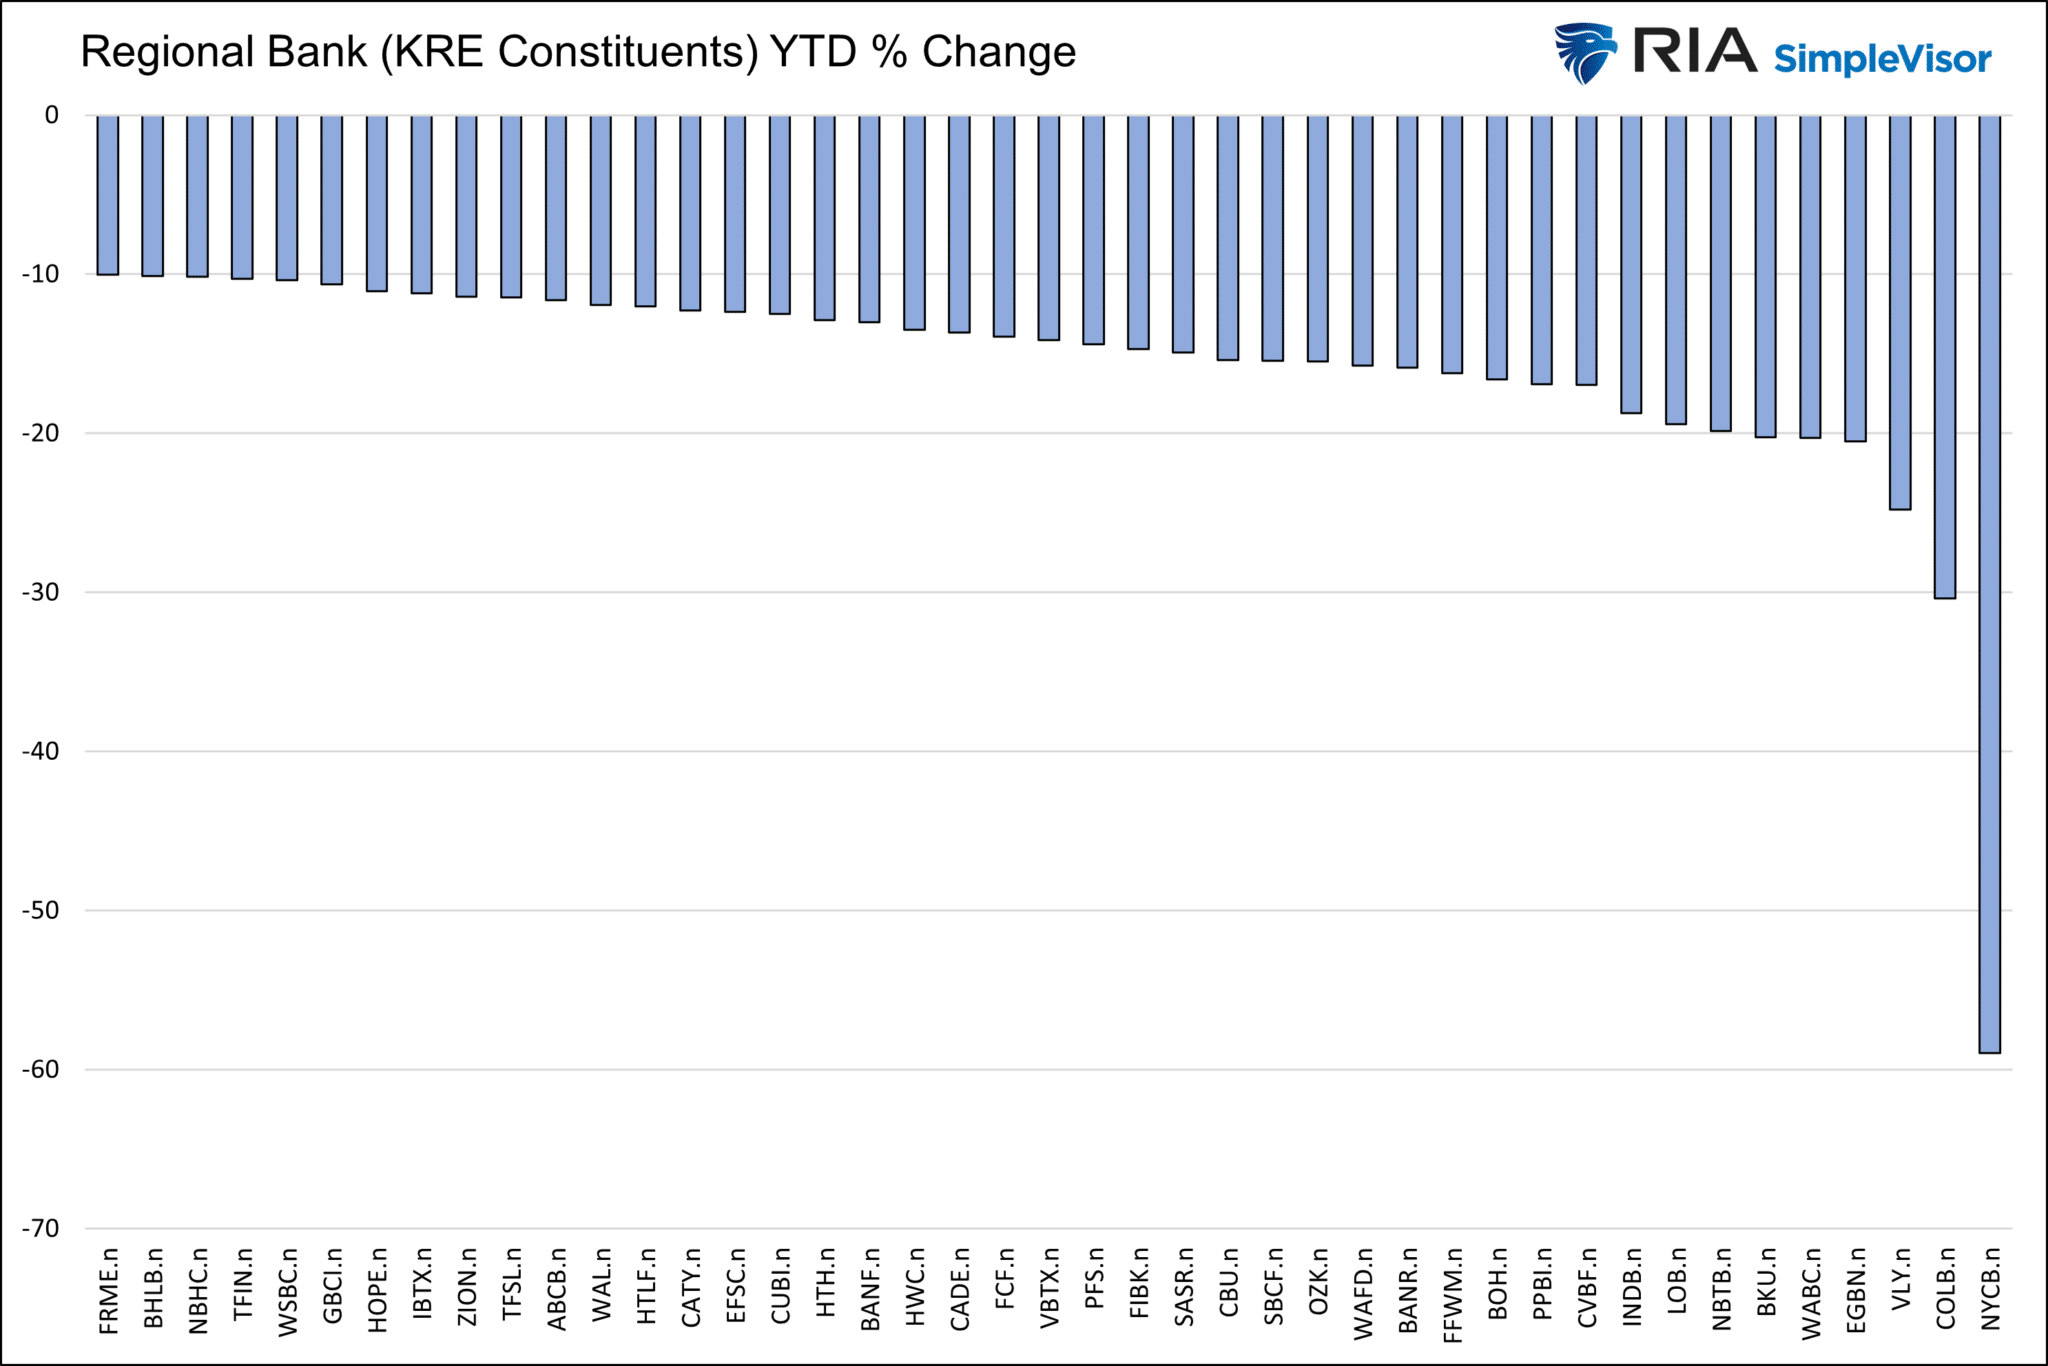
Late Tuesday night, Moody’s downgraded NYCB’s credit rating to BB, putting it in junk bond status. The action occurred after NYCB stock had fallen 60% year to date. The lesson from 2008 and, more recently, in March 2023 is that stock investors can seal the fate of a bank. Panic selling by stock investors crushes stocks, as we are witnessing with NYCB. Lower share prices further raise concerns among bond investors, increasing borrowing costs significantly. At the same time, depositors withdraw money, forcing a bank to raise capital when it is expensive and hard to come by. Most importantly, other banks fear lending to the bank. The bank then must go to the Fed, the lender of last resort. Another consideration is contagion.
Last March, many regional bank stocks were struggling mightily in the wake of the Silicon Valley Bank and Signature Bank defaults. At the time, deposits were fleeing the banks, forcing underwater loans and asset losses to be recognized. To stem the problem, the Fed introduced the BTFP funding facility. The program calmed investors’ nerves. However, the BTFP ends on March 11. Given what is occurring with NYCB and the potential problems facing other regional banks, we suspect there is a decent likelihood that, barring a new Fed program, regional bank stocks will stay under pressure. The table below shows the year-to-date losses of the worst-performing stocks within the KRE Regional Bank ETF.
What To Watch Today
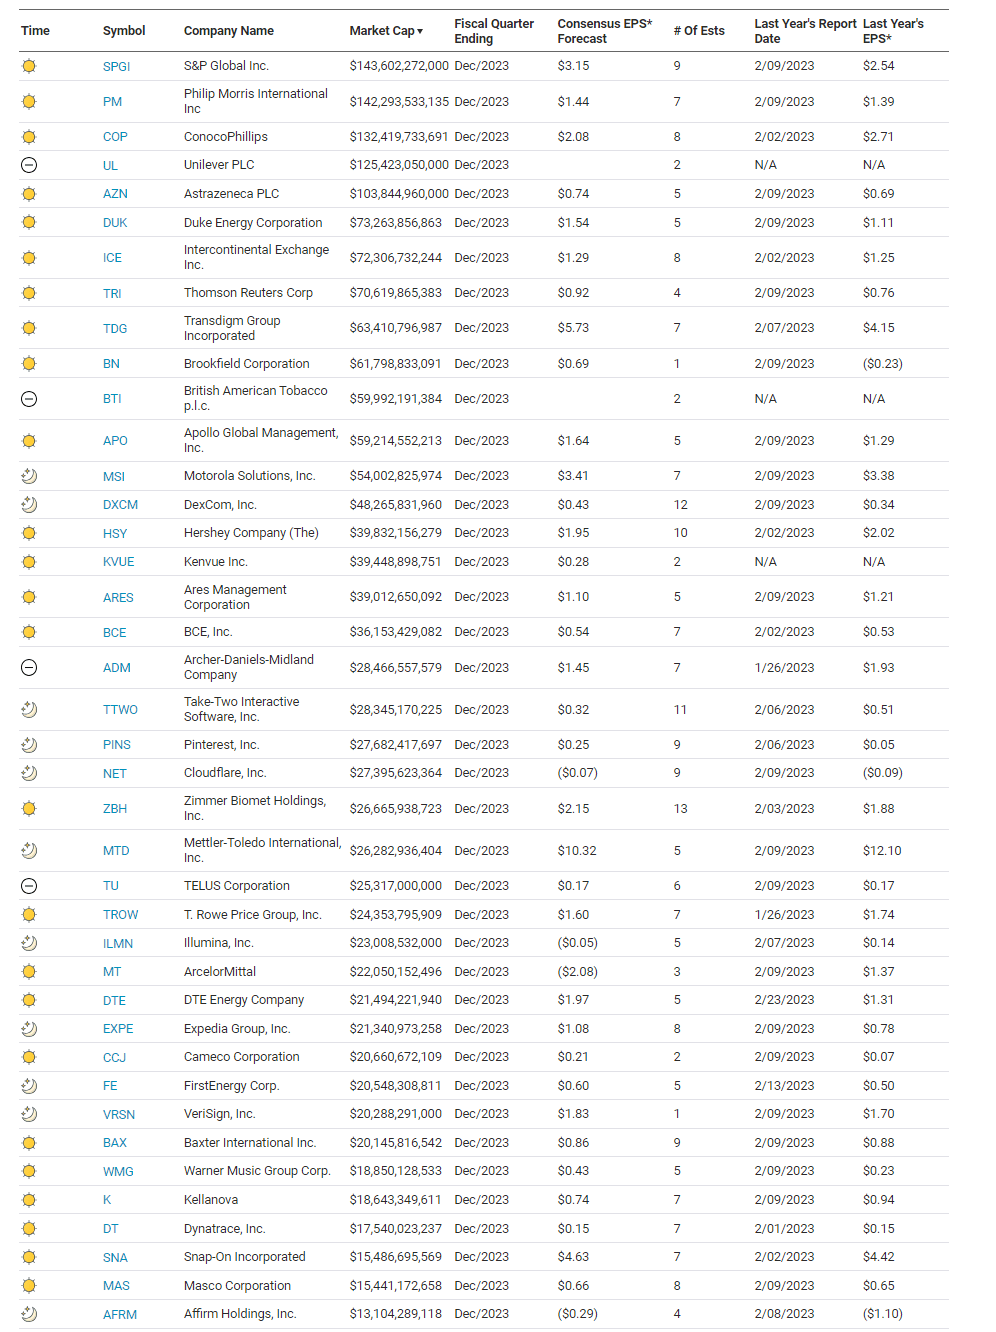
Earnings
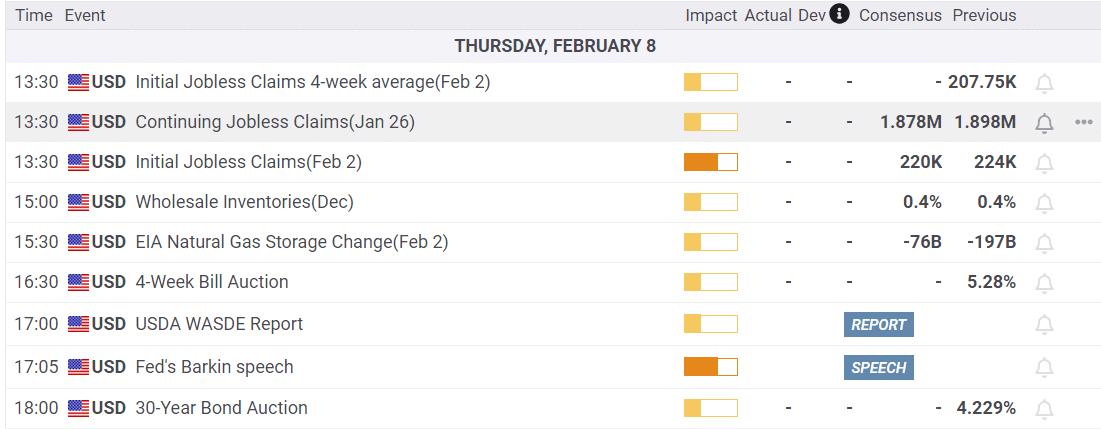
Economy
Market Trading Update
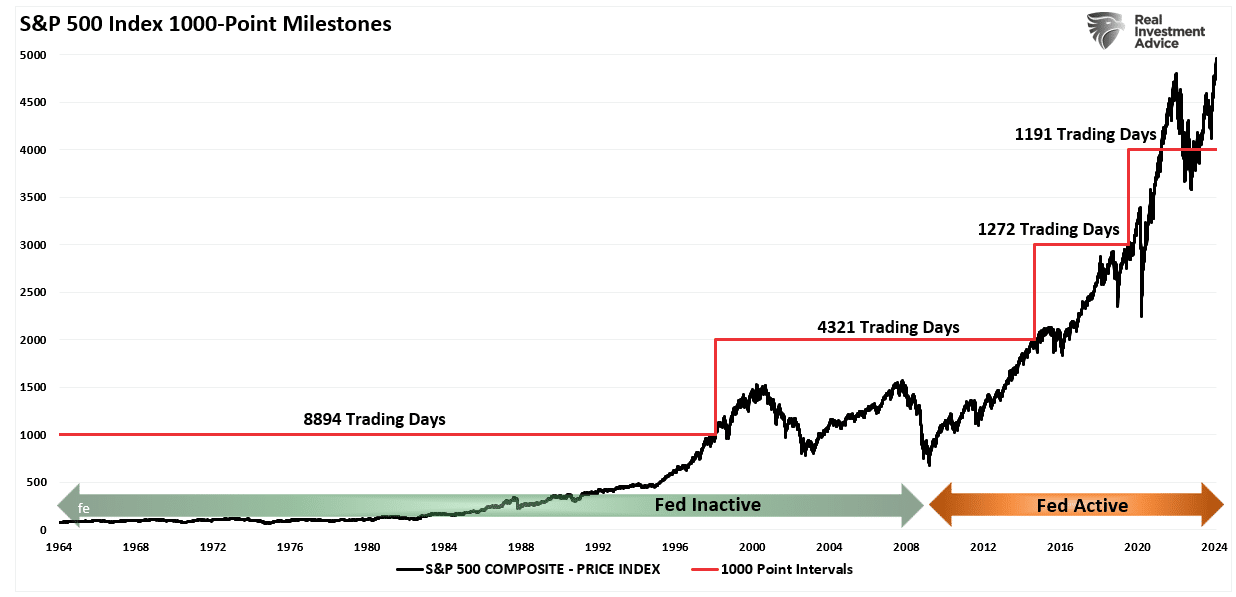
CLOSE. but no cigar. On Tuesday, we discussed the market reaching the psychological round number of 5000. Yesterday, the market closed at 4995.06 and almost touched 5000 intraday. As we noted in that article:
Nonetheless, with the market surging higher since the beginning of the year, bullish investors are drooling over the next significant milestone for the market – S&P Index 5000. These milestones have a gravitational pull as investors become fixated on them. Interestingly, the time to reach these milestones continues to shrink, particularly after the Federal Reserve became hyperactive with monetary policy changes.
These milestones have very little meaning other than being psychological markers or having the ability to put on an “S&P 5000” hat if you’re in the media. Nonetheless, the bullish backdrop suggests the market will likely hit that psychological level soon, if not already.
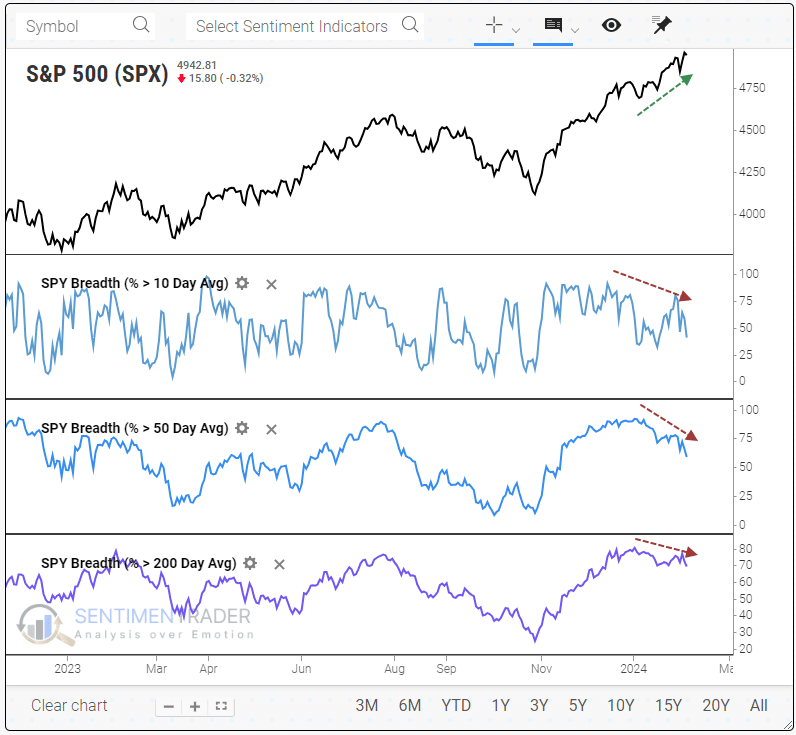
As has been the case all year, this remains a market driven by narrowing breadth. As discussed in this upcoming weekend’s newsletter, breadth has narrowed rather than expanded during this rally, suggesting that a more significant correction process will likely ensue in the weeks ahead.
“While investors’ sentiment remains bullish, it continues to be driven by a narrower participation in the market overall. Within the S&P 500, fewer and fewer stocks have been participating in its most recent gains. The percentage of stocks within the index holding above their 10-day, 50-day, and 200-day moving averages has decreased for weeks. Such declines eventually lead to corrective events in the market.”
As stated in yesterday’s commentary, a correction is coming. I don’t know when, but a 5-10% decline before the election is very likely. While the bulls are clearly in control of this market, it is worth continuing to manage your risks accordingly.

Market Breadth At Odds With Record Highs
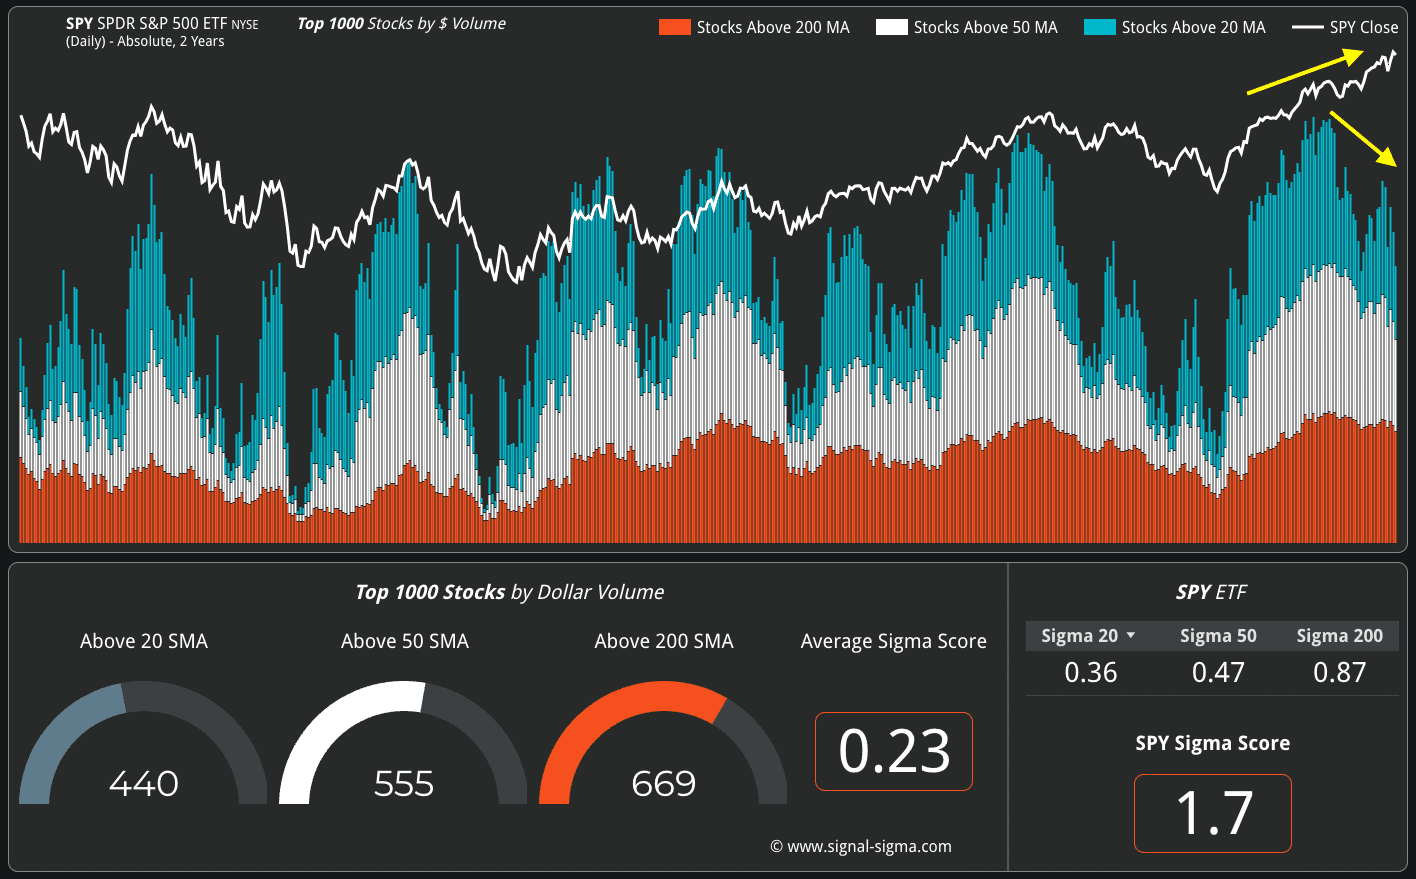
Andrei Sota shares the graph below, which shows that market breadth is weakening despite record highs. Note that prior market peaks were accompanied by peaks in the percentage of stocks above their 20, 50, and 200-day moving averages. Despite setting record highs, the number of stocks above their respective key moving averages has been falling. As we have been writing about, the fortunes of a select few stocks are driving major market indexes higher. All the while, a large number of stocks are not keeping up with the broad indexes.
To further hammer home this point, consider the following Tweet from Jason Goepfert of Sentimentrader:
Man, this is weird. The S&P 500 is within .35% of a 3-year high. Fewer than 40% of its stocks are above their 10-day avg, fewer than 60% above their 50-day, and fewer than 70% above their 200-day. Since 1928, that’s only happened once before: August 8, 1929.
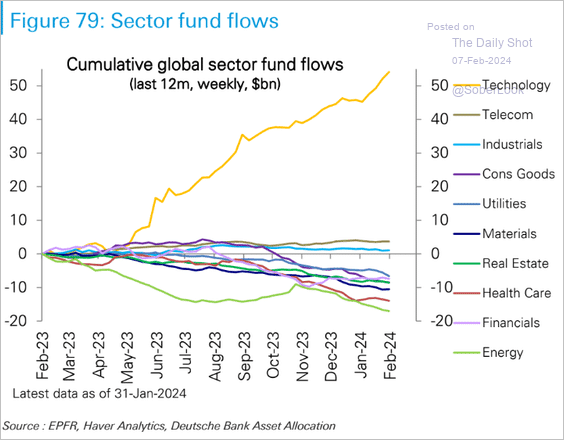
Technology or Bust
The chart below, courtesy of The Daily Shot, shows that ETF sector investors are overwhelmingly pouring money into the technology sector while, in the aggregate, pulling it out of just about every other sector. Communications and Industrials are the only two other sectors with positive fund inflows over the past year. Energy and Healthcare have seen the largest outflows.
Tweet of the Day
“Want to have better long-term success in managing your portfolio? Here are our 15-trading rules for managing market risks.”
Please subscribe to the daily commentary to receive these updates every morning before the opening bell.
If you found this blog useful, please send it to someone else, share it on social media, or contact us to set up a meeting.
Also Read


