Index Review For 2023


Inside This Week’s Bull Bear Report
- Index Review For 2023
- How We Are Trading It
- Research Report – Sell Cash And Buy Stocks?
- Youtube – Before The Bell
- Market Statistics
- Stock Screens
- Portfolio Trades This Week
Administrative Note:
There will be NO NEWSLETTER next weekend (December 30th) as I am on vacation with my family for the New Year.
However, I do want to take this opportunity to wish you and your loved ones a VERY Merry Christmas. While that sentiment may be considered politically incorrect in today’s world, I hope that the spirit of Christmas fills you and your family with happiness, hope, and love.
As we wrap up 2023, such will mark our 23rd year of publishing this weekly newsletter. Watching it grow from a few readers into a global audience has been amazing. Over the years, we have reported on bull markets, crushing bear markets, financial crises, economic events, and policy changes.
It has been a privilege, or rather an honor, to continue to share my thoughts with you over all these years. I hope you have found it informative and helpful. As we enter 2024, I remain hopeful we can continue to share our thoughts for another 20 years.
Thank you so much for your loyal readership. It has been a true gift.
“May the peace and joy that Christmas brings always be with you all year long.”
Market Review And Update
Last week, we noted that:
“The FOMC pivot sent stocks soaring and bond yields lower, as the message was more dovish than even the bulls expected. Notably, as measured by the volatility index, any bearishness was crushed.”
However, with the market overbought, we suggested the upside gains would be somewhat limited, and consolidation, or correction in price, was needed before the market attempted all-time highs. Such was the case last week, as a sharp selloff in the market on Wednesday was followed by two days of gains, keeping the market in a relatively tight trading range.
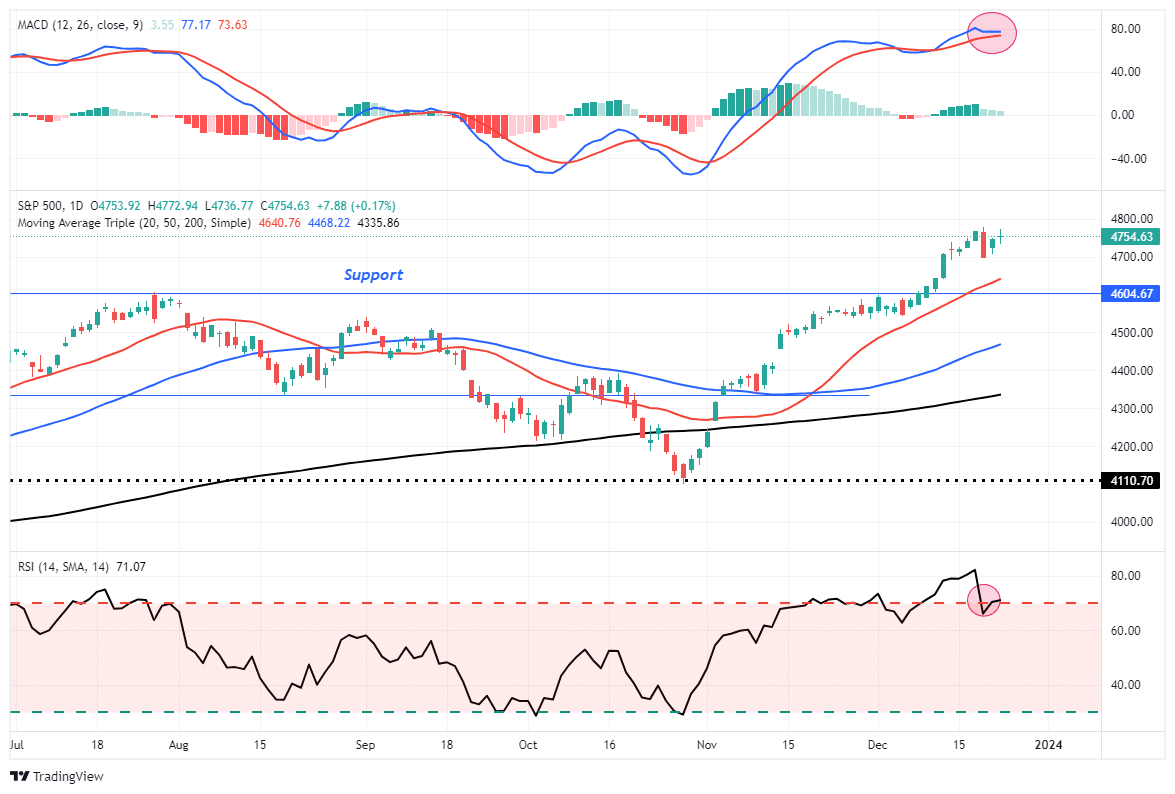
While the price action this past week reduced some of the overbought conditions, as represented by the Relative Strength Index (RSI), more work is still ahead. Next week, the “Santa Claus Rally” will officially begin, lasting through the first two days of January. Given the overbought condition, further upside may remain limited.
While we continue to maintain our equity market exposure currently, we suggest using the current market to rebalance portfolio risks as needed as we head into 2024. Taking profits, tax loss selling laggards, and raising a bit of cash never leads to a poor outcome. The market will provide a better opportunity on a risk/reward basis in the next few weeks. However, patience is required.
As we wrap up 2023, this is an excellent time to review some factors that drove the markets this year.
Investing Summit: Early Bird Registration Available Now
January 27th, we are hosting a live event featuring Greg Valliere to discuss investing in the 2024 presidential election. What will a new president mean for the markets, the risks, and where to invest through it all? Greg will be joined by Lance Roberts, Michael Lebowitz, and Adam Taggart for morning presentations covering everything you need to know for the New Year.
Register now, as there are only 150 seats. The session is a LIVE EVENT, and no recordings will be provided.

Index Review For 2023
As we head into the last few trading days of the year, I thought this would be an opportunity to review various index returns on a year-to-date basis. While headlines will boast the returns of the S&P 500 and the Nasdaq as year-end numbers come to fruition, the reality of returns for most investors will likely be far different.
An excellent place to start is the S&P 500 index, which has had a stellar return this year, printing a nearly 25% total return. However, as discussed recently, the headline return is probably not what you saw in your portfolio.
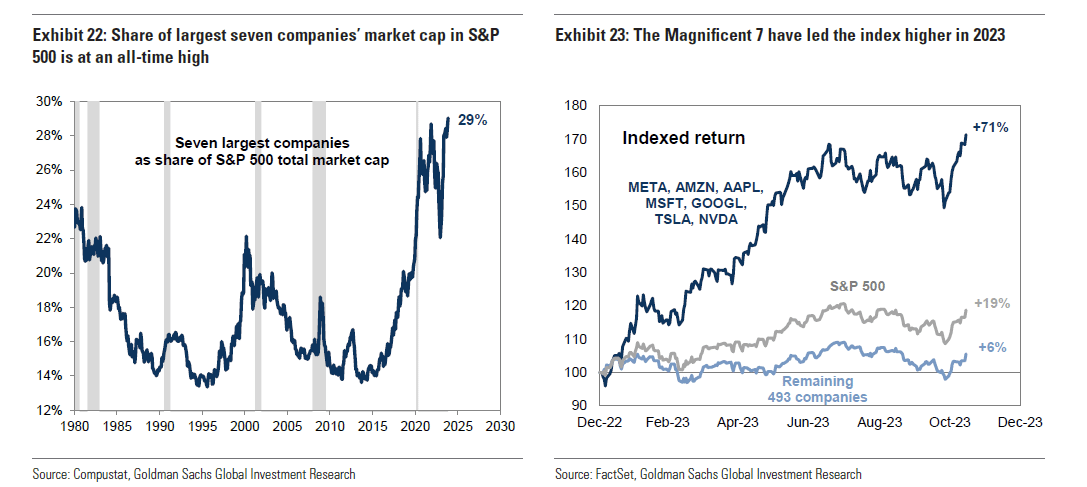
“The majority of the gain in the market this year has come from essentially seven stocks with the largest concentration in the index in terms of market capitalization.”
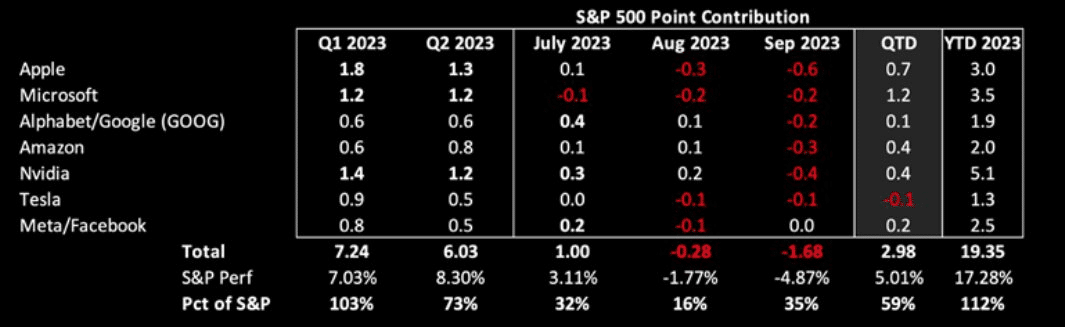
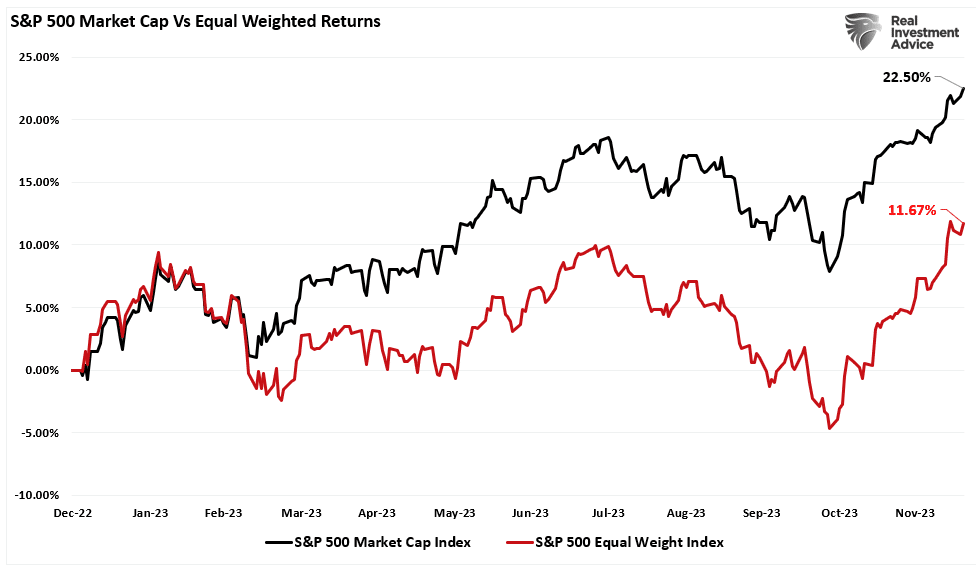
The surge in those stocks has skewed the performance of the broad market index. The performance of the bottom 493 stocks remains markedly different.
Since November, the rally has broadened, allowing some of the bottom 493 stocks to catch up. Still, the performance gap between the market capitalization and equal-weighted index remains enormous.
2023 was also a year the bonds underperformed, which drug the 60/40 market capitalization and equal-weighted performance lower.
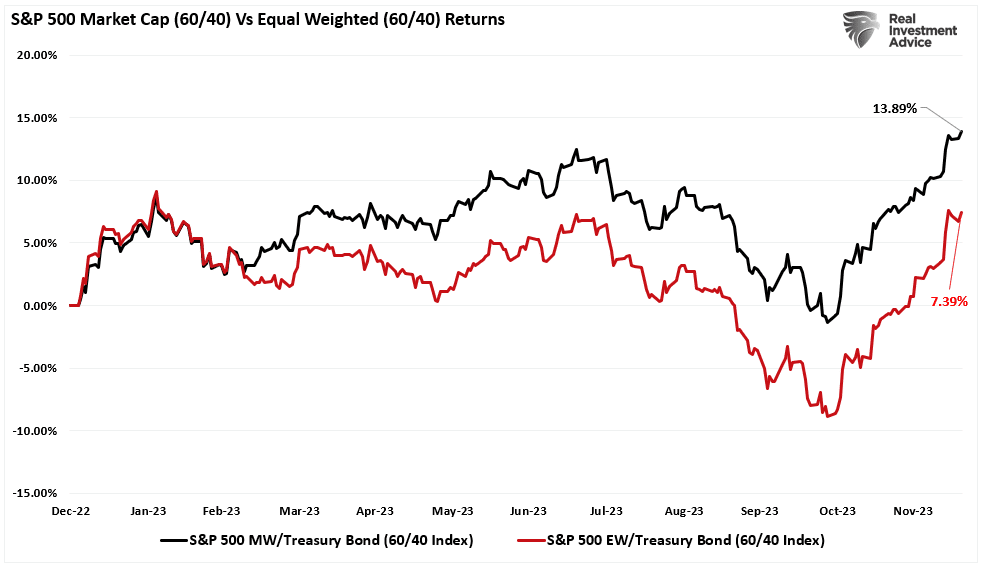
As we noted in that previous analysis:
“Why am I telling you this? Well, when the end of the year comes, and you look at your performance relative to the S&P 500 index, you will likely be disappointed.”
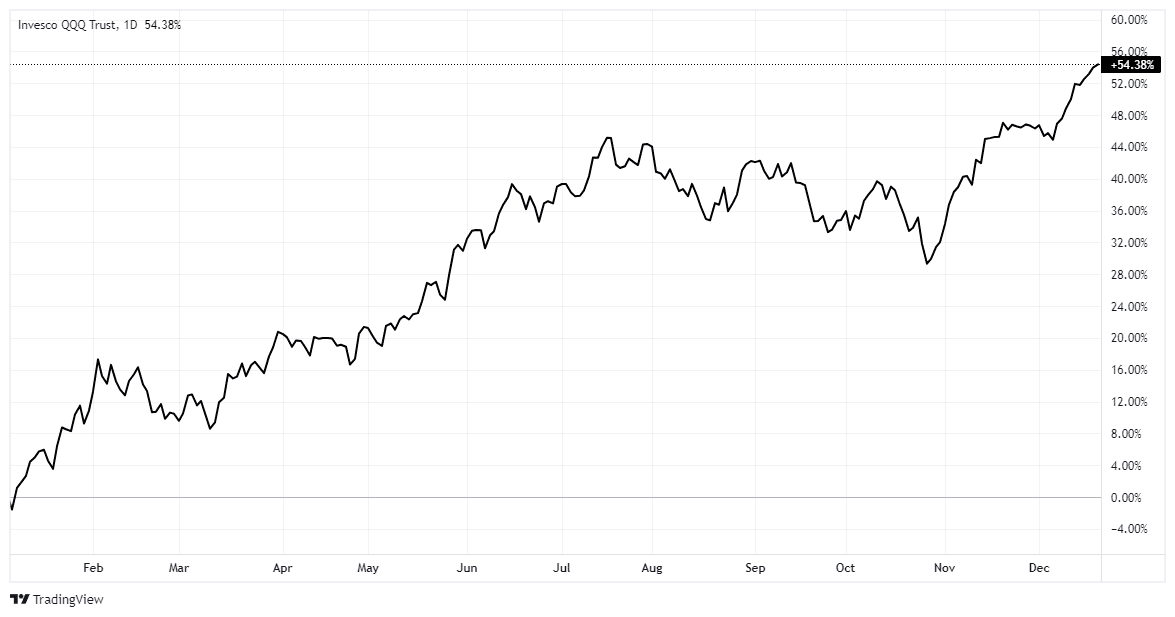
Technology Ruled The Day
Unsurprisingly, given that the “Magnificent 7” stocks comprise most of the S&P 500 and Nasdaq 100 index in terms of market capitalization weightings, the Nasdaq index had a monster year in 2023. The year-to-date return for the Nasdaq index is more than 54% since the beginning of the year.
Notably, the most beaten-up technology stocks from 2022, as represented by Cathy Woods’ ARKK ETF, have surged nearly 57% since the beginning of November as investors chased the market into year-end.
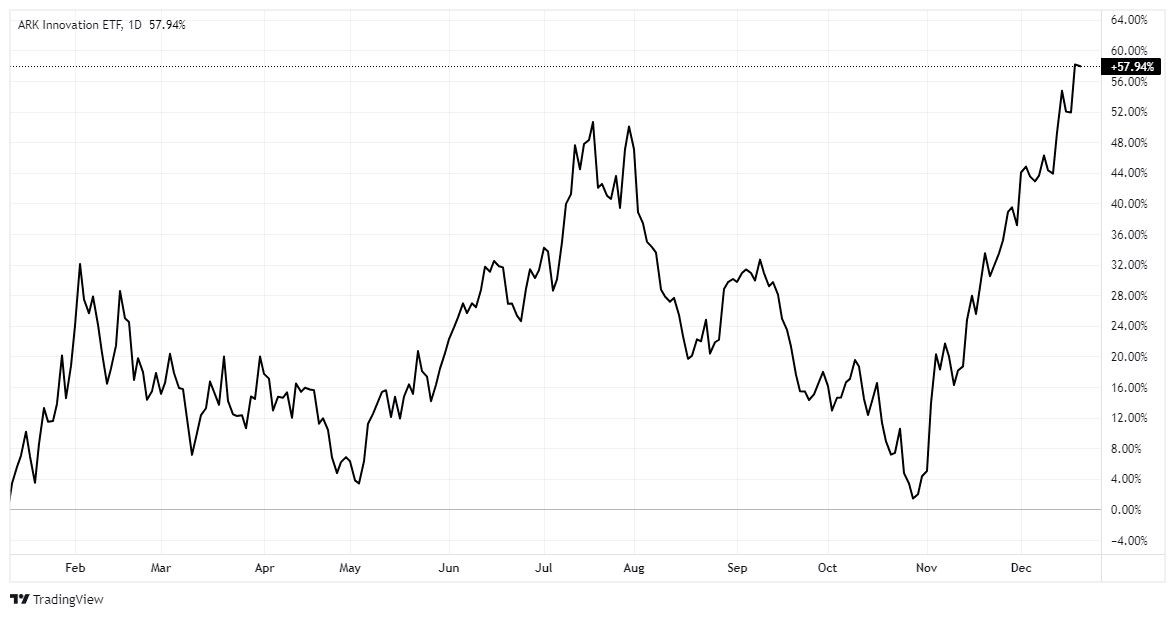
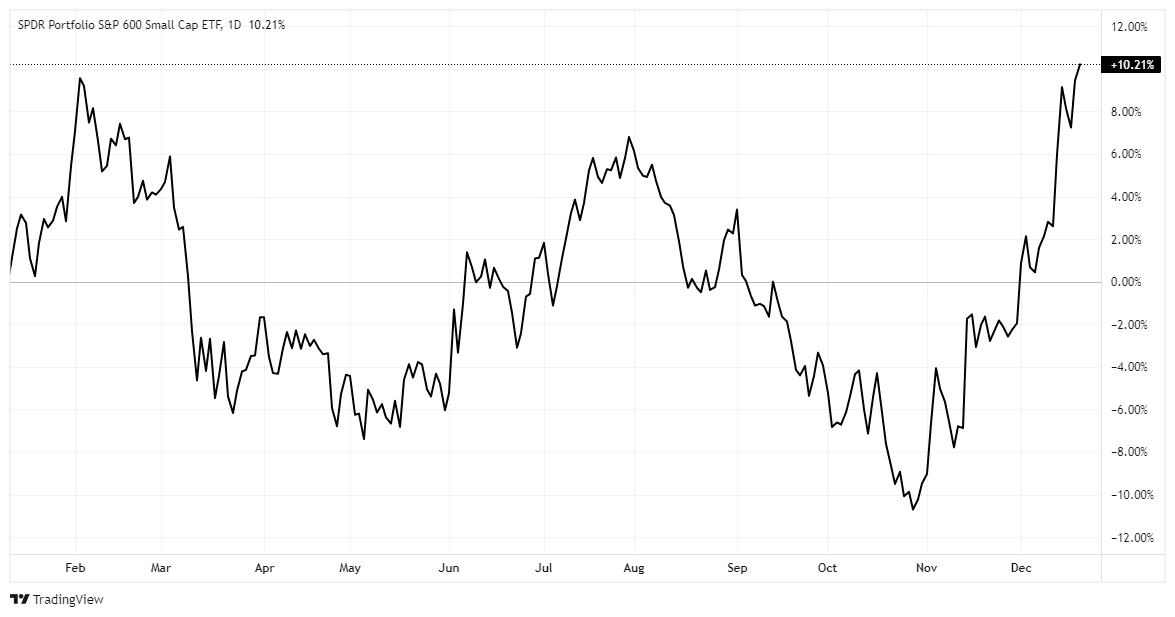
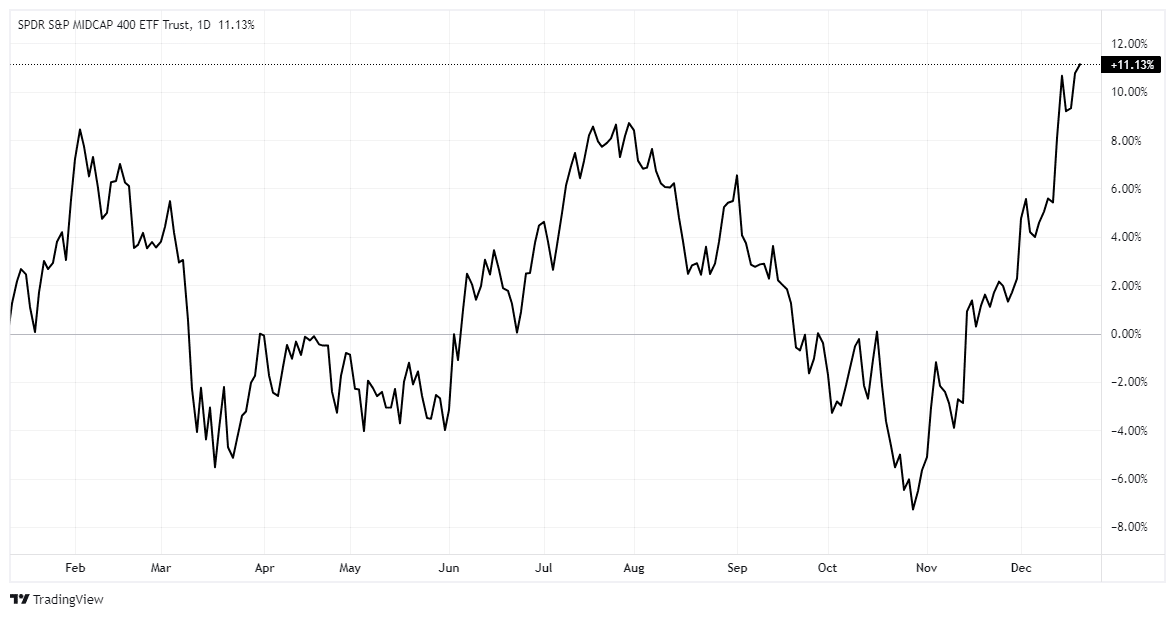
That surge in some of the most shorted and fundamentally weak technology stocks came with the realization that disinflation is becoming a more significant threat than inflation. Furthermore, with the reversal of the Federal Reserve into a more “accommodative” stance on inflation and monetary policy, the sectors that benefit the most from disinflation and lower rates have surged sharply since the beginning of November, like small and mid-capitalization indexes.
Bonds & The Dollar
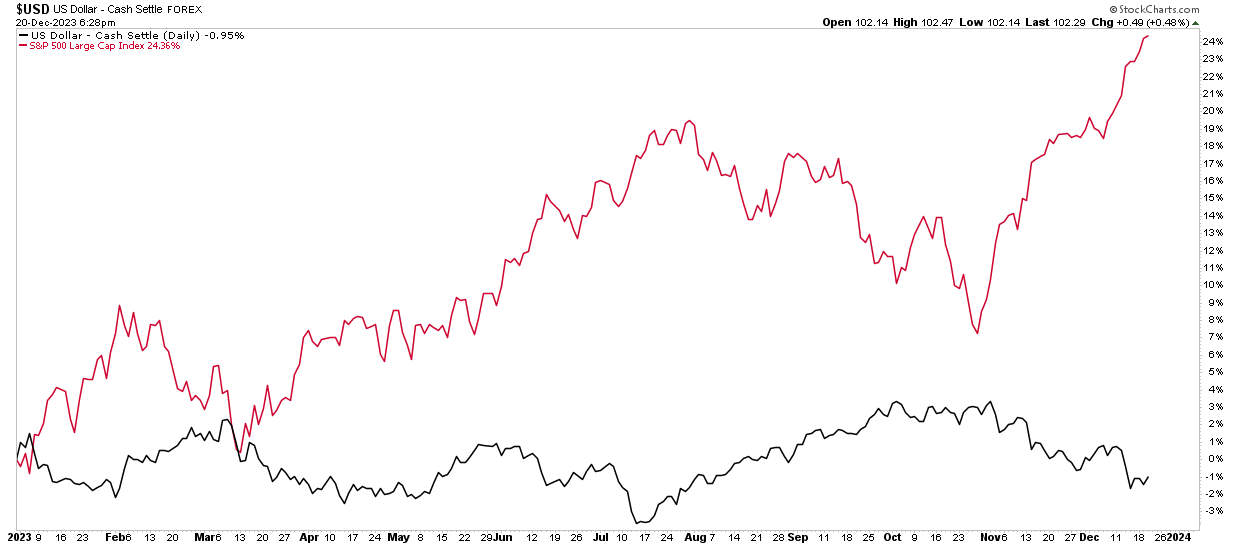
One of the big contributors to the stock market rally since November, besides the 180-degree flip by the Federal Reserve, is the dollar’s decline. The dollar rallied sharply during the summer, undermining the stock market from August through October. However, at the beginning of November, that changed as the Fed pivoted on its policy stance, and stocks caught fire. Since then, the dollar has declined rather sharply as stocks rallied. A reversal of dollar weakness should be expected, with the dollar very oversold, likely contributing to a much-needed market reset in early 2024.
Likewise, the bond rally has also been bolstered by the decline in the dollar. As with the stock market, we should expect a short-term reversal of rates during a dollar rally, which will likely reignite inflationary fears in the markets. Given the market’s belief that the Federal Reserve will soon be in a rate-cutting mode, any short-term inflationary concerns could push out those rate-cut odds, weighing on stock market performance.
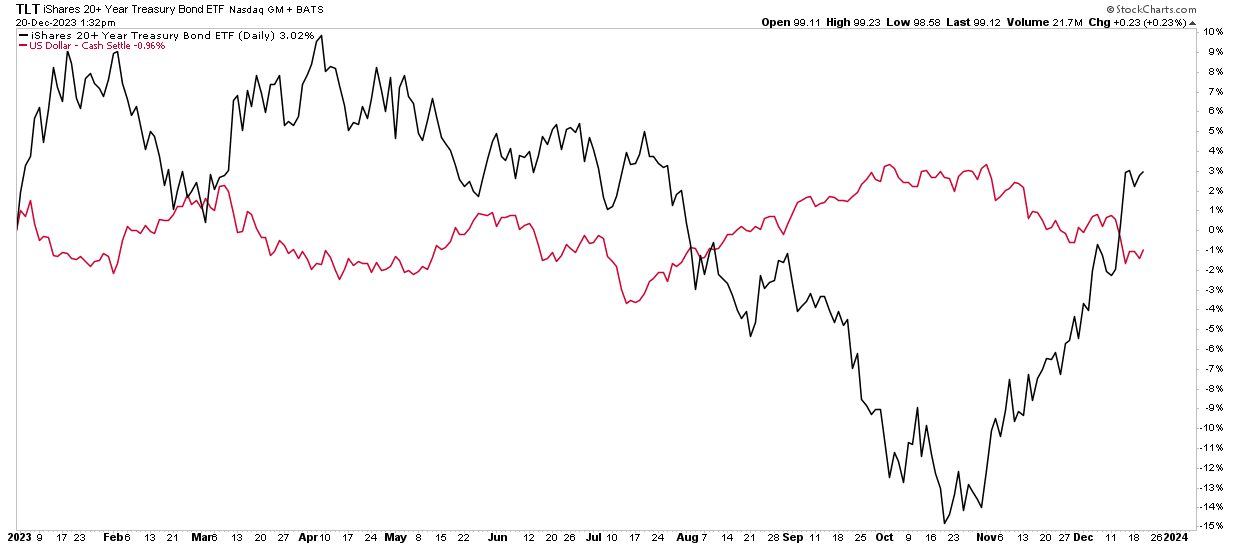
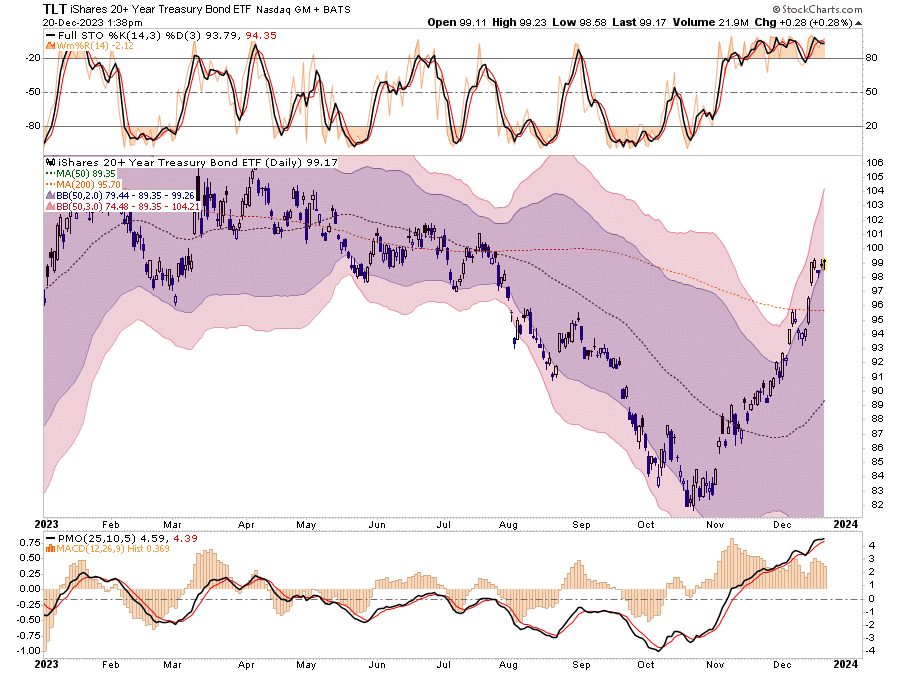
However, with that said, any near-term rate reversal to relieve the current more overbought extreme would provide an entry point to increase bond exposure in 2024. As the economy slows down, there is still a significant amount of upside in the bond trade, mainly if a “soft landing” scenario becomes more challenging. (Interest rates are inverse to bond prices)
Will Laggards Become Next Year’s Leaders
As we head into 2024, the big question is where to place my bets. Will market capitalization-weighted indexes lead the way again, or will we see a rotation to something else? At the beginning of 2023, no one thought the market would end on such a high note, with Technology pacing the gains. In October 2022, the FANG stocks were believed to be dead.
The honest answer is that we don’t know with any certainty.
However, we can make some educated guesses based on the thesis that the economy will slow due to more restrictive monetary policy and a continued reversal of monetary liquidity. A slower economic environment will contribute to a slower inflation growth pace, manifesting in a lower yield environment. In such an environment of disinflation and lower yields, earnings growth will become more challenging for many market areas. Therefore, we would expect that:
- Technology (primarily the mega-caps with the most earnings power) will continue to track inflows in a disinflationary environment.)
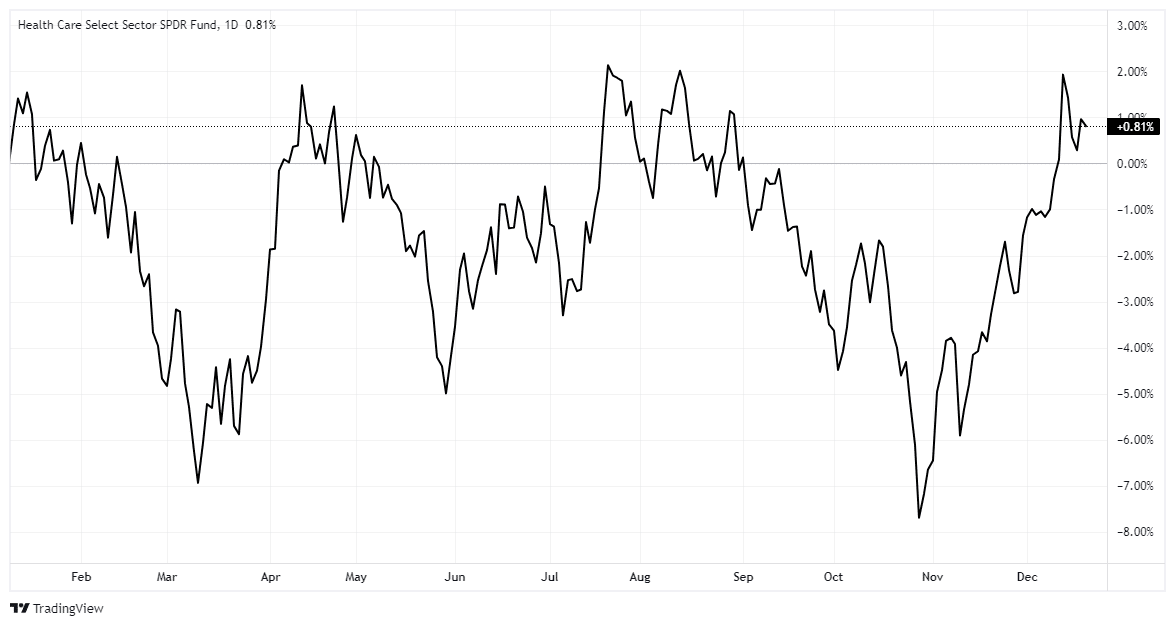
- Healthcare, which has significantly underperformed in 2023, could gain momentum based on a rotation to higher dividends and stable earnings.
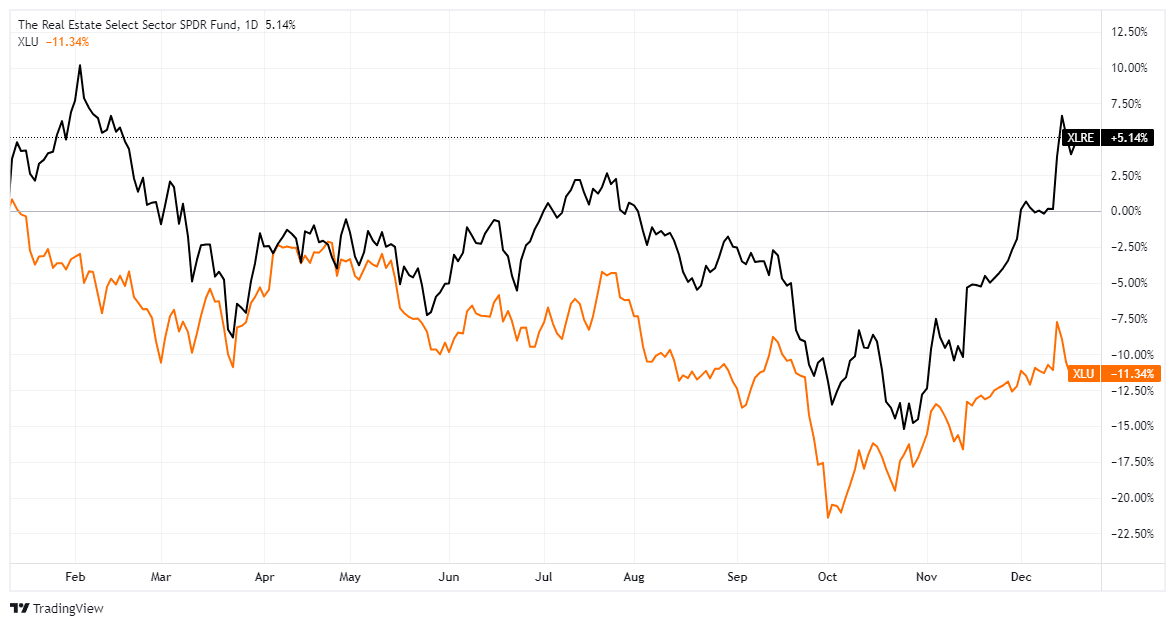
- Real Estate and Utilities, also significant underperformers in 2023, should theoretically perform better in a lower-yield environment. Given these sectors should provide higher yields than bonds in 2024, such should attract some inflows. However, with that said, many challenges still face the Real Estate sector that could drag on performance, so caution is advised.
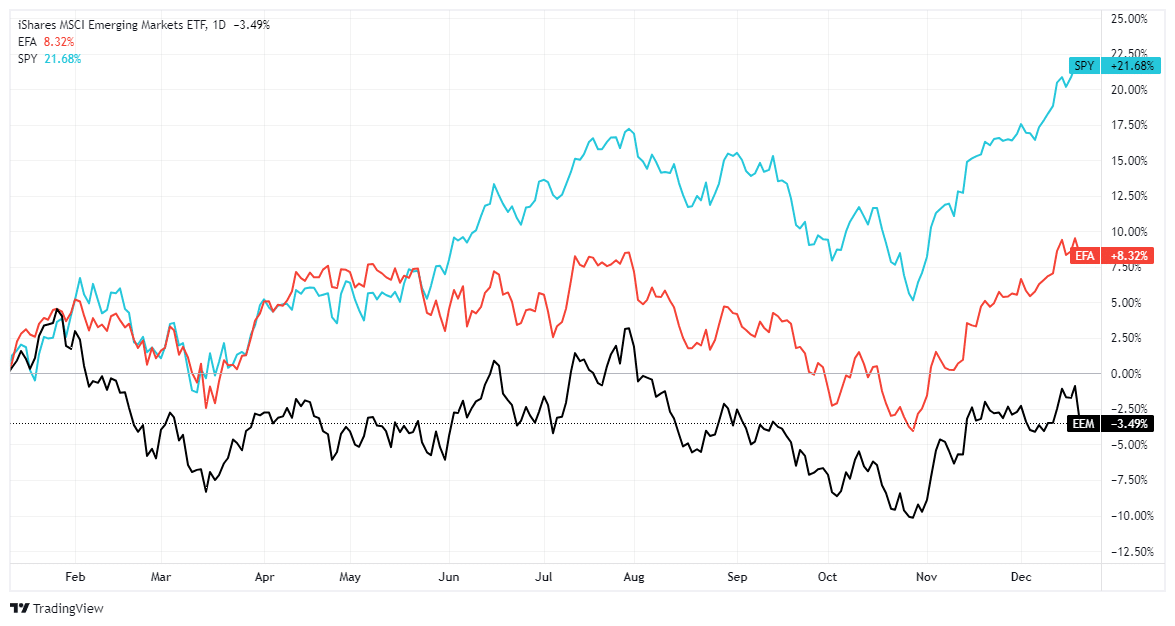
- Another area that has yet to prove itself is the Emerging and Developed Internal Indexes. There has been a perennial hope that these markets would significantly begin to outperform the United States; however, that has yet to be the case. Those two markets underperformed the S&P 500 considerably in 2023.
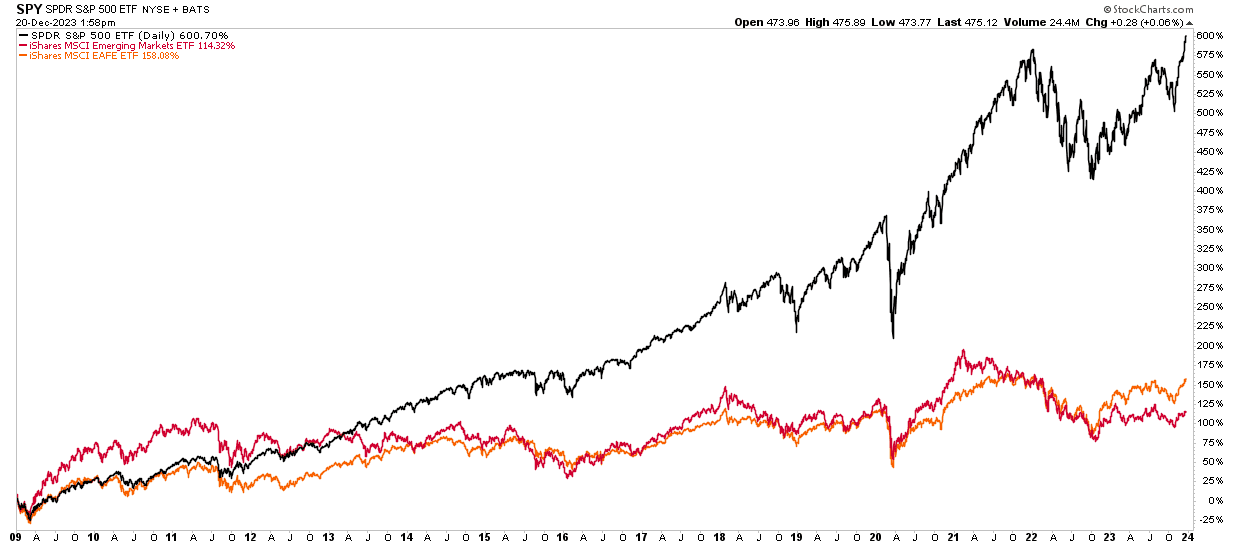
However, that underperformance has been a consistent companion since the Financial Crisis. Had you followed the advice of much of Wall Street suggesting that those markets were the place to hold your capital, the penalty was substantial.
Heading into 2024, it is likely that we will continue to see a rotation of capital into domestic markets over international markets as Federal Reserve policy shifts to a more accommodating stance. Furthermore, we should focus on stocks with the largest weightings in most ETFs as they will continue to collect most of the flow of funds into passive indexes.
Those dynamics are unlikely to change in 2024.
Very Little Visibility
The considerable risk to any outlook for 2024 is what happens with Federal Reserve policy, interest rates, inflation, and, importantly, the avoidance or impact of a recession.
Many conflicting indicators suggest a recession is possible and likely as we move forward. Other indicators suggest the opposite. What turns out to be true is a coin flip at best.
In such an uncertain environment, making a firm commitment is difficult. We must adhere to our portfolio management discipline and investment rules. As the market dynamics change, for better or worse, we must be willing to adapt and change accordingly.
As we wrap up 2023 and investors anxiously await their year-end performance reports, taking stock of what happened in the markets is essential. The performance differential between your portfolio and the markets will likely be substantial for most. Such is particularly the case if you own a well-diversified and balanced portfolio.
However, this is where most investors will make a critical mistake.
Wall Street Wants You To Compare
Comparison is the root cause of more unhappiness than anything else. Perhaps it is inevitable that human beings, as social animals, have an urge to compare themselves with one another. Maybe it is because we are all terminally insecure in some cosmic sense.
Let me give you an example I discussed with Adam Taggart at Thoughtful Money last week.
Assume your boss gave you a new Mercedes as a yearly bonus. You would be thrilled until you learned everyone in the office got two. Now, you are upset because you got less than everyone else on a “relative” basis. However, are you deprived on an absolute basis of getting a Mercedes?
Comparison-created unhappiness and insecurity are pervasive. Social media is full of images of people showing off their lavish lifestyles, giving you something to compare to. No wonder social media users are terminally unhappy.
The flaw of human nature is that whatever we have is enough until we see someone else who has more.
Comparison in financial markets can lead to awful decisions. For example, investors have trouble being patient and letting whatever process they have work for them.
For example, you should be pleased if you made 12% on your investments but only needed 6%. However, you feel disappointed when you find out everyone else made 14%. But why? Does it make any difference?
Here is an ugly truth. Comparison-related unhappiness is for Wall Street’s benefit.
The financial services industry is predicated on upsetting people so that they will move money around in a frenzy. Money in motion creates fees and commissions. The creation of more and more benchmarks, products, and style boxes is nothing more than the creation of more things to COMPARE with. The result is investors remain in a perpetual state of outrage.
The lesson we want to drive home here is the danger of following Wall Street’s advice of beating some arbitrary index from one year to the next. What most investors are taught to do is to measure portfolio performance over a twelve-month period. However, that is the worst thing you can do. It is the same as being on a diet and weighing yourself every day.
If you could see the whole future before you, making an investment decision knowing your eventual outcome would be effortless. However, we don’t have that luxury. Instead, Wall Street suggests that if your fund manager lags in one year, you should move your money elsewhere. This forces you to chase performance, creating fees and commissions for Wall Street.
We chase performance because we all suffer from the 7th deadly sin – Greed.
Most of us want all of the rewards without regard for the consequences. However, instead, we should learn to “love what is enough. “
In a year like 2023, where primarily seven companies drove the S&P 500 index, many individuals, thinking they “missed out,” will want to change their strategy for next year.
As is often the case, such will likely be a mistake.
How We Are Trading It
Remember, our job as investors is pretty simple – protect our investment capital from short-term destruction so we can play the long-term investment game. Here are our thoughts on this.
- Capital preservation is always the primary objective. If you lose your capital, you are out of the game.
- Seek a rate of return sufficient to keep pace with the inflation rate. Don’t focus on beating the market.
- Keep expectations based on realistic objectives. (The market does not compound at 8%, 6% or 4%)
- Higher rates of return require an exponential increase in the underlying risk profile. This tends to never work out well.
- You can replace lost capital – but you can’t replace lost time. Time is a precious commodity that you cannot afford to waste.
- Portfolios are time-frame specific. If you have a 5-year retirement horizon but build a portfolio with a 20-year time horizon (taking on more risk), the results will likely be disastrous.
As discussed here, there is a wide range of potential outcomes based on valuations in 2024. No one knows with any certainty what next year will hold. However, by focusing on risk controls and the technical underpinnings, we can safely navigate the waters to safety.
We are certainly anxiously anticipating the arrival of “Santa Claus.” However, we remain keenly aware of the lessons taught to us in 2018 and 2020 that nothing is guaranteed.
Have a great week.
Research Report

Subscribe To “Before The Bell” For Daily Trading Updates
We have set up a separate channel JUST for our short daily market updates. Please subscribe to THIS CHANNEL to receive daily notifications before the market opens.
Click Here And Then Click The SUBSCRIBE Button
Subscribe To Our YouTube Channel To Get Notified Of All Our Videos
Bull Bear Report Market Statistics & Screens

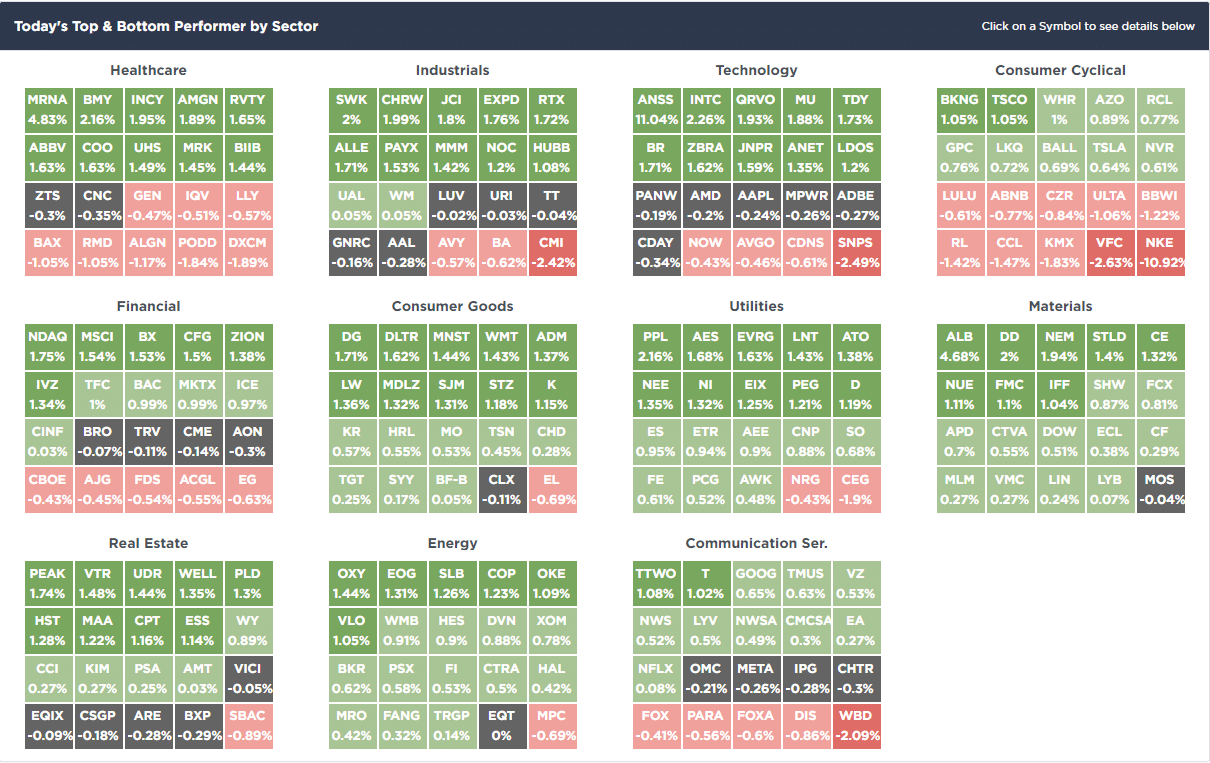
SimpleVisor Top & Bottom Performers By Sector
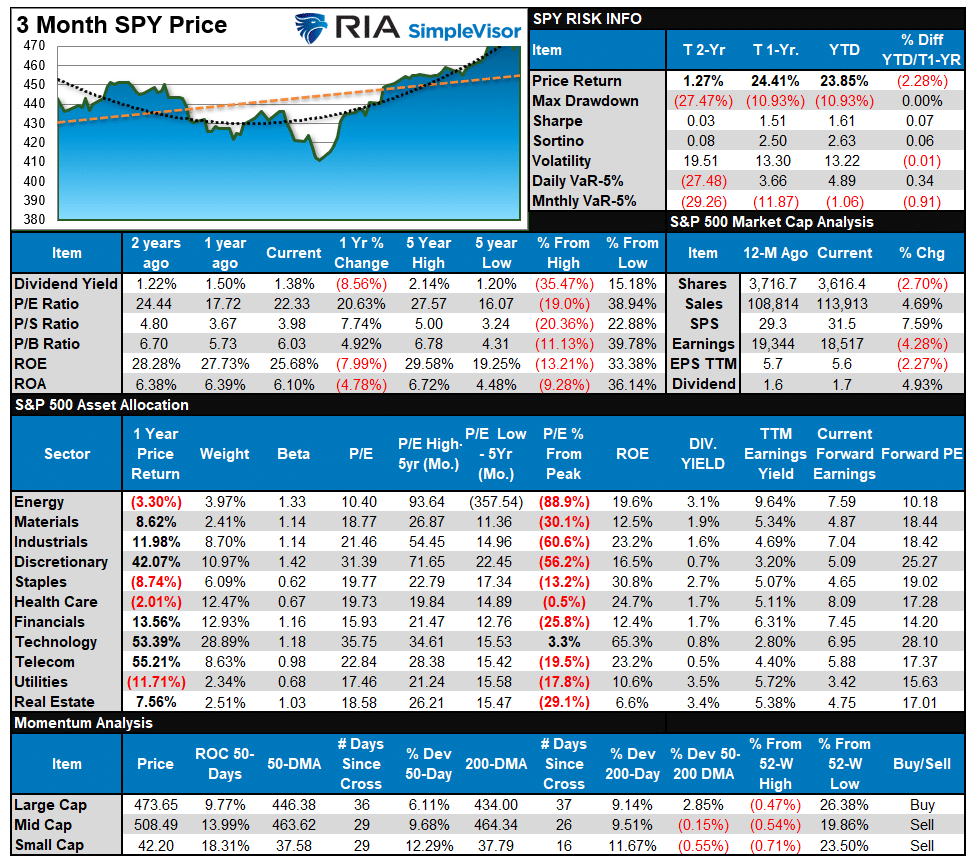
S&P 500 Weekly Tear Sheet
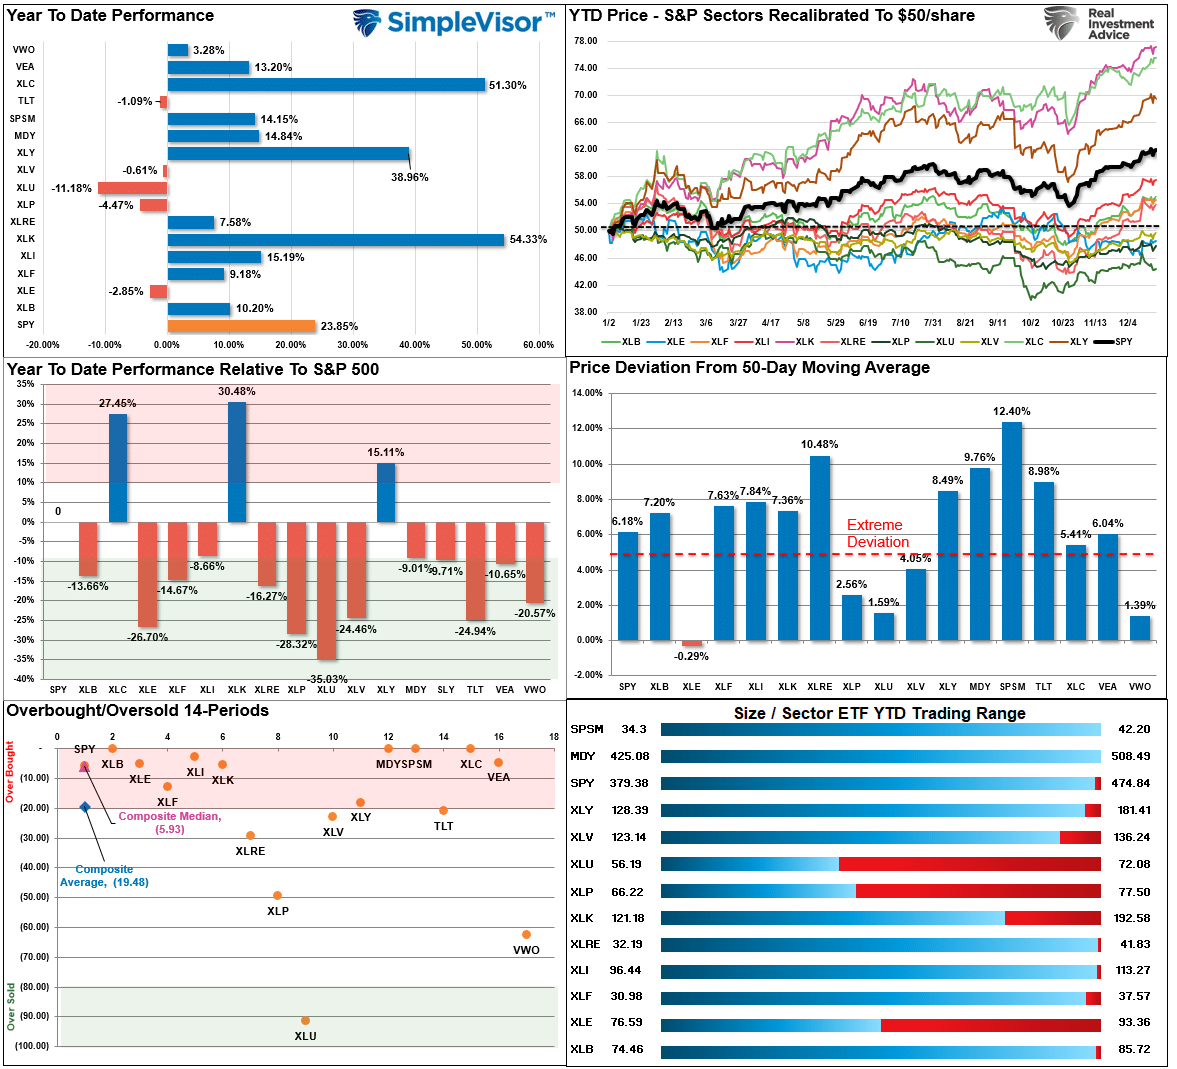
Relative Performance Analysis
Most markets continue to trade at more extreme deviations from a historical basis on both an absolute and relative basis. Such is particularly the issue with the current deviations from the 50-DMA, which is unsustainable. While this remains an “unstoppable bull market” momentarily, something will change as we enter the New Year, leading to a short-term market reversion to work off these excesses. Such is the nature of financial markets. Take profits and rebalance portfolio risks as needed, and keep some “dry powder” available for an eventual correction that will provide a better opportunity to increase equity risk.
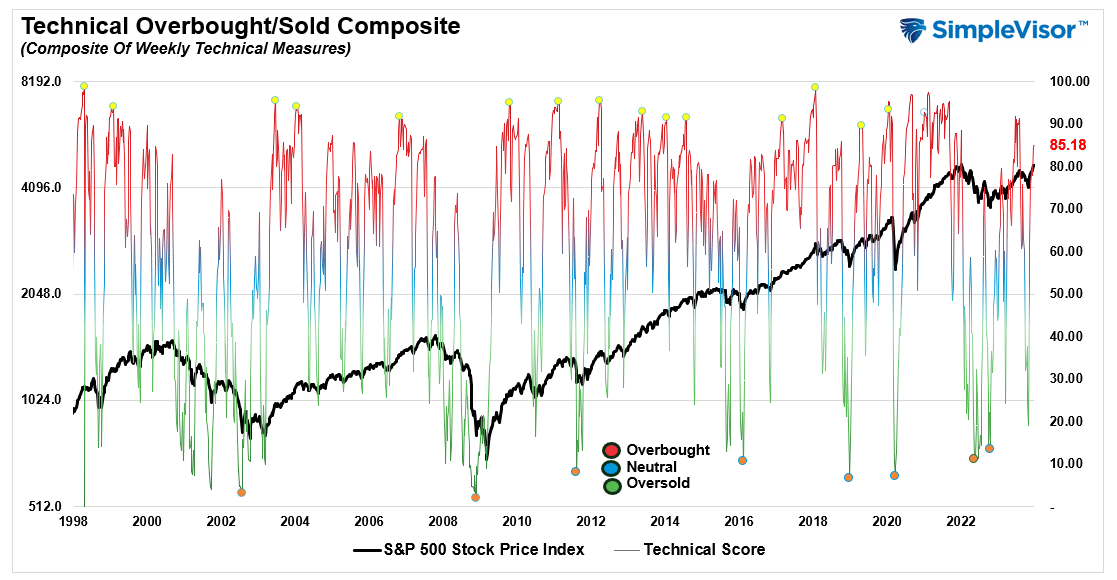
Technical Composite
The technical overbought/sold gauge comprises several price indicators (R.S.I., Williams %R, etc.), measured using “weekly” closing price data. Readings above “80” are considered overbought, and below “20” are oversold. The market peaks when those readings are 80 or above, suggesting prudent profit-taking and risk management. The best buying opportunities exist when those readings are 20 or below.
The current reading is 85.18 out of a possible 100.
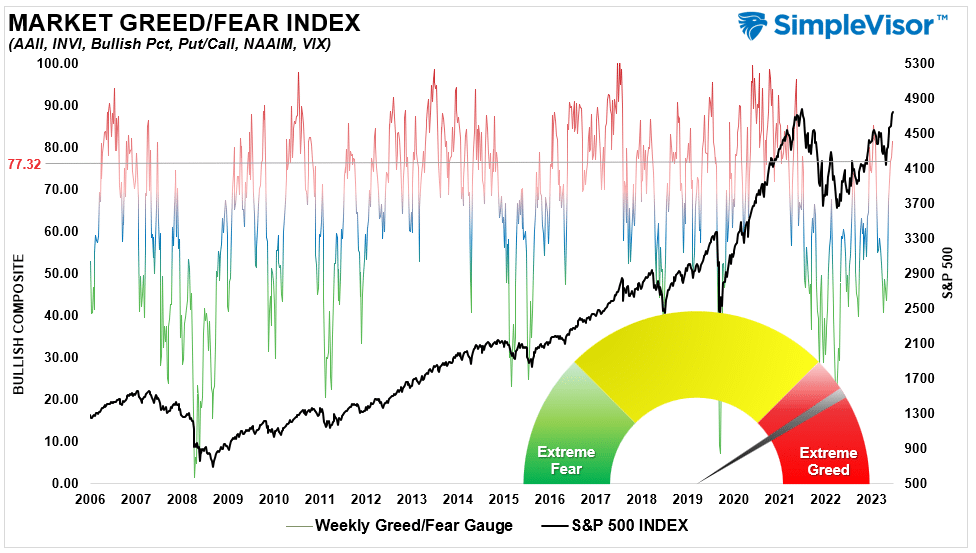
Portfolio Positioning “Fear / Greed” Gauge
The “Fear/Greed” gauge is how individual and professional investors are “positioning” themselves in the market based on their equity exposure. From a contrarian position, the higher the allocation to equities, the more likely the market is closer to a correction than not. The gauge uses weekly closing data.
NOTE: The Fear/Greed Index measures risk from 0 to 100. It is a rarity that it reaches levels above 90. The current reading is 81.25 out of a possible 100.
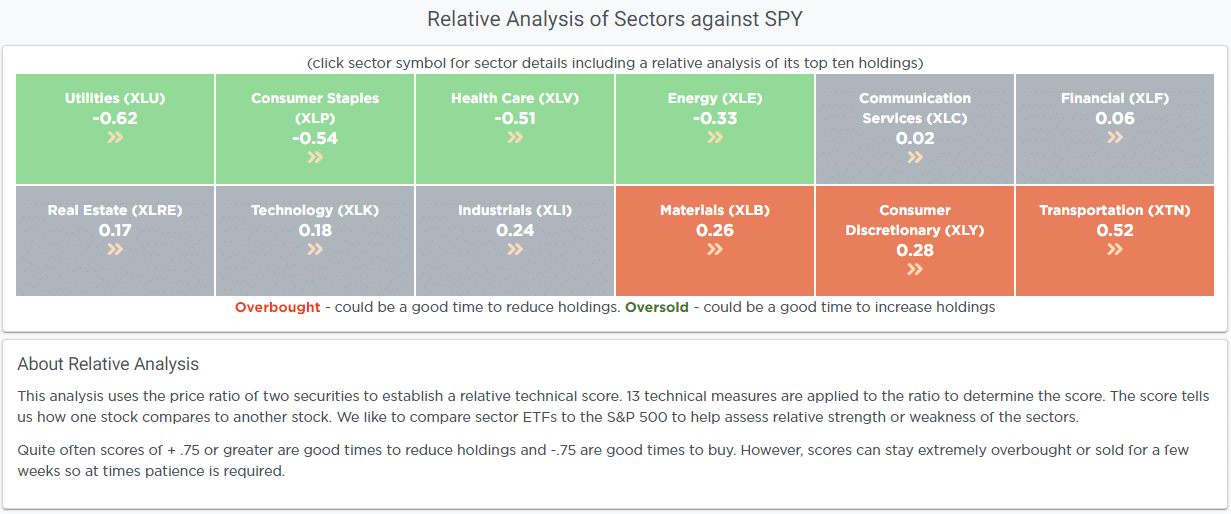
Relative Sector Analysis
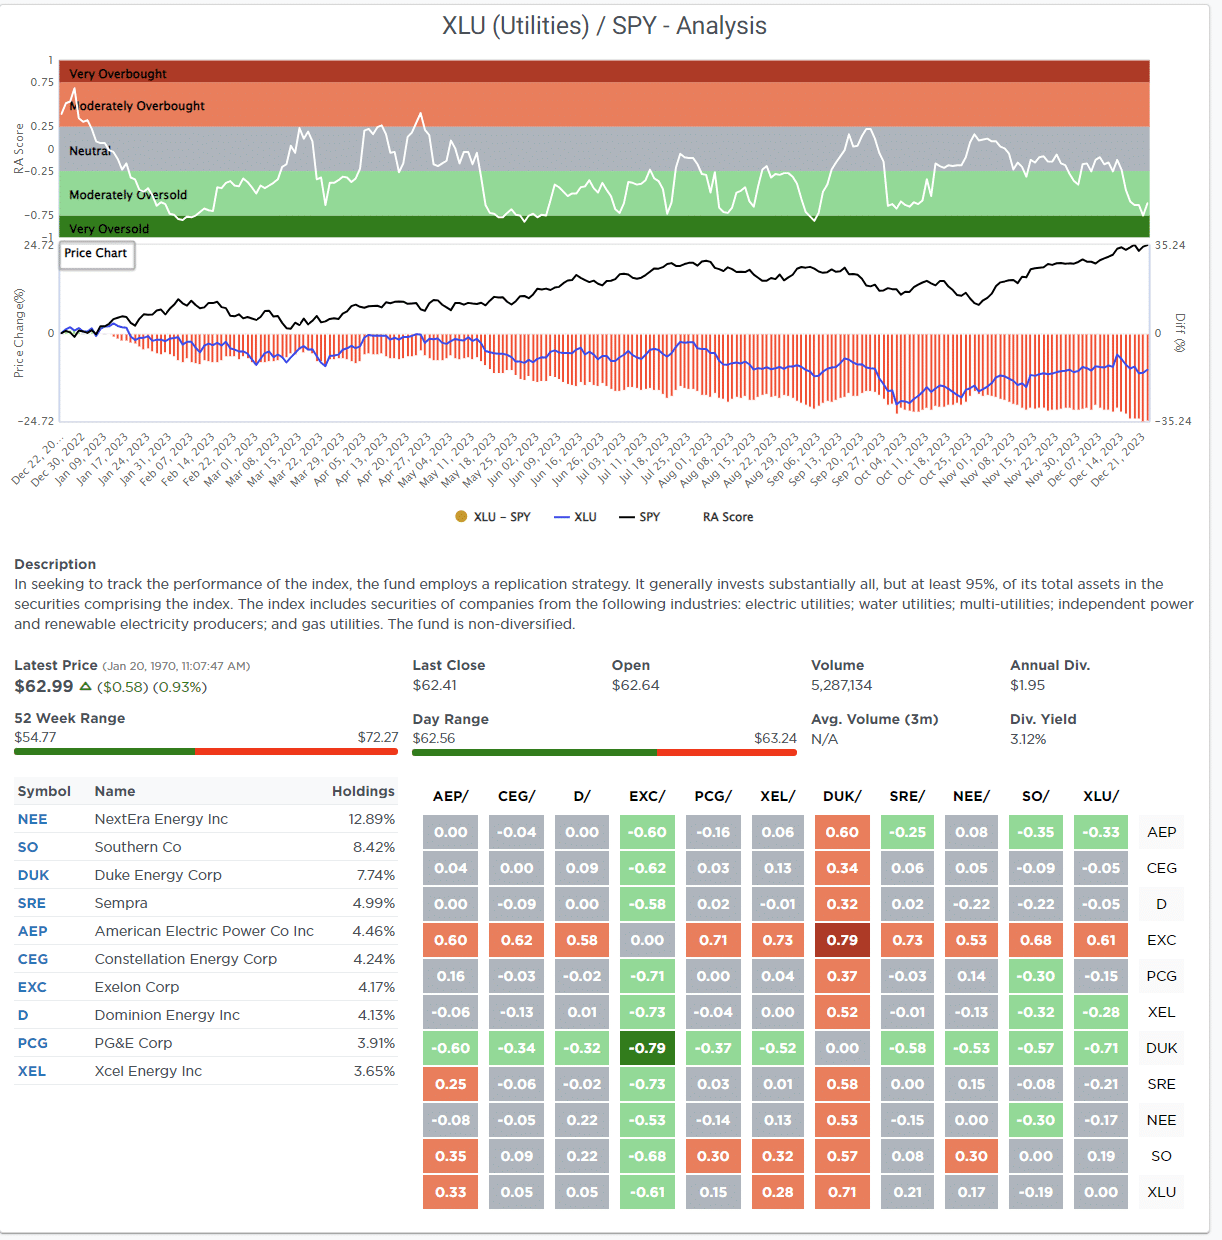
Most Oversold Sector Analysis
Sector Model Analysis & Risk Ranges
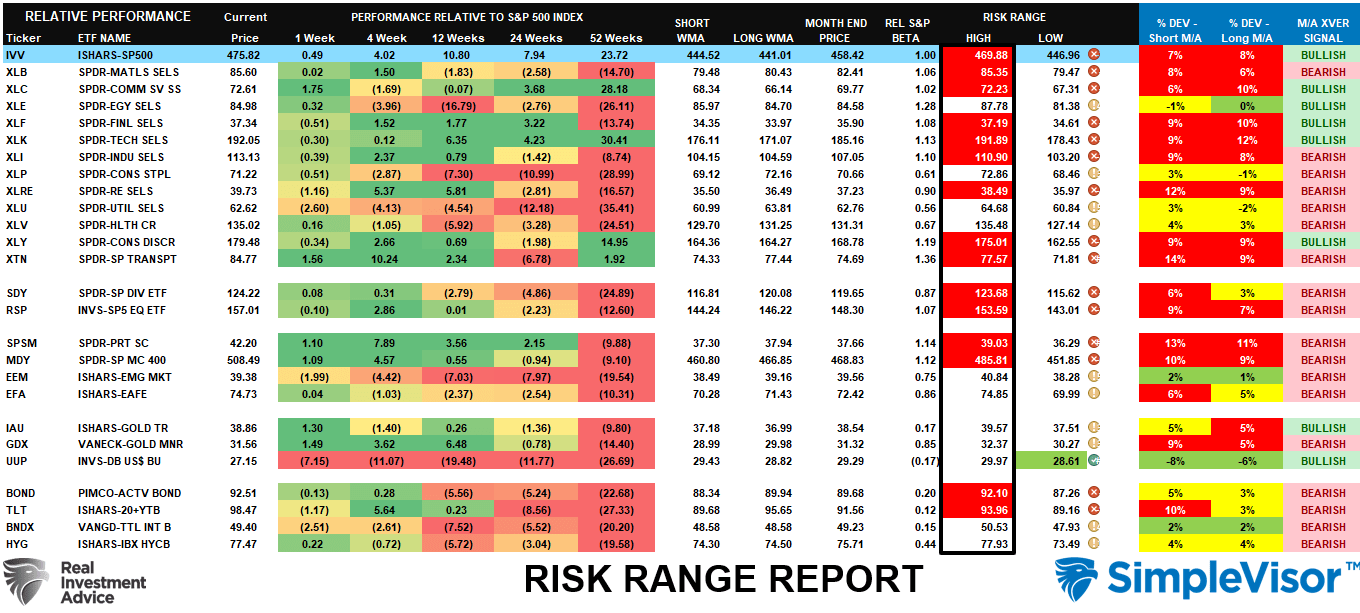
How To Read This Table
- The table compares the relative performance of each sector and market to the S&P 500 index.
- “MA XVER” (Moving Average Crossover) is determined by the short-term weekly moving average crossing positively or negatively with the long-term weekly moving average.
- The risk range is a function of the month-end closing price and the “beta” of the sector or market. (Ranges reset on the 1st of each month)
- The table shows the price deviation above and below the weekly moving averages.
In the middle of June, we discussed that a vast majority of Sectors and Markets were trading outside of their risk/reward ranges. To wit:
“Last week’s push to 4400 has pushed most sectors into more extreme overbought levels for the month. Combined with very overbought readings in our technical gauge above, the market is due for a pullback.”
That pullback started the next month, leading to a 10% market correction through the end of October.
The rally that began in November has now pushed most of the major sectors and markets out of the typical risk/reward ranges. Notably, many are also significantly deviated above intermediate and longer-term moving averages. Such an environment is unsustainable. Continue to manage risk in portfolios and hold cash for a better entry point in the New Year.
Weekly SimpleVisor Stock Screens
We provide three stock screens each week from SimpleVisor.
This week, we are searching for the Top 20:
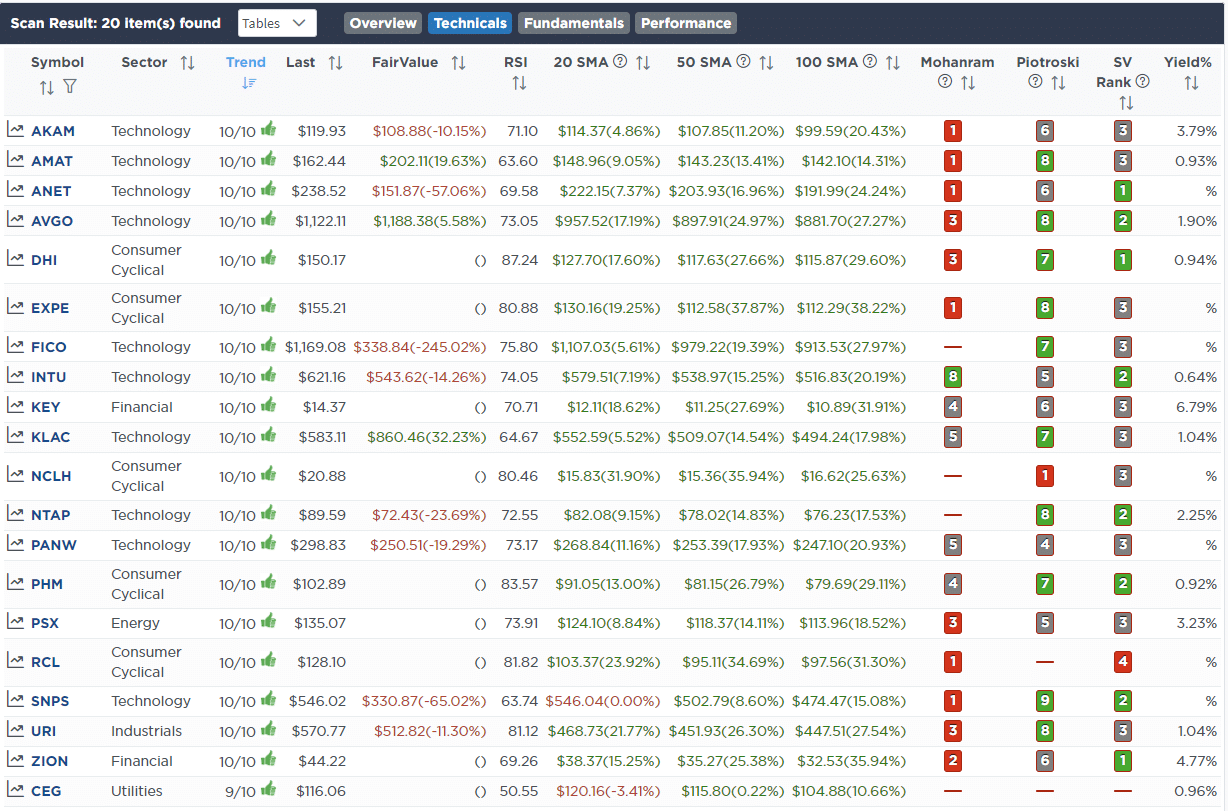
- Relative Strength Stocks
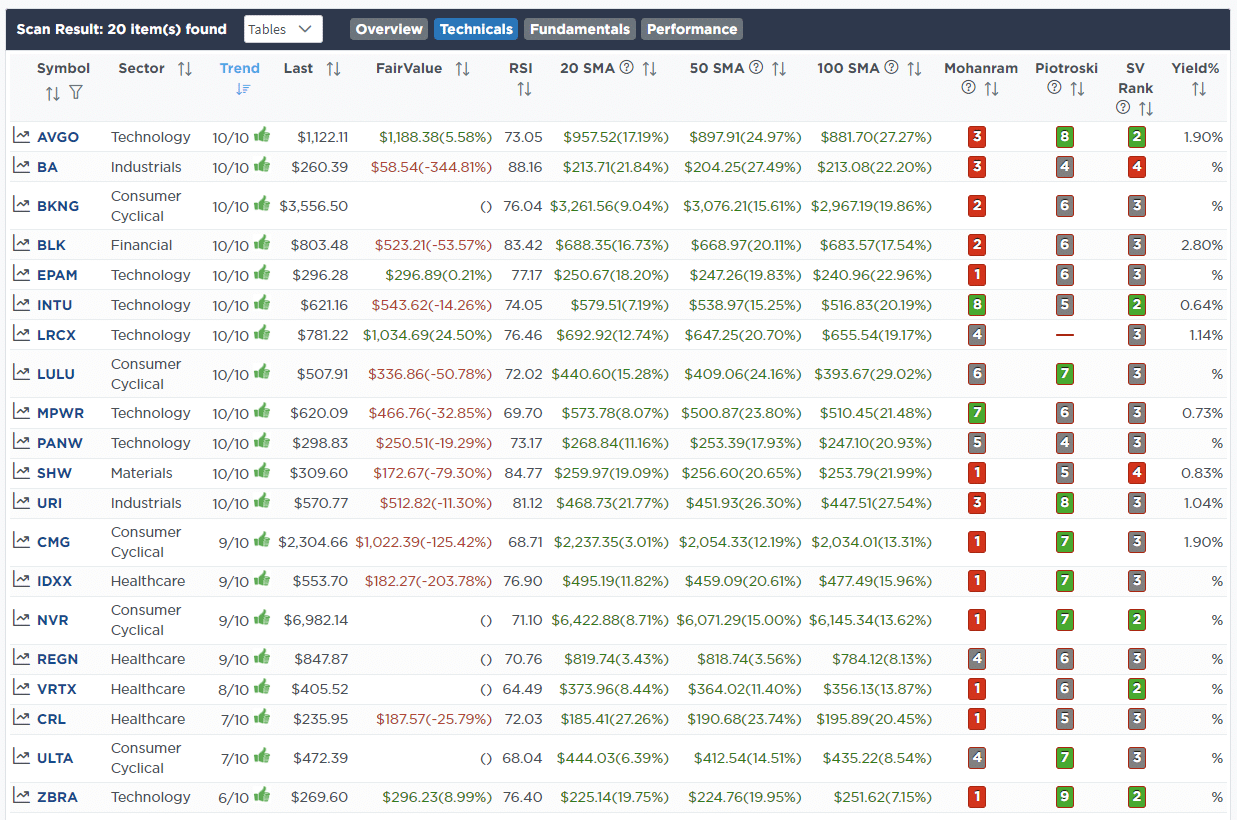
- Momentum Stocks
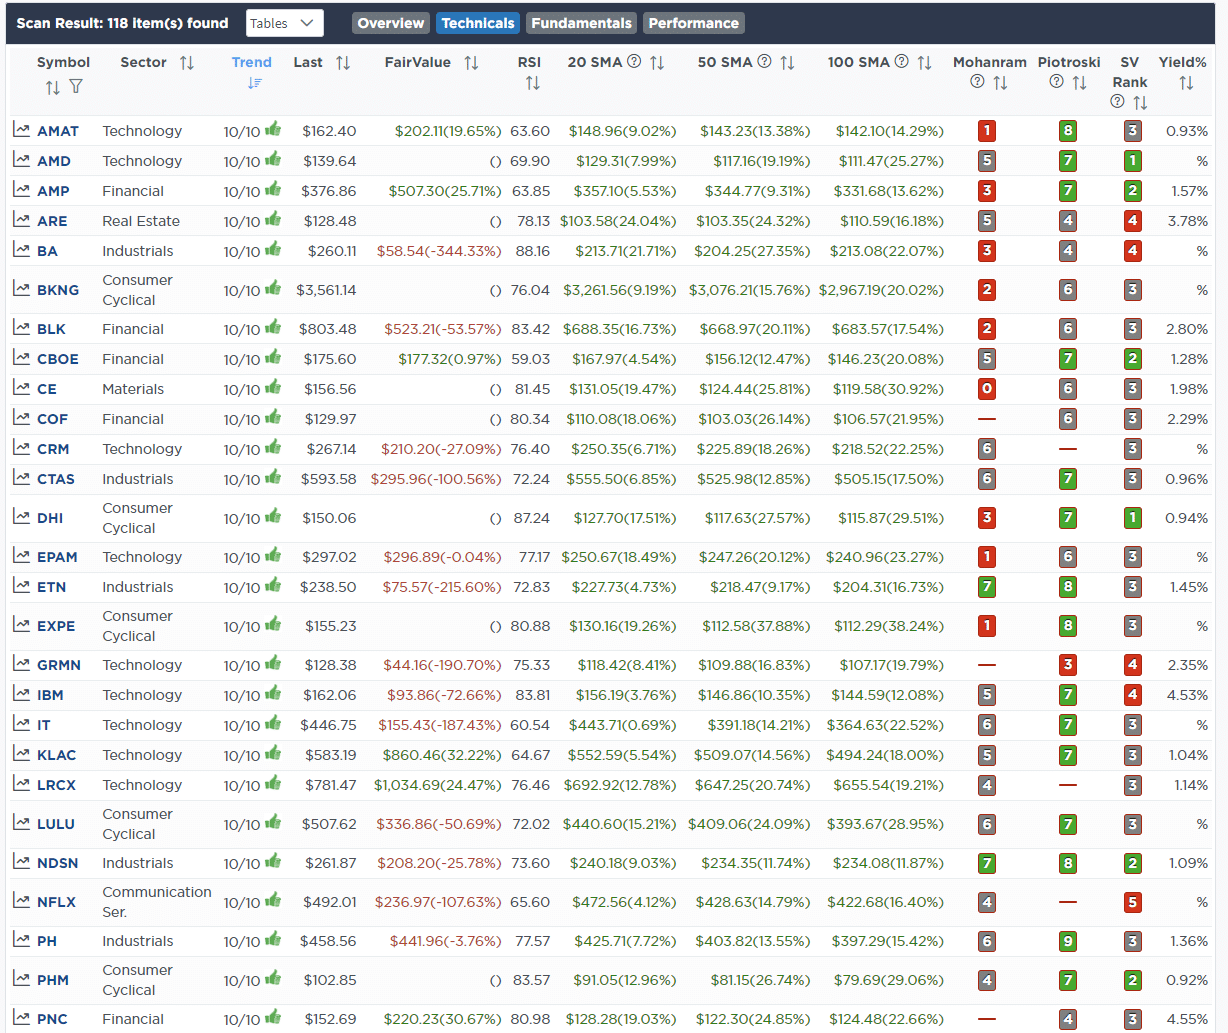
- Fundamental & Technical Strength
(Click Images To Enlarge)
R.S.I. Screen
Momentum Screen
Fundamental & Technical Strength
SimpleVisor Portfolio Changes
We post all of our portfolio changes as they occur at SimpleVisor:
No Trades This Week

Lance Roberts, C.I.O.
Have a great week!


