


Half-Truths Are Half Lies By Definition
“When one side of a story is heard and often repeated, the human mind becomes impressed with it insensibly” – George Washington
Daughter- Can I go out with friends?
Father- Have you asked your mother?
Daughter- Of course I have.
Father- Okay, have fun.
In the plot above, the daughter only tells her father half of the truth. She fails to disclose that her mother said “no.”
Like the daughter’s craftiness, many markets are surging on narratives built on just one side of a story. For speculators and gamblers, that seems to suffice. For investors aiming to build and preserve long term wealth, we suggest understanding every side of a story.
Of the many tales we hear to justify record equity valuations, low-interest rates are among the more popular. Make no mistake, low interest rates provide benefits to stock prices. However, that is only half of the truth. We now present the other half of the story that few tell.

Opportunity Cost
There is a popular narrative that says stocks should do well simply because bond yields are pitifully low. The basis behind the argument is simple math comparing historical stock returns versus current bond yields. The fact of the matter is that historical average returns and expected stock returns are often quite different.
The calculation of expected returns is primarily a function of the price of an asset. The higher the price paid, the lower your expected returns and vice versa.
As we wrote in “You’ve Got To Ask Yourself One Question. Do You Feel Lucky?” current expected equity returns are near 0, as valuations are extreme. Statistically based expected returns are vastly different than the “we hope for” expected returns spewed by cheerleaders in the financial and social media outlets.
The article presents four popular valuations methods and the expected returns based on the historical relationship between valuations and 10-year forward returns. In each case, the current valuation has a strong statistical correlation with the coming 10 years of returns.
We extend that analysis by comparing those return expectations to yields on Treasury and corporate bonds.
The intersection between the same color vertical and trend line denotes the expected return for the respective valuation method. We show Ten-year U.S. Treasury yields and BBB-rated corporate bond yields with the dotted horizontal lines.
The table below the graph summarizes our findings.
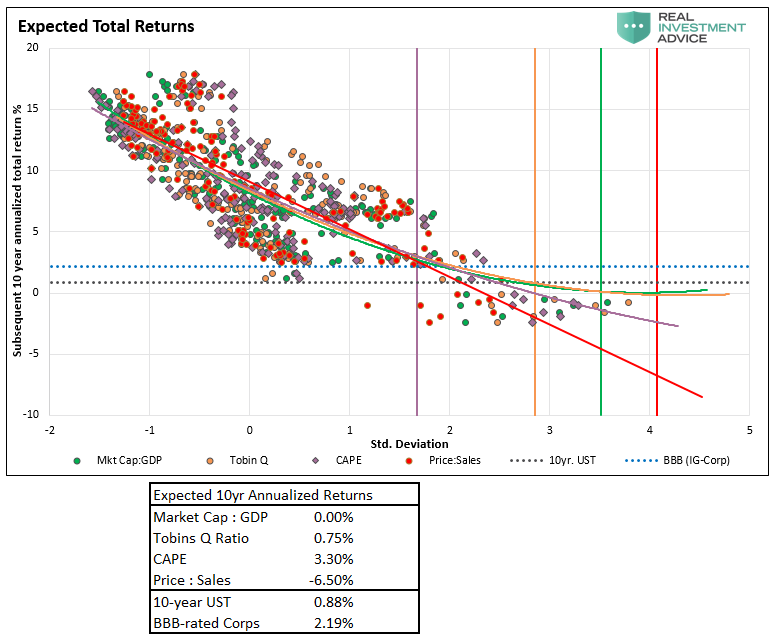
As shown in the graph and table, bonds, even with their paltry yields, have higher expected returns versus stocks over the next ten years in three of the four studies.
Bonds Are Rich
The story does not end there. Risk is an essential factor when comparing the expected returns of different assets. Traditionally, stocks have more than twice as much risk as measured by standard deviation than bonds. As such, the expected returns per unit of risk greatly favor bonds, even bonds with near-zero yields. Bonds may be rich, but stocks are richer.
The four graphs below, courtesy of Crescat Capital, further highlight that equities valuations are well above historical norms versus bond yields.
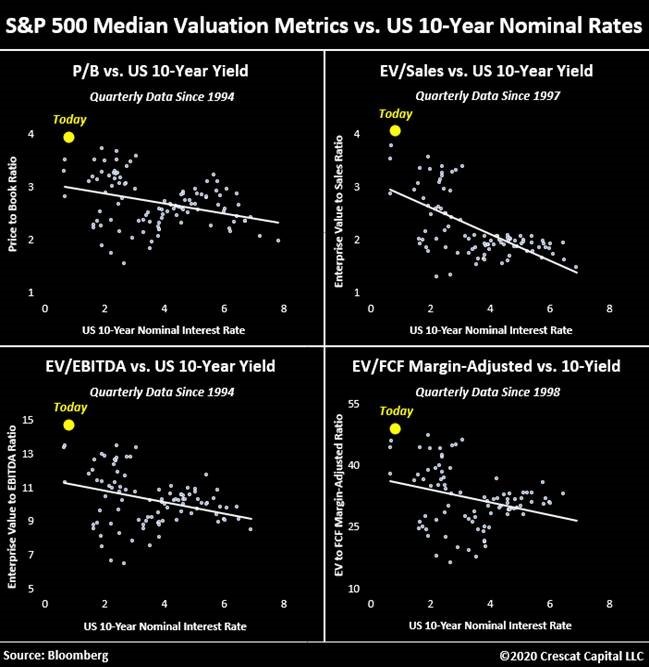
We compare the S&P 500 price to sales ratio to Ten-year Treasury yields below in the same vein. Using this statistically robust measure (R2 = .7109), the S&P 500 is 20% overvalued relative to current ten-year Treasury yields. If we assume ten-year yields go to zero, it is still 10% overvalued.


Earnings and GDP
Another popular narrative tells us that a lower discount rate applied to expected earnings improves the present value of said earnings. That is another half-truth.
Mathematically, a lower discount rate, with everything else equal, boosts the present value of expected cash flows. Unfortunately, everything is not equal.
Discount rates are based on risk-free yields, which are highly correlated to economic growth. Yields and economic growth rates have been in decline for the last 35 years. Not surprisingly, the growth rate of corporate earnings follows the same trends. The graph below compares the secular growth trends of yields, GDP, and profits. While corporate profits are much more volatile, the trends are in sync.

A lower discount rate applied to future earnings boosts valuations. However, one must also assume a slower growth rate for earnings projections. When both growth rates are appropriately adjusted, the benefit of a lower discount rate is largely offset by a slower expected earnings growth rate.
The blue dots in the graph below show the present value of a stream of future cash flows growing at 5% per selected discount rates. The orange line is similar, but it assumes a 4% cash flow growth rate.
As highlighted in the box with the red arrow, if the discount rate is lowered by 1% with no change to expected earnings growth, the present value rises by 18%. However, if we lower expected earnings and the discount rate by 1%, the black arrow shows that the present value increases by a mere 1%.

A lower discount rate is only bullish if no adjustments are made to earnings growth forecasts. The problem is yields, discount rates, and corporate earnings are directly tied to the economy.
The story is not as compelling when facts are equally applied.

Summary
Walk down the cereal aisle in any grocery store and read about the nutritional benefits of most cereals. The boxes are partially correct. Most breakfast cereals have an assortment of beneficial vitamins and fiber. Many also have unhealthy amounts of sugar.
The aisle for stocks is similar. As investors, we continually see half-truths. Most current investors are lazy and do not want to research the veracity of claims or what might not be exposed.
The fact of the matter is that half-truths sell, and in a bullish market, that is all investors want to hear.


Michael Lebowitz, CFA is an Investment Analyst and Portfolio Manager for RIA Advisors. specializing in macroeconomic research, valuations, asset allocation, and risk management. RIA Contributing Editor and Research Director. CFA is an Investment Analyst and Portfolio Manager; Co-founder of 720 Global Research.
Follow Michael on Twitter or go to 720global.com for more research and analysis.
Customer Relationship Summary (Form CRS)
Also Read


