


While bond yields have risen sharply lately, fund flows into bonds tell two very different stories. We have previously written much on the recent rise in bond yields related to economic growth, event risks, and recessions. To wit:
“Since rates and expectations must adjust for the potential future impact on the current value of invested capital:
- Equity investors expect that as economic growth and inflationary pressures increase, the value of invested capital will increase to compensate for higher costs.
- Bond investors have a fixed rate of return. Therefore, the fixed return rate is tied to forward expectations. Otherwise, capital is damaged due to inflation and lost opportunity costs.
Therefore, the long-term correlation between rates, inflation, and economic growth is unsurprising.“
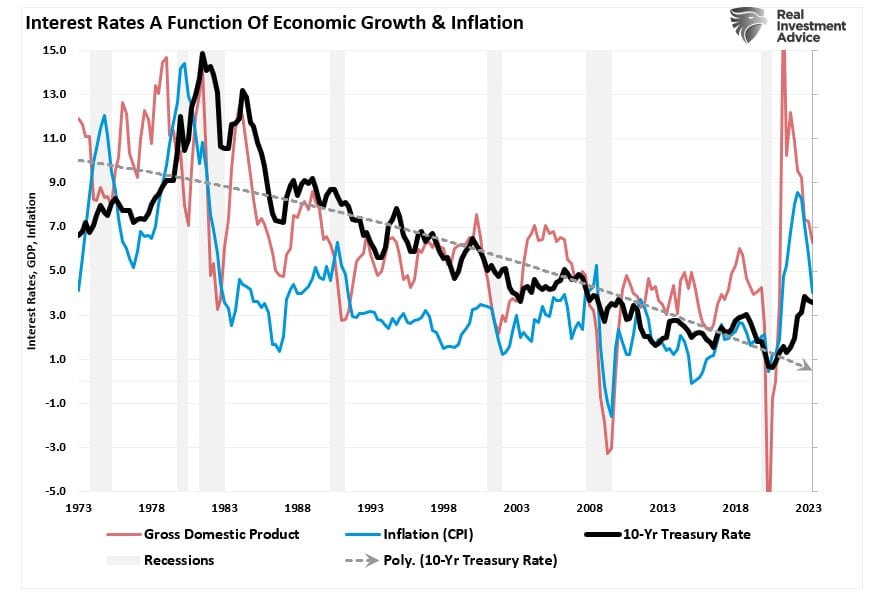
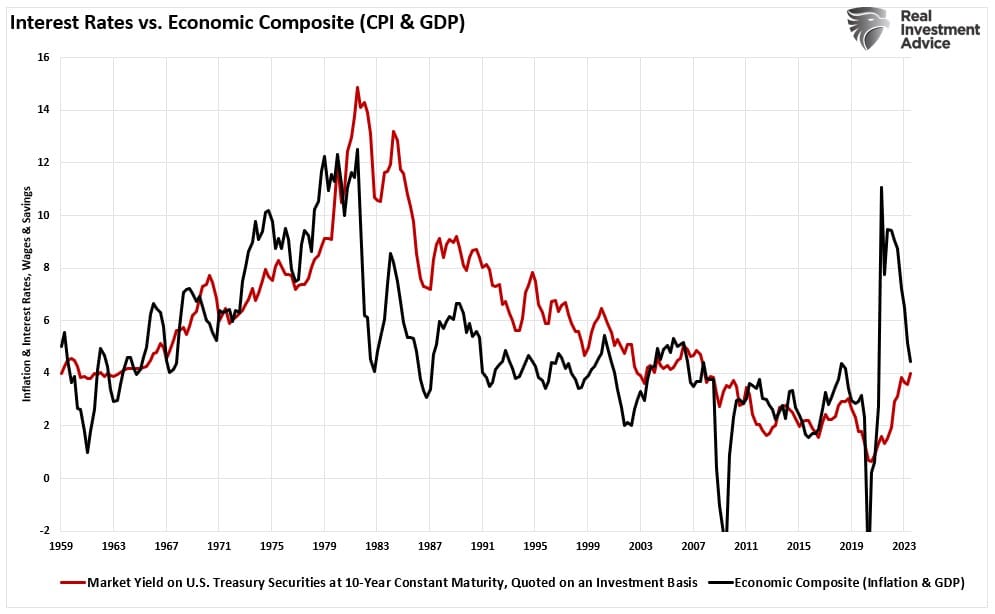
“That chart is pretty cluttered, so the following chart is a composite index of inflation and economic growth compared to the 10-year Treasury yield.”
Of course, that analysis contradicts the views of Ray Dalio, Bill Ackman, Bill Gross, and others who currently expect rates to go higher. The disconnect comes down to time frames. More importantly, investors must understand the difference between short-term market-driven narratives and the long-term economic dynamics that drive interest rates.
Such is the basis for our discussion in this blog.

Traders Are Heavily Short Bonds
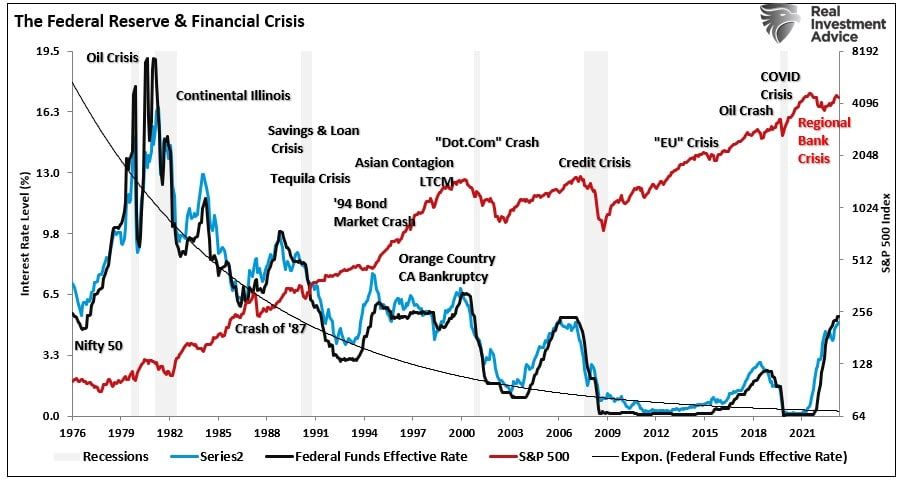
Over the last two years, interest rates on Treasury bonds have risen in response to two primary factors. On the short end of the Treasury curve, the 1-month to 2-year Treasury bonds are heavily influenced by the Federal Reserve’s monetary policy changes. As shown, there is an exceedingly high correlation between the Fed funds rate and the 2-year Treasury.
However, the long-end of the yield curve, 10-year Treasury bonds or longer, are driven almost entirely by expectations for economic growth, inflation, and wages, as shown above. Notably, the correlation is very high.
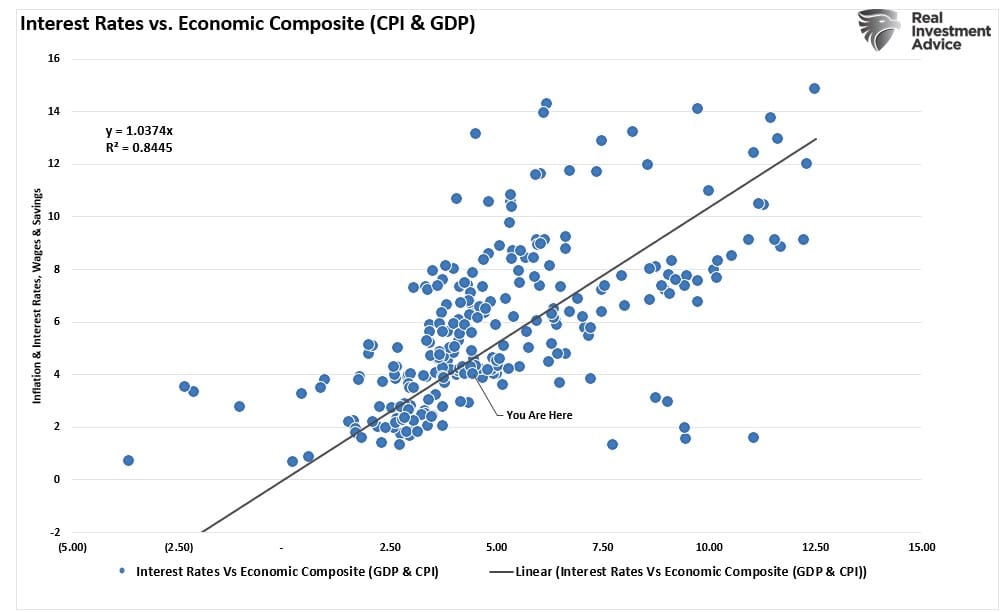
“As expected, the surge in economic growth and inflation pulled longer-duration yields higher. With a correlation of nearly 85% between interest rates and a GDP/Inflation composite index, investors should expect rates to fall as economic growth and inflation decline.”
Of course, there are periods where interest rates can, and do, diverge from the underlying economic fundamentals. We are experiencing one of those periods, driving the view that “rates must go higher.”
As we have discussed, the Commitment Of Traders (COT) report gives us some insights into what major fund managers, hedge funds, and commodity traders are doing. Given that yields on bonds are solely a function of the changes in price relative to its coupon, differences in yield can be influenced by market-driven actions in the short term.
The most recent COT report currently shows a record number of short positions against Treasury bonds. That “selling” pressure has pushed prices lower and yields higher, as shown below. We saw a similar episode during the “Taper Tantrum” in 2018.
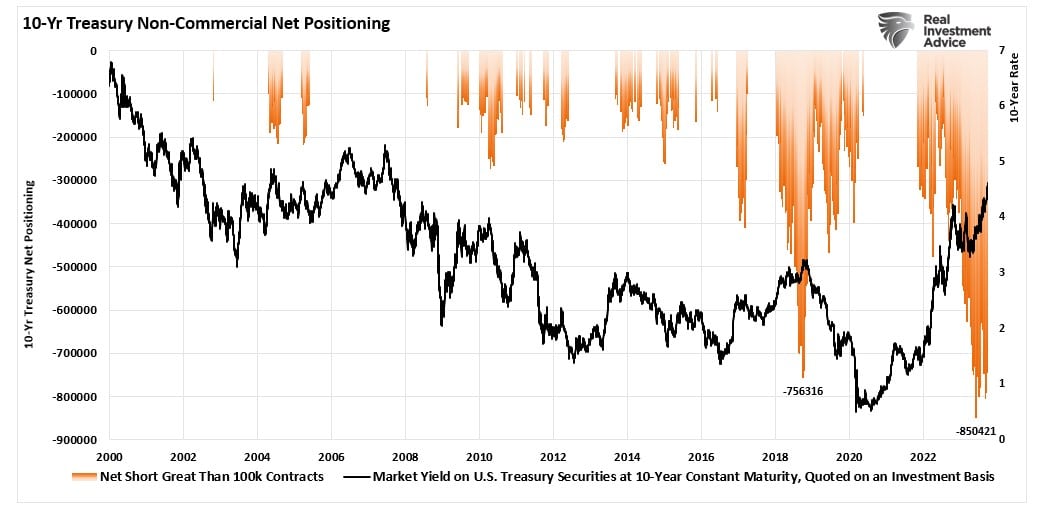
Notably, when something “breaks,” those heavily “short” Treasury bond traders will be forced to cover those speculative positions. In 2018, the reversal of those speculative short positions on bonds was caused to cover as the Federal Reserve stepped in with a massive “reverse repo” program to bail out hedge funds.
As noted by TheStreet.com recently:
“It is clear that interest rates are driving the ship, but that ship could be on the cusp of taking a major turn. Maybe this time is different, but we doubt it. The odds favor an eventual unwind of the overly bearish 10-year note trade. The massive amount of short-covering could easily push yields back into the 2% handle.”
Of course, while rates rise and speculative traders short bonds, you might think no one is buying bonds.
However, you would be wrong.

Follow The Money
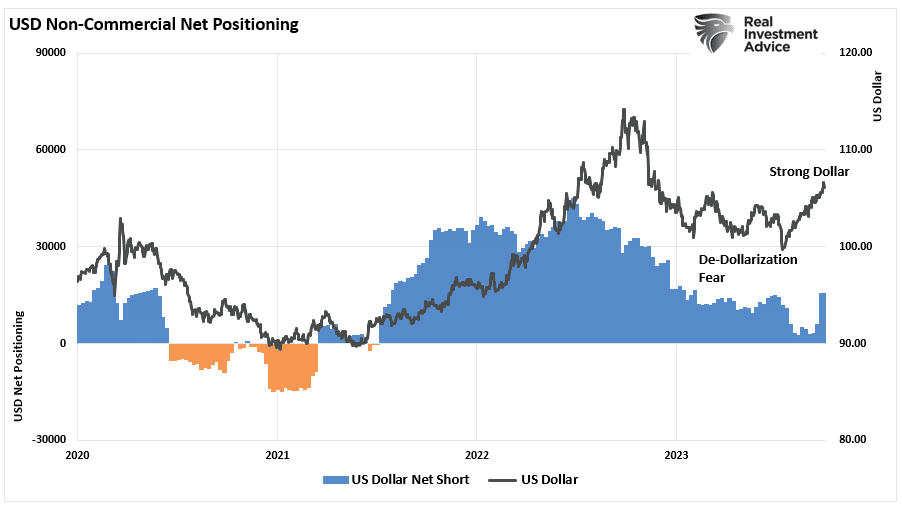
While speculators potentially drive higher yields in the short term, pay attention to fund flows. Two pieces of evidence suggest that rising yields aren’t a function of a lack of buyers. The first is the U.S. Dollar index.
Last year, there was a significant concern about a collapse in the U.S. dollar as “de-dollarization” would cause the loss of the reserve currency status. As both Michael Lebowitz and I discussed at the time, such would not be the case. To wit:
“Foreign nations accumulate and spend dollars through trade. They keep extra dollars to manage their economies and limit financial shocks. These dollars, known as excess reserves, are invested primarily in U.S.-denominated investments ranging from bank deposits to U.S. Treasury securities and a wide range of other financial securities. As the global economy expanded and more trade occurred, additional dollars were required. As a result, foreign dollar reserves grew and were lent back to the U.S. economy.“
This backdrop for the dollar is not changing anytime soon. According to the IMF, the dollar makes up almost 60% of global foreign exchange reserves. While the percentage has declined by about 10% over the last decade, it is still three times the next leading reserve, the Euro, which accounts for about 20% of global reserves. For those concerned about China, their currency, the renminbi (yuan), accounts for 2.5% of all reserves.
Not surprisingly, as the U.S. economy is more robust than its counterparts, and the yield on the 10-year Treasury bond is substantially higher, foreign excess reserves are now flowing into the U.S. Dollar.
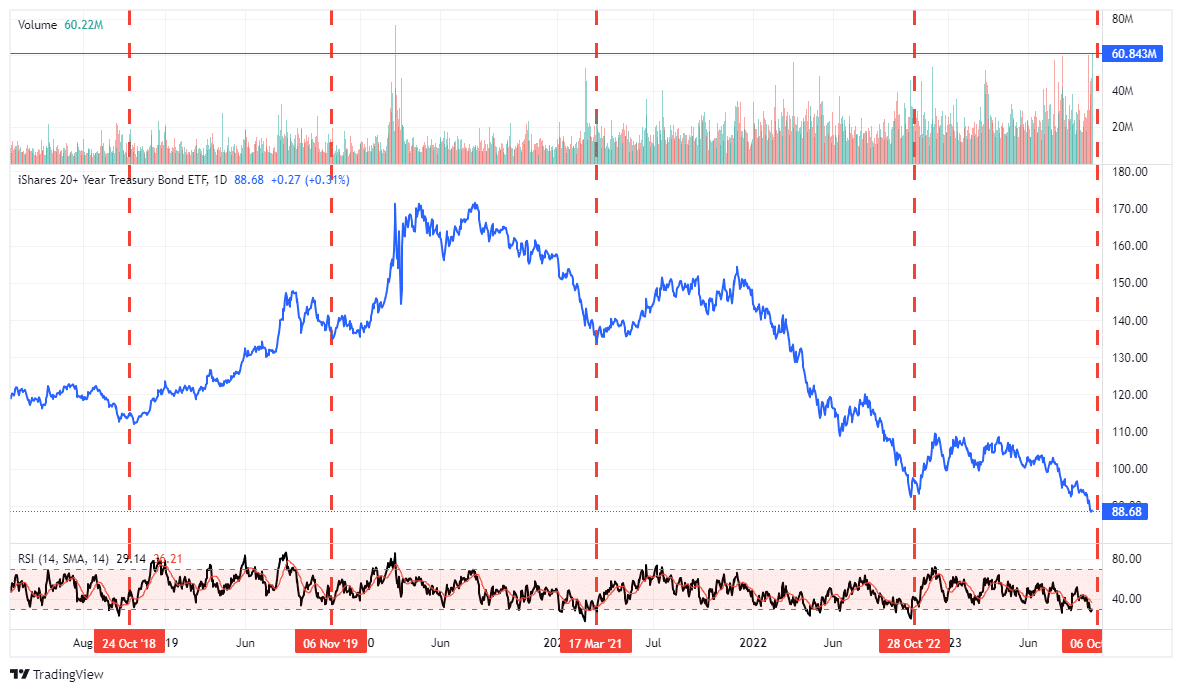
When reserves flow into the U.S. dollar, those dollars are converted into U.S. Treasury Bonds. Such is why inflows into Treasuries continue to grow despite traders’ record short-position in Treasury bonds. As shown, the volume of fund flows into bonds is the highest since the 2020 economic shutdown.
While interest rates have stayed elevated, investors have turned to longer-term funds. As noted by Morning Star:
“Long-government funds were the most popular taxable bond category last year, during which time they hauled in $46.4 billion.“
For investors, the current rise in yields has undoubtedly been concerning. That rise, coinciding with much media spin about the “death of the dollar” and “debts and deficits,” certainly fueled the fears of spiraling interest rates.
However, when we “follow the money,” the fund flows suggest a different outcome.


Lance Roberts is a Chief Portfolio Strategist/Economist for RIA Advisors. He is also the host of “The Lance Roberts Podcast” and Chief Editor of the “Real Investment Advice” website and author of “Real Investment Daily” blog and “Real Investment Report“. Follow Lance on Facebook, Twitter, Linked-In and YouTube
Customer Relationship Summary (Form CRS)
Also Read


