


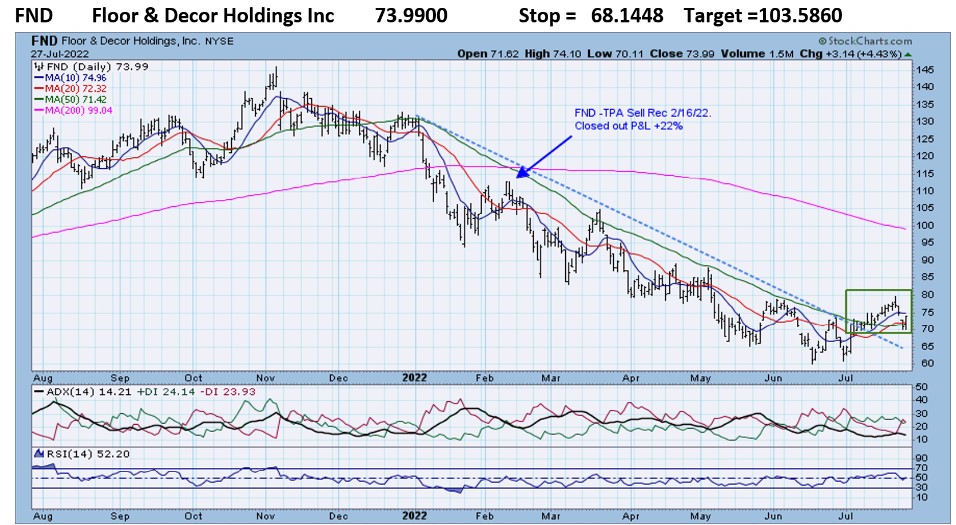
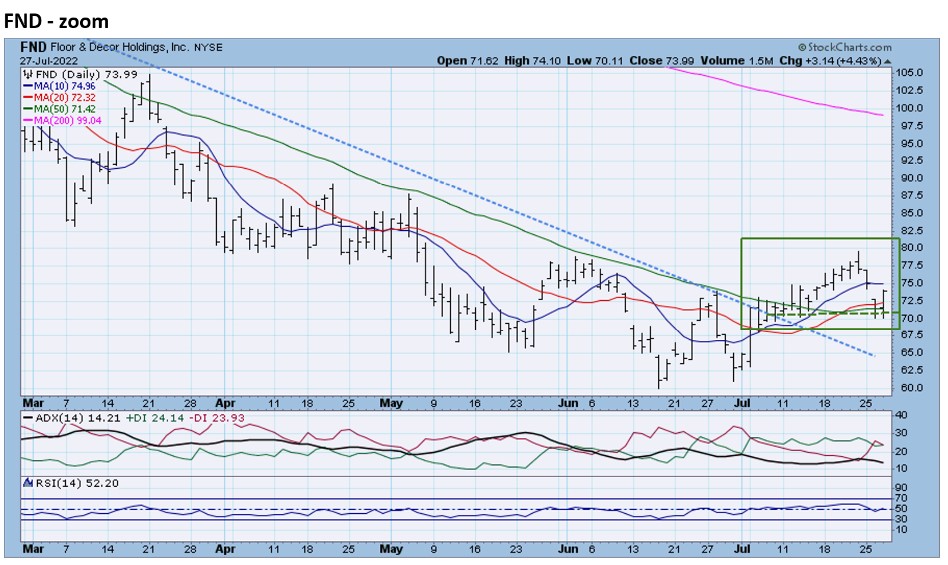
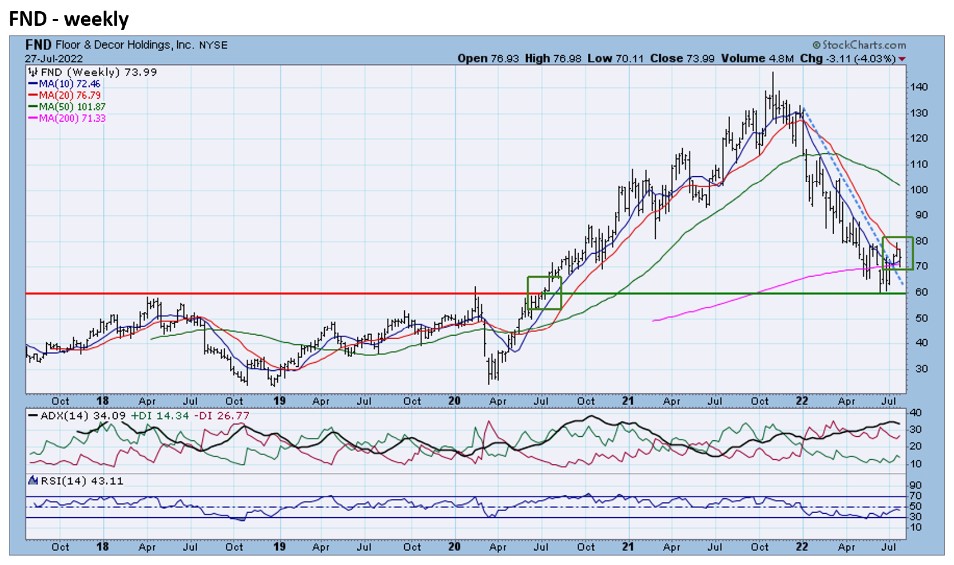
FND rose above its very steep 2022 downtrend line in early July. FND had declined over 50% from year to date before starting its recent recovery. TPA had recognized FND’s technical weakness and recommended a sale on 2/16/22, which was closed out P&L +22%. The tide, however, seems to have turned for FND. FND still remains close enough to its breakout support for a buy. The weekly chart shows that the lows of June and July were at long-term support from the 2020 breakout.
RRG analysis – FND was one of the Top 20 stocks in this week’s TPA-RRG report, which means it was highly scored and ranked. FND is also moving toward the Leading quadrant.
Relative Rotation Graphs (RRG) – explanation video
FND Floor & Decor Holdings Inc 73.9900 Stop = 68.1448 Target =103.5860


Jeff Marcus founded Turning Point Analytics (TPA) in 2009 after 25 years on trading desks and 13 years as a head trader to provide strategic and technical research to institutional clients. Turning Point Analytics (TPA) provides a unique strategy that works as an overlay to clients’ good fundamental analysis. After 10 years of serving only large institutions, TPA now offers its research services to mid and small managers, RIA’s, and wealthy sophisticated individuals looking for a way to increase their returns and outperform their peers.
Subscribe 2 Week Trial
Customer Relationship Summary (Form CRS)
Also Read


