


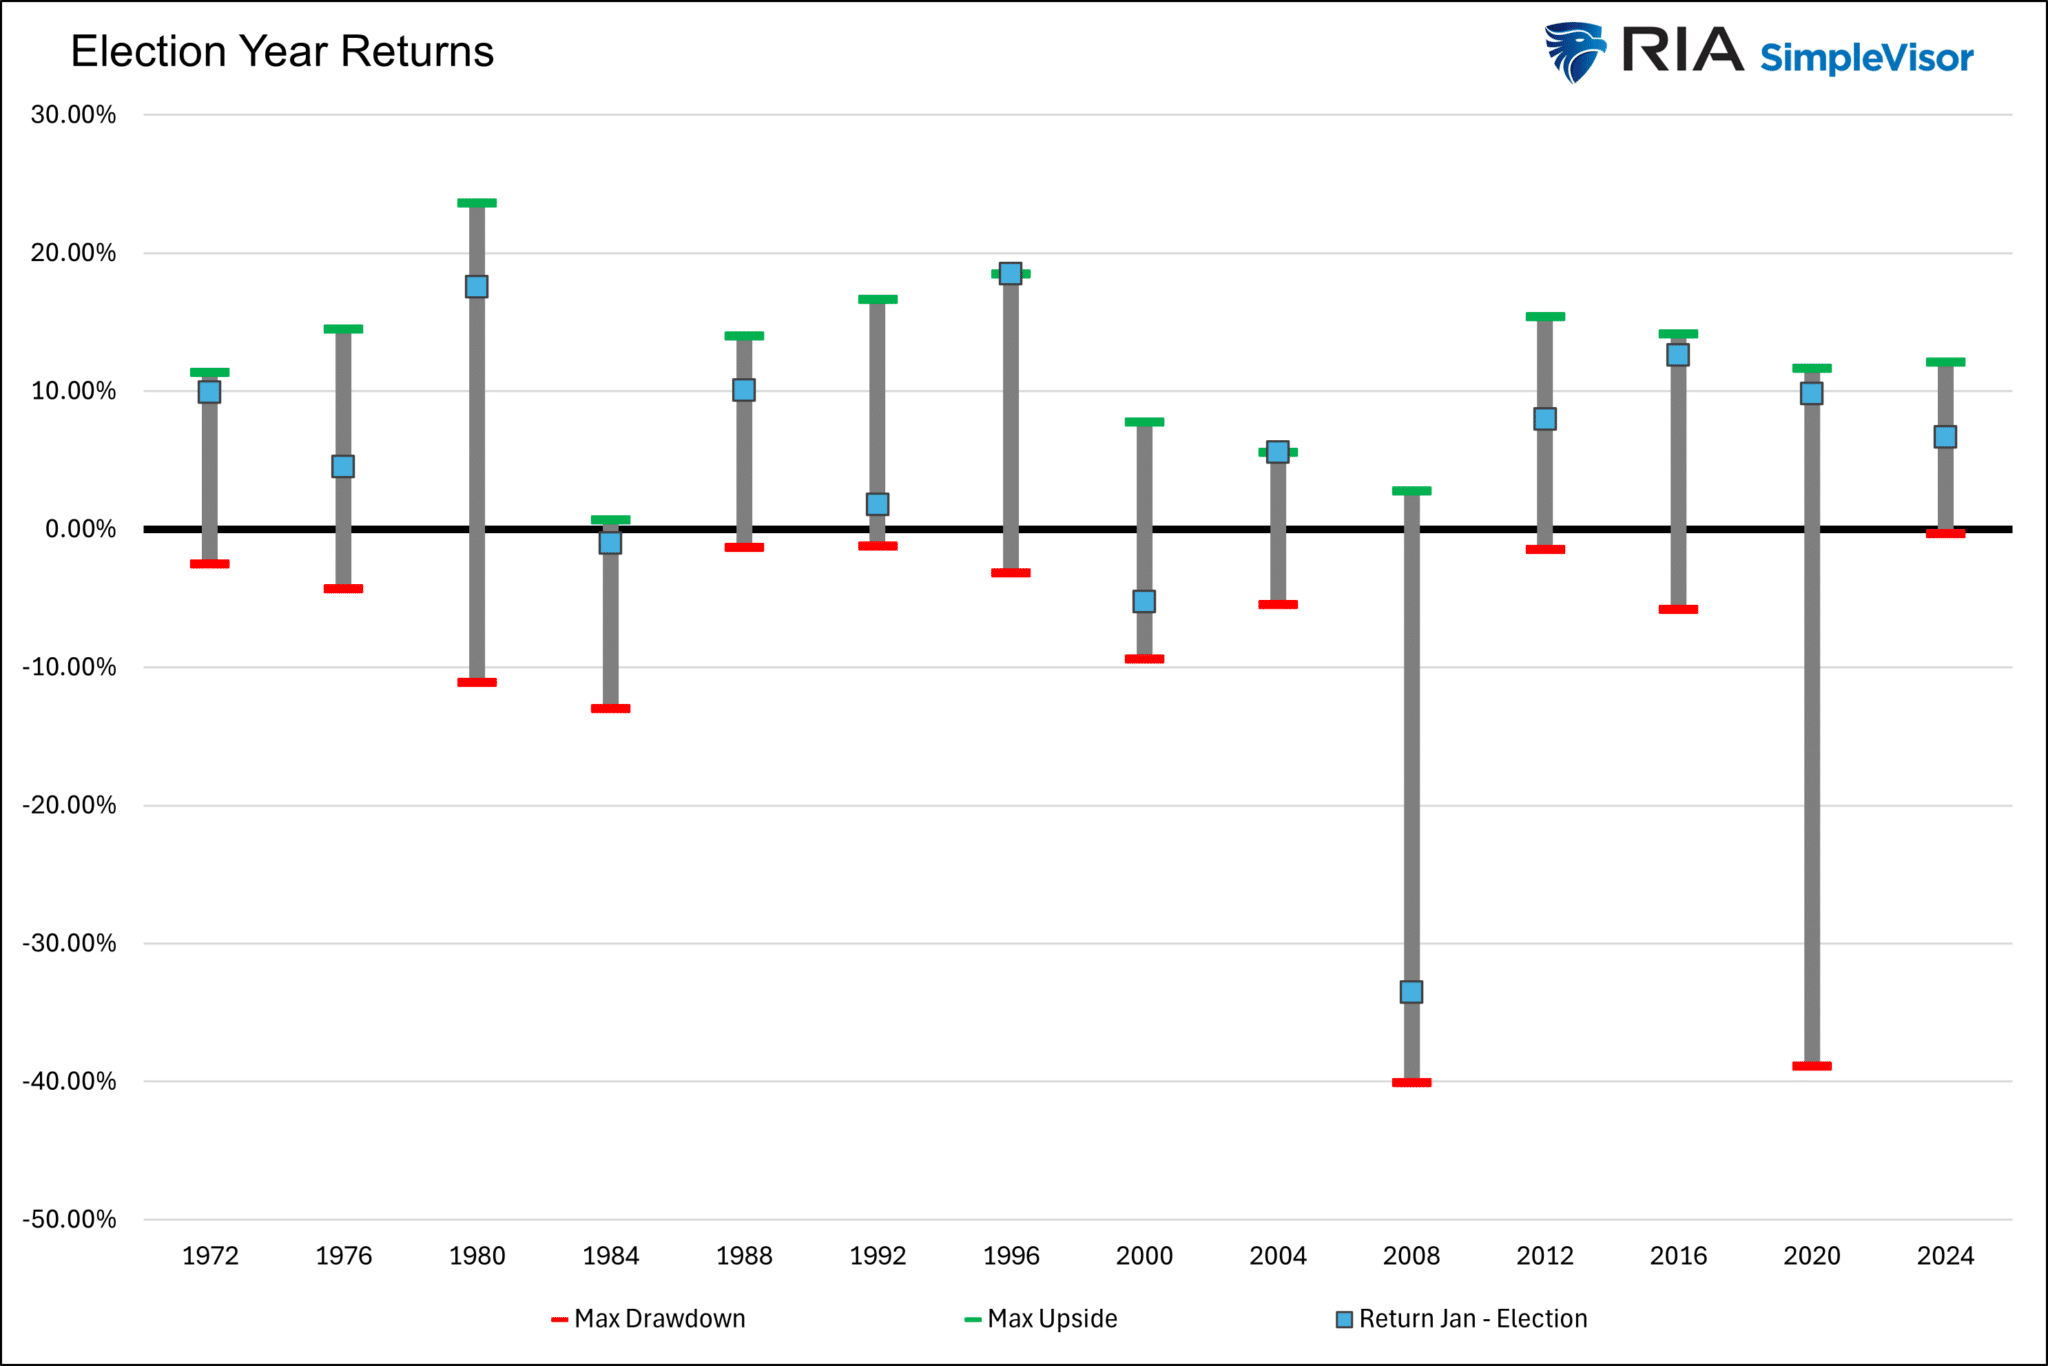
Investors tend to prefer periods of stability. However, as we share below, politicians’ promises appear to offset the potential instability associated with changes in the White House and/or Congress. We present the graph below to help appreciate how seasonal patterns may affect stock prices this election year. Since 1972, only three of the thirteen election periods had negative returns between January and the election. The 1984 election was slightly negative, although from January to July, the S&P 500 fell 13% but fully recovered by November. 2000 and 2008 were the worst years for returns.
The range of returns throughout the series of ten-month periods is also important to appreciate. Of the thirteen periods, only five had a maximum drawdown of 5% or worse. All but four of the years saw at least one point within the period in which the S&P 500 posted double-digit gains. The average gain for all election year periods is 4.65%, with an average maximum drawdown of 9.86% and an upside of 12.76%. The outsized losses in 2008 certainly skew the data. Excluding that year, the average gain is nearly 8%. While we are only four months into the current election period, the return is already 2% above the average, and the maximum return this year matches the average. Might we have already seen the best performance of the year, or do years like 1980, 1996, and 2016 provide hope for even better returns in the coming months?
What To Watch Today
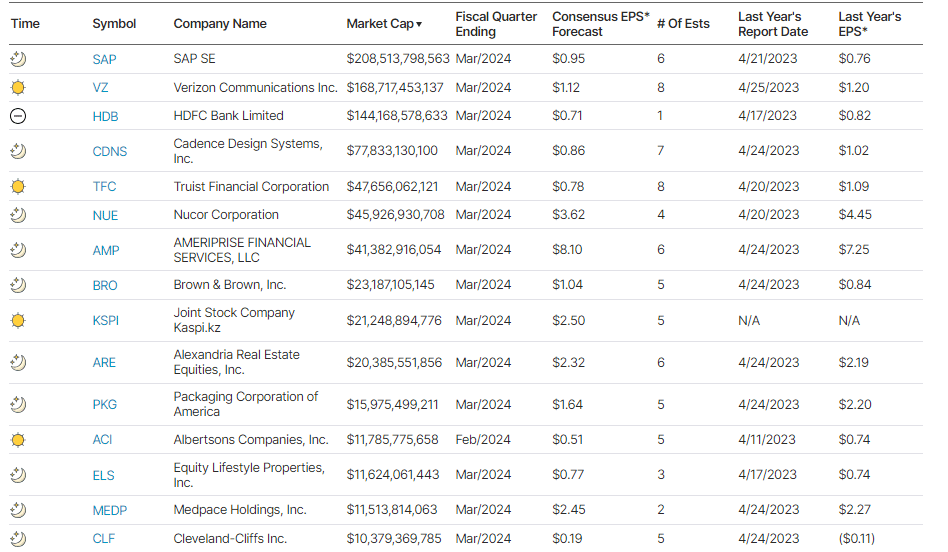
Earnings
Economy

Market Trading Update
Last week, we discussed the market’s break of the bullish trend. To wit:
“The market did break below the previous low on Friday after failing to reclaim that previous support at the 20-DMA. The failure to reclaim that support turns the previous 20-DMA into resistance and makes the 50-DMA new critical support over the next few days. (Note: If the market makes a confirmed break of the 50-DMA, the 100- and 200-DMAs become the following logical targets.)”
Over the two months, we repeatedly warned that a correction process was likely. As noted in “Market Top or Bubble:”
“As noted, the market remains in a bullish trend. The 20-DMA, the bottom of the trend channel, will likely serve as an initial warning sign to reduce risk when it is violated. That level has repeatedly seen ‘buying programs’ kick in and suggests that breaking that support will cause the algos to start selling. Such a switch in market dynamics would likely lead to a 5-10% correction over a few months.“
While it took longer than expected, that correction process arrived last week and continued earnestly with the market approaching the 100-DMA. With the market short-term oversold, a reflexive rally in the next week is likely, with the 50-DMA being notable resistance. Any rally toward 5100 should be used to rebalance risk and hedge portfolios as needed.
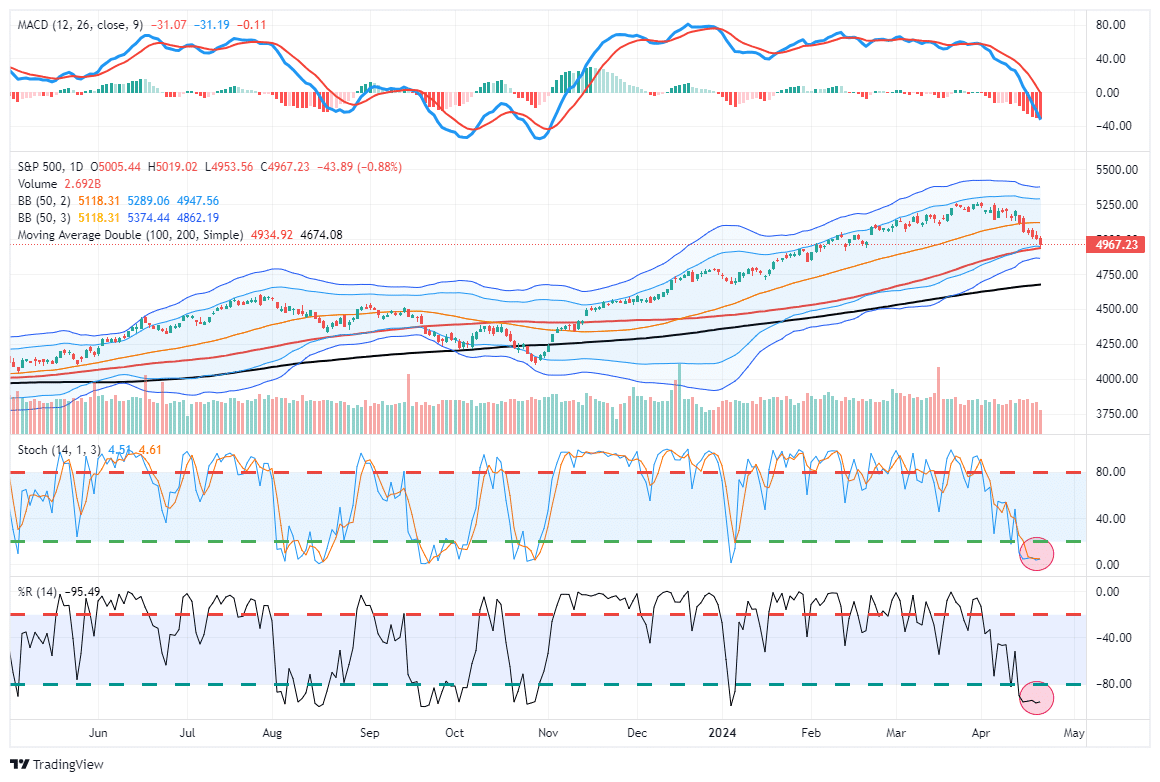
Notably, this has been a very orderly correction. While there has certainly been selling in the markets, particularly in some of the previous “momentum” names, volatility has risen in a controlled manner. Such suggests that this correction process is just a normal correction within an ongoing bullish trend. You will note very similar actions during the decline last summer.
As noted last week:
“The confirmed break of support suggests reviewing portfolio allocations and taking profits in well-performing positions. However, while some stocks have only begun to correct from previously overbought conditions, many have already corrected by 10% or more over the last few weeks. Those companies may see inflows as a rotation trade in the market occurs.
In other words, as is always the case, be careful “throwing the baby out with the bathwater.” Opportunities to acquire better-priced companies always exist, even during a corrective process.”

The Week Ahead
Earnings from the largest technology companies will be a big focus this week. Verizon will kick off earnings on Monday, followed by Visa, Tesla, Meta, Microsoft, Google, Amazon, and Exxon. Apple and AMD will post earnings next week. There are a significant number of earnings announcements from other large companies that we do not mention.
PCE prices on Friday will help us decipher if the hotter-than-expected CPI or relatively benign PPI inflation data is accurate. The Fed prefers PCE, so we expect market volatility if PCE is above or below expectations. Economists expect PCE and Core PCE to be 0.3%, which is in line with last month’s readings.
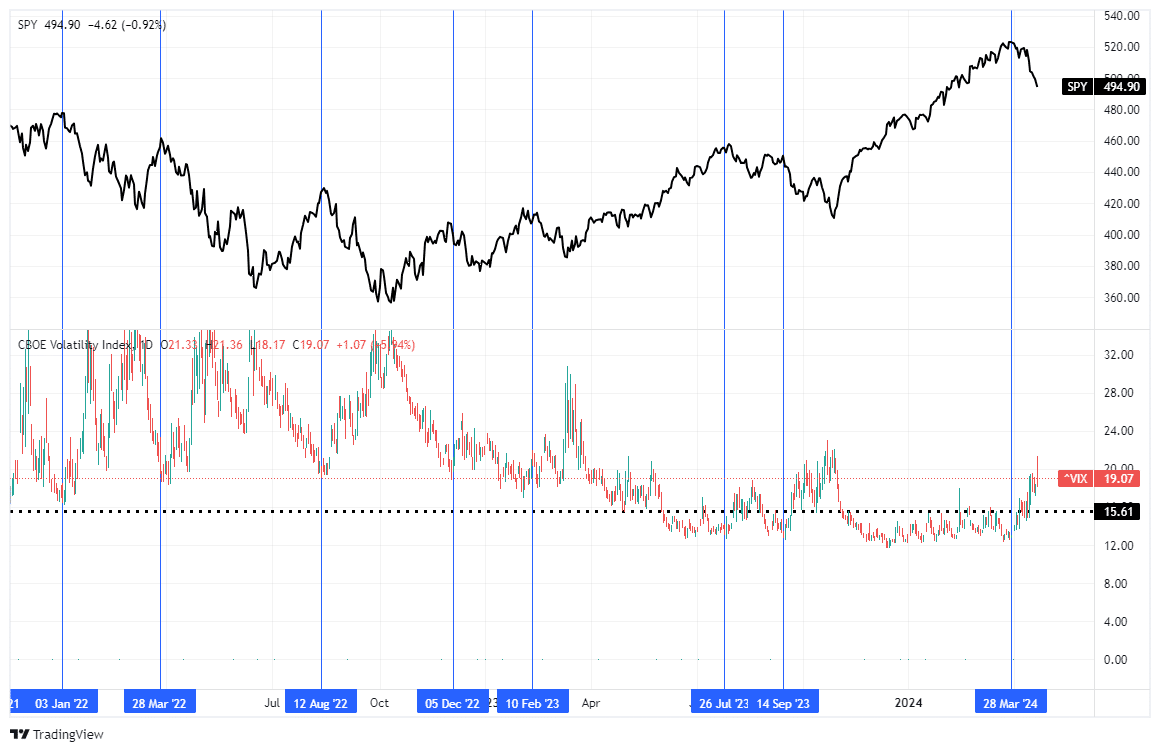
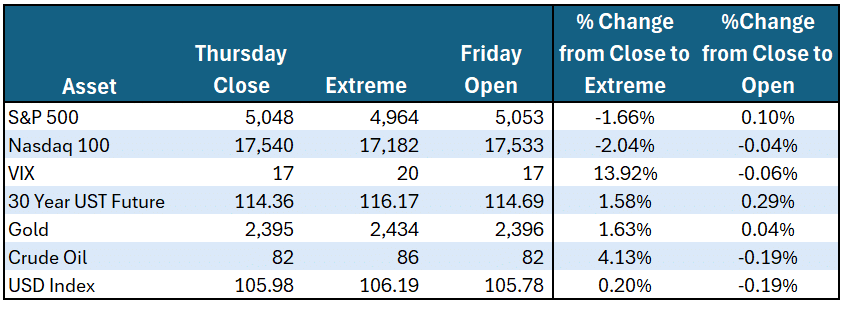
The Escalation Between Israel and Iran Sends Markets On A Rollercoaster To Nowhere
Later Thursday night, it was reported that Israel bombed Iran near areas where they house its nuclear capabilities. The market reaction was decidedly risk-off as traders assumed this action would further escalate their ongoing conflict. As it turns out, cooler heads prevailed, and Iran alluded that it would not retaliate. While nothing is off the table, the roller coaster ride in many asset classes tells us the market fears of escalation evaporated by Friday morning. Consider the following table showing the Thursday close, Friday open, and the maximum percentage gain or loss at the peak of panic.
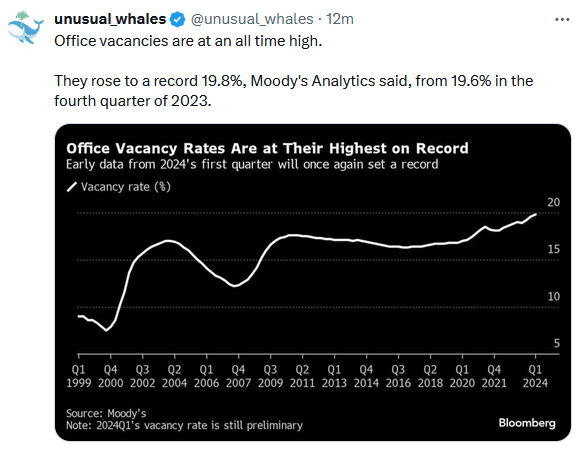
Tweet of the Day
“Want to achieve better long-term success in managing your portfolio? Here are our 15-trading rules for managing market risks.”
Please subscribe to the daily commentary to receive these updates every morning before the opening bell.
If you found this blog useful, please send it to someone else, share it on social media, or contact us to set up a meeting.
Also Read


