


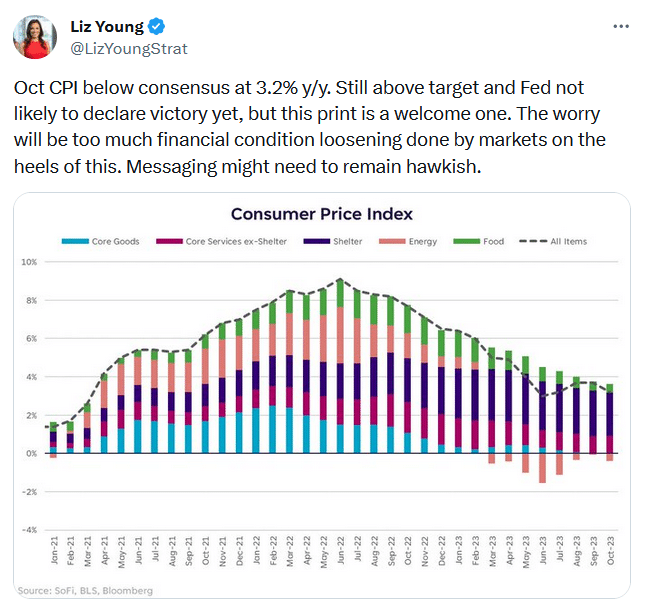
All four broad CPI inflation measures were below expectations for the first time in a long while. Headline CPI for October was 0.00%, with year-over-year inflation at 3.2%. Core CPI was 0.2%, with year over year at 4.0%. All four were .10% below what was expected. The Tweet of the Day shares a chart showing that shelter prices, which rose 0.3%, remain an outsized driver of higher inflation. Given that October’s CPI was 0%, and shelter was +.3%, CPI excluding shelter declined last month. Due to recent price declines in rents and home prices, CPI shelter prices will, in time, fall to zero or even below, dragging CPI lower with it. So, the big question for stock and bond investors is what might the CPI report mean for the Fed’s policy posture.
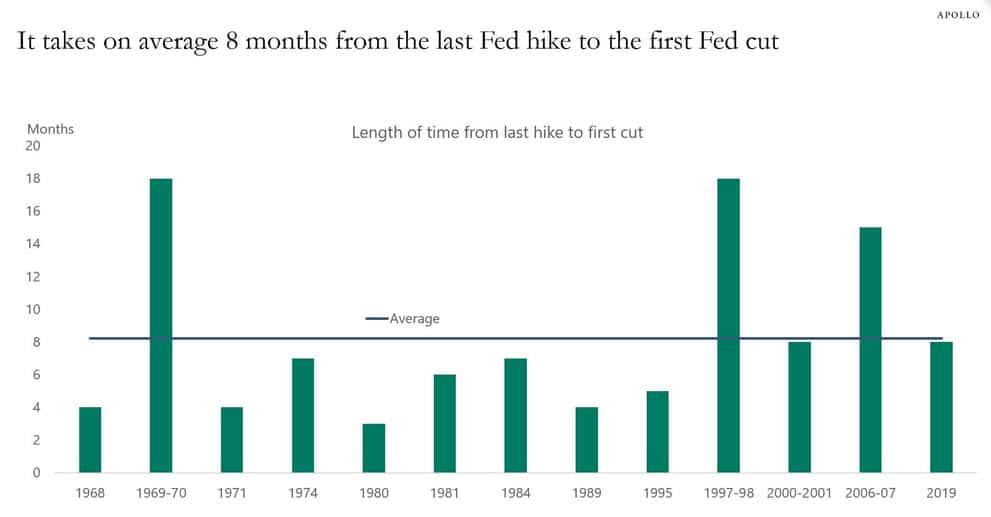
The Fed whisperer, WSJ reporter Nick Timiraos, posted the following comments after the CPI report: “The October payroll report and inflation report strongly suggest the Fed’s last rate rise was in July. The big debate at the next Fed meeting is shaping up to be over whether and how to modify the postmeeting statement to reflect the obvious: the central bank is on hold.” Nick is likely correct, but the Fed will be careful not to get dovish. They risk sharp declines in interest rates and further increases in stocks. Such eases financial conditions and could potentially stoke inflation. Another consideration comes from the Apollo chart below. If the Fed’s last hike was in July, then historically, the Fed may only be 4-5 months from cutting rates. We caution the previous few years have been far from normal, so prior Fed behaviors may not hold up well.
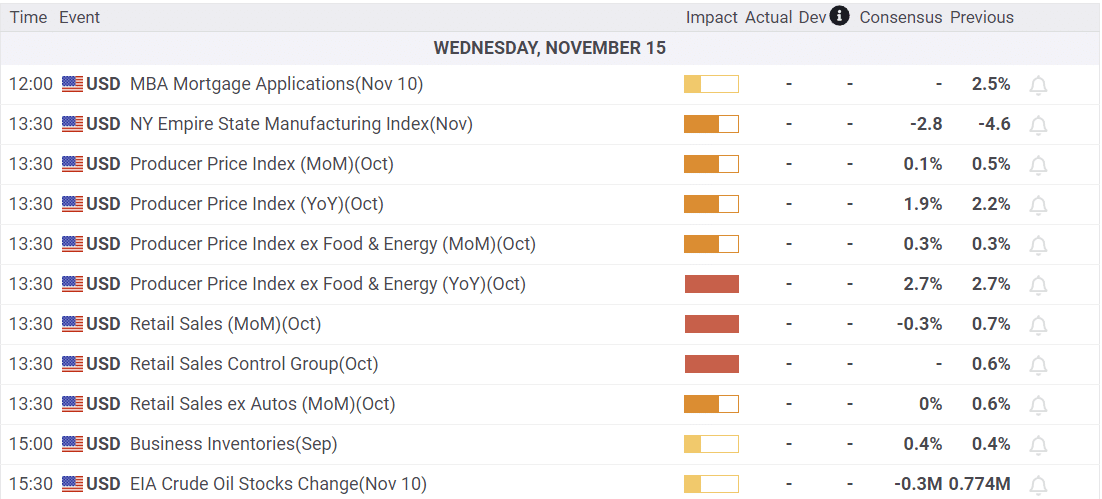
What To Watch Today
Economics
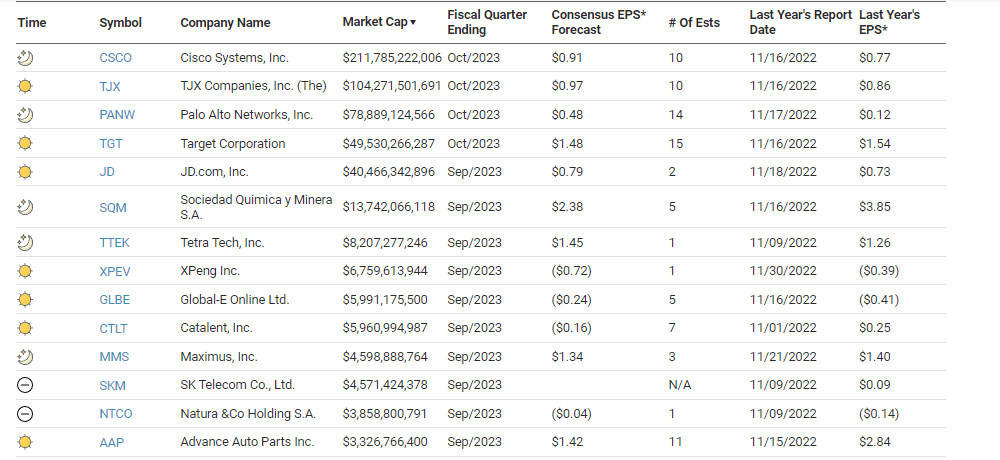
Earnings
Market Trading Update
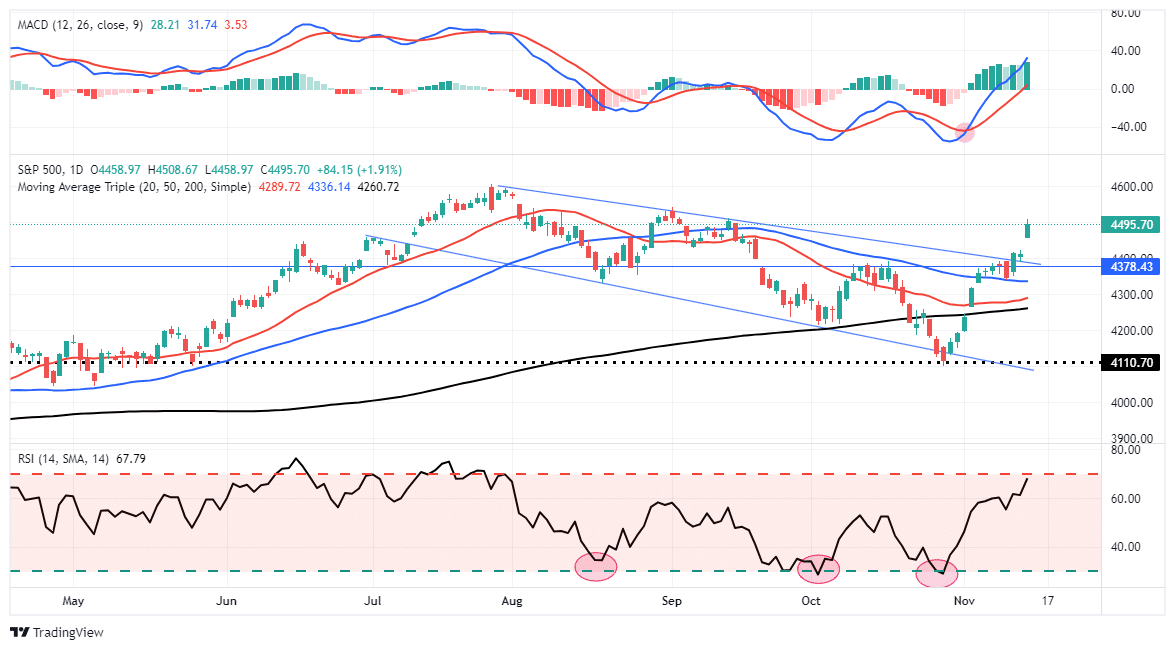
Wow. Following yesterday’s weaker-than-expected CPI report, the shorts were brutalized in a massive broad market surge higher, with growth stocks leading the charge. The realization that the Fed is now done hiking rates, led to market participants anticipating when rate cuts would occur. While this is premature, given only two recent reports showing weakness, the massive short market positioning in both stocks and bonds, combined with negative sentiment, was all that was needed for this rally since the beginning of the month.
“Yesterday, the market retested the breakout of the previous downtrend line resistance from the July highs. With the market turning that previous resistance into support, it further solidifies the bullish tone the market has taken since the beginning of July. Much like October of 2022, the bottom of that selloff was marked by the technical thrust higher beginning in November.”
With Tuesday’s surge higher, the break above the downtrend is now support for any short-term correction. As we have noted since the end of October, investors should look for opportunities to add exposure heading into December. The next best opportunity for a pullback to support will likely be in the first two weeks of December when mutual funds distribute their annual gains, dividends, and income. Such a pullback will set the market up for a year-end rally as portfolio managers “window dress” portfolios for year-end reporting.

The Technology Two
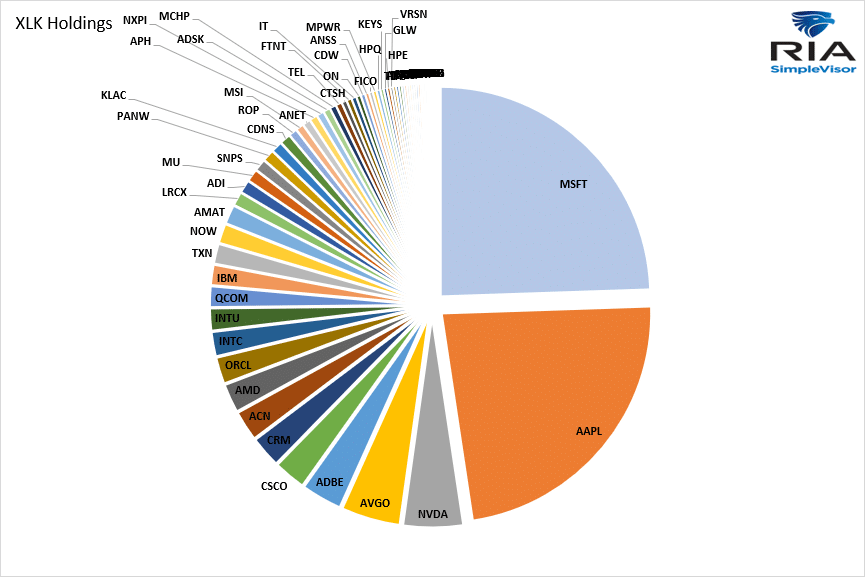
Yesterday’s Commentary shared SimpleVisor analysis highlighting the recent strong relative outperformance of the technology sector. In particular, the analysis focused on the well-followed technology ETF XLK. The analysis makes it appear that the whole technology sector was doing well, however, that is not necessarily true. The fact of the matter is that two stocks overwhelmingly drive XLK’s performance. The pie chart below shows that Apple and Microsoft make up nearly 50% of XLK. The next largest stock, NVDA, only comprises 4% of the ETF despite being nearly half the size of Apple and Microsoft. As goes Apple and Microsoft, go XLK!
China Trade Tensions Are Having An Impact
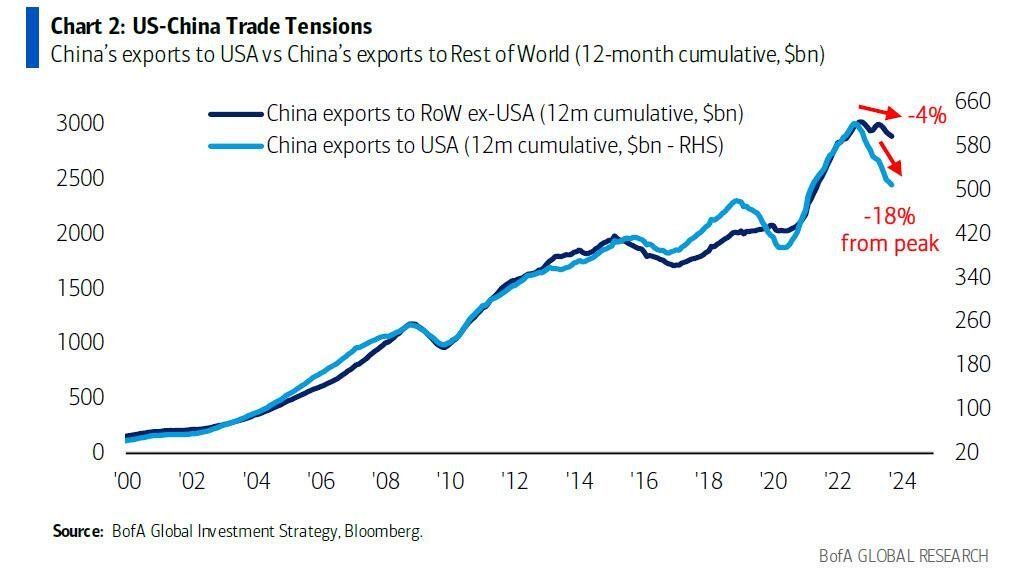
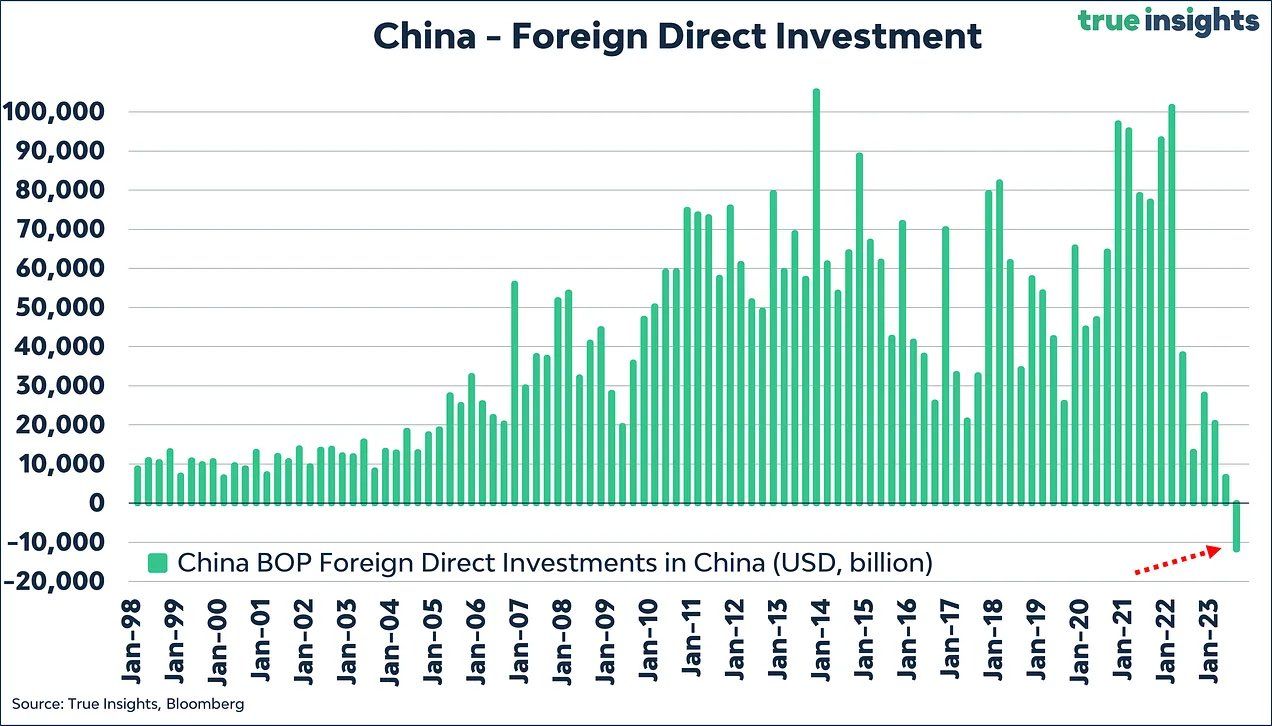
Trade tensions between the U.S. and China are starting to have an impact. As shown below, courtesy of BofA, China’s exports to the U.S. are down 18% from their peak. At the same time, their exports to the rest of the world are down 4%. Further evidence is shown in the second graph, courtesy of true insights. It shows that foreign direct investment into China is negative for the first time since at least 1998. Some of the disinvestment from China is a function of much higher interest rates in the U.S. versus China.
These two charts help partially explain why China’s economic growth, post-pandemic reopening, has been much weaker than experienced by the U.S. and most other developed economies.
Tweet of the Day
Please subscribe to the daily commentary to receive these updates every morning before the opening bell.
If you found this blog useful, please send it to someone else, share it on social media, or contact us to set up a meeting.
Also Read


