


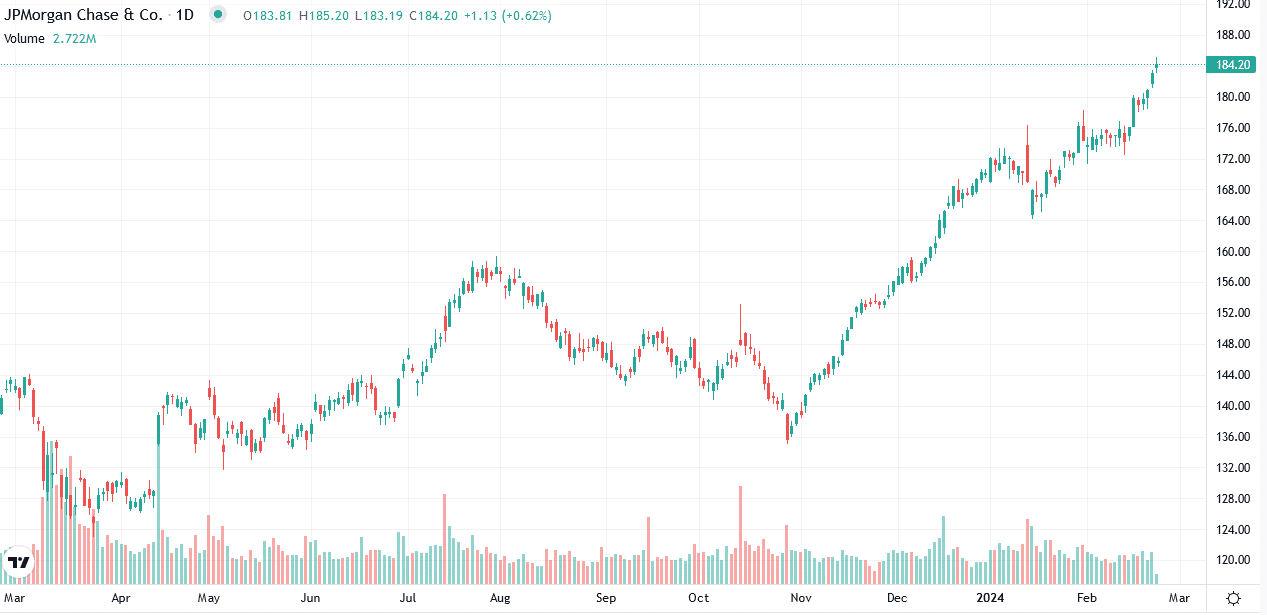
JP Morgan CEO Jamie Dimon sold $150 million of his JPM shares, marking the first time he has sold JPM shares. Jeff Bezos has sold 50 million shares of Amazon since the beginning of the month. Furthermore, Mark Zuckerberg, CEO of Meta, has sold $1 billion worth of stock this year. Because these vast sales are from the CEOs of a few of the largest companies, it may be tempting to follow alongside them. Before pushing the sell button, there are other factors worth considering. For instance, CEOs and other insiders have limited windows in which they are allowed to sell stock. Therefore, the cluster of CEO sales in recent weeks may have more to do with said windows. Further, insiders may sell for various reasons, many of which do not include the expected stock or corporate performance. CEOs and other insiders are not allowed to trade on inside information.
The research is mixed on whether insider sales portend weak stock performance in the future. A study by Dallin Alldredge and D. Brian Blank looked at over 2.5 million insider trades from 1987 to 2019. It turns out the trades of those highest in the corporate pecking order, like the CEO, tend to be most predictive. Insider sales occur for many reasons but keep in mind that CEOs know a lot more about their company than investors. Further, Jamie Dimon has tremendous insight into the economy and the Federal Reserve. Might his $150 million sale be a warning, or is he simply taking a few chips off the table, given JPM’s recent performance?
What To Watch Today
Earnings
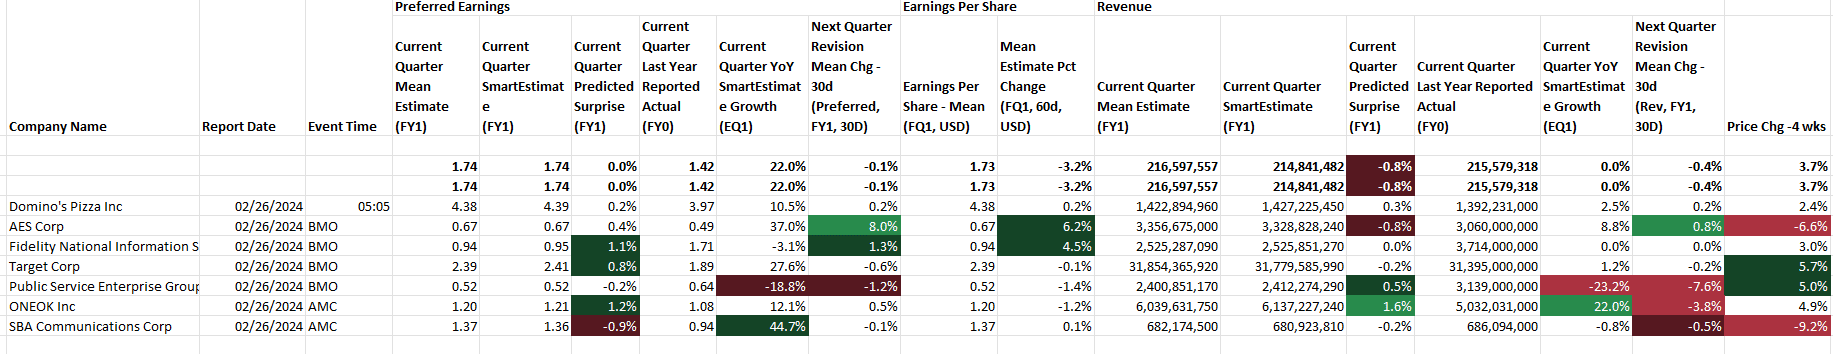
Economy

Market Trading Update
The rally continued this past week, spurred higher by Nvidia’s blowout earnings report Wednesday night. After a brief test of the 20-DMA, the market surged to new all-time highs on Thursday, confirming the ongoing bullish trend. As shown, the 20-DMA continues to act as key support for the market for now.
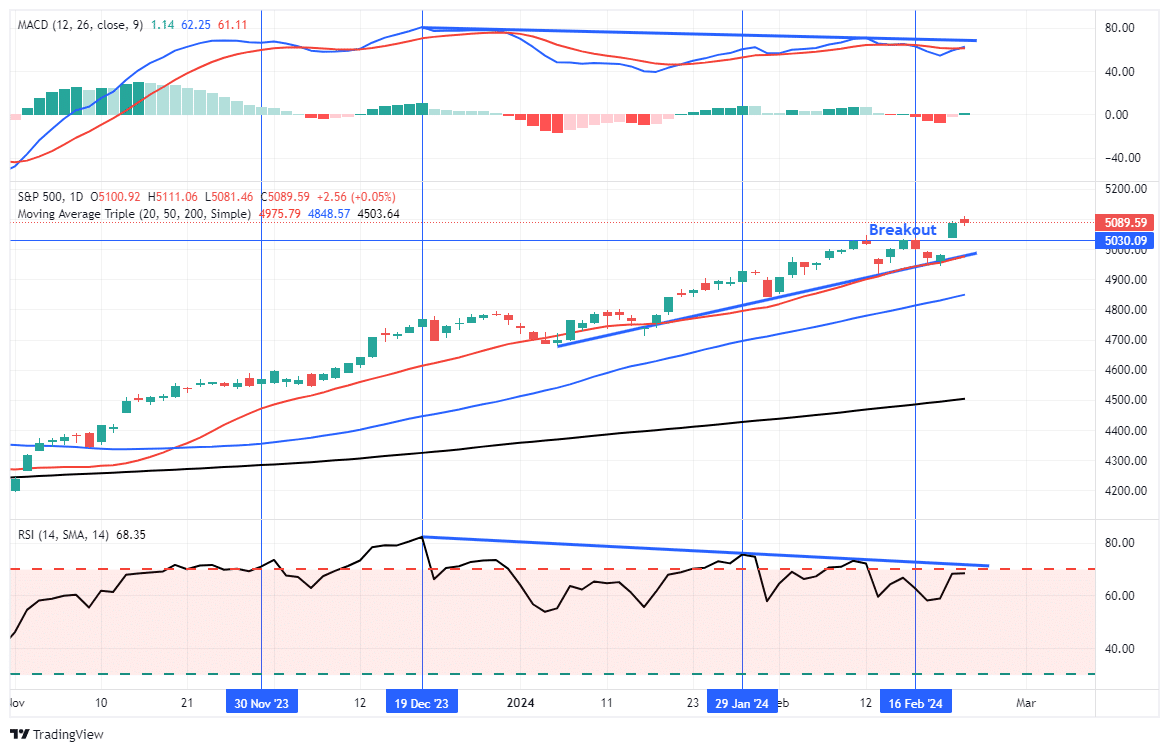
The negative divergence in both momentum and breadth (chart below) continues to be of concern, suggesting a short-term correction is likely. With the bulk of earnings season behind us, the focus will return to the Fed and the economy.
Given the more speculative action taking place in the options market, it is clear that bullish sentiment continues to remain elevated. Historically, the combination of negative divergences and bullish sentiment previously led to short-term corrections. As noted last week, we continue to suggest remaining somewhat diligent on risk management protocols.
“The 20-DMA is now the defacto “Maginot Line” for the markets. A failure at that level will likely lead to a deeper selloff. Continue to manage risk accordingly.”
We don’t know what will eventually lead to a market correction, but one will eventually occur to reverse the more extreme deviation from the 200-DMA. With the market becoming more aligned with the Federal Reserve’s expectations for rate cuts, the current outlying risk for equities is an economic slowdown that impacts earnings.

The Week Ahead
This week, the PCE prices index will be the most watched economic data point. The Fed and bond investors will look to see if PCE follows CPI and PPI higher and exceeds estimates. The estimate for headline PCE is +0.3% and +0.4% for core PCE. That compares to +0.2% for both figures last month. Additionally, regional Fed manufacturing surveys and the ISM manufacturing survey will better inform us of the state of manufacturing. Manufacturing has been in contractionary territory for over a year, but there are indications it may be improving. The prices paid and received components of these measures will also be important.
Per usual, there will be a host of Fed speakers. It has become clear most Fed members do not feel rushed to cut rates. However, with the FOMC minutes from last week alluding to reducing the amount of QT, we will look for comments on when such a reduction could start and how much it may entail.
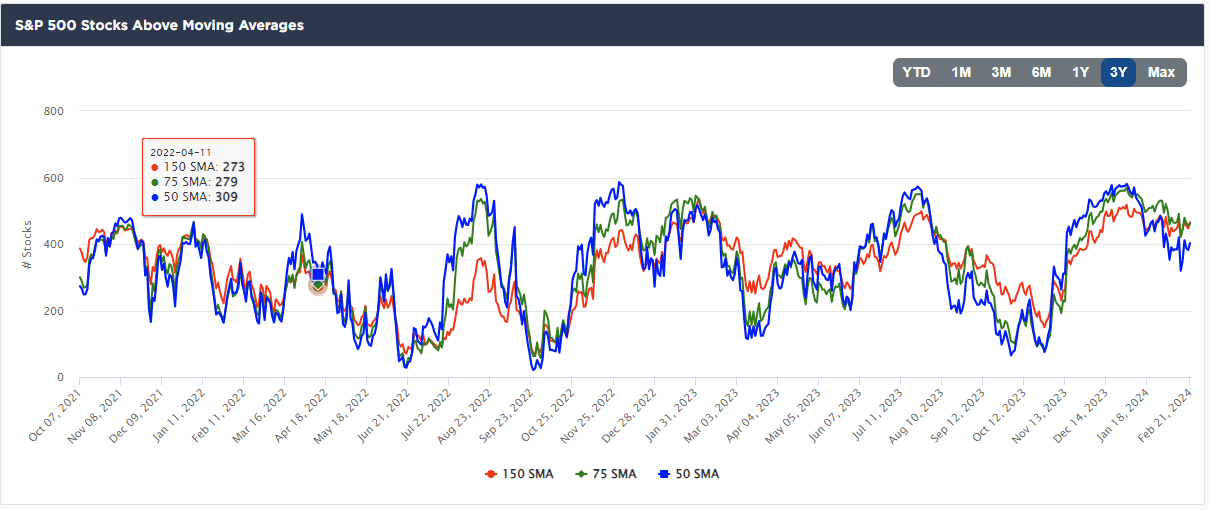
Bad Market Breadth Can Be Dangerous To Your Wealth
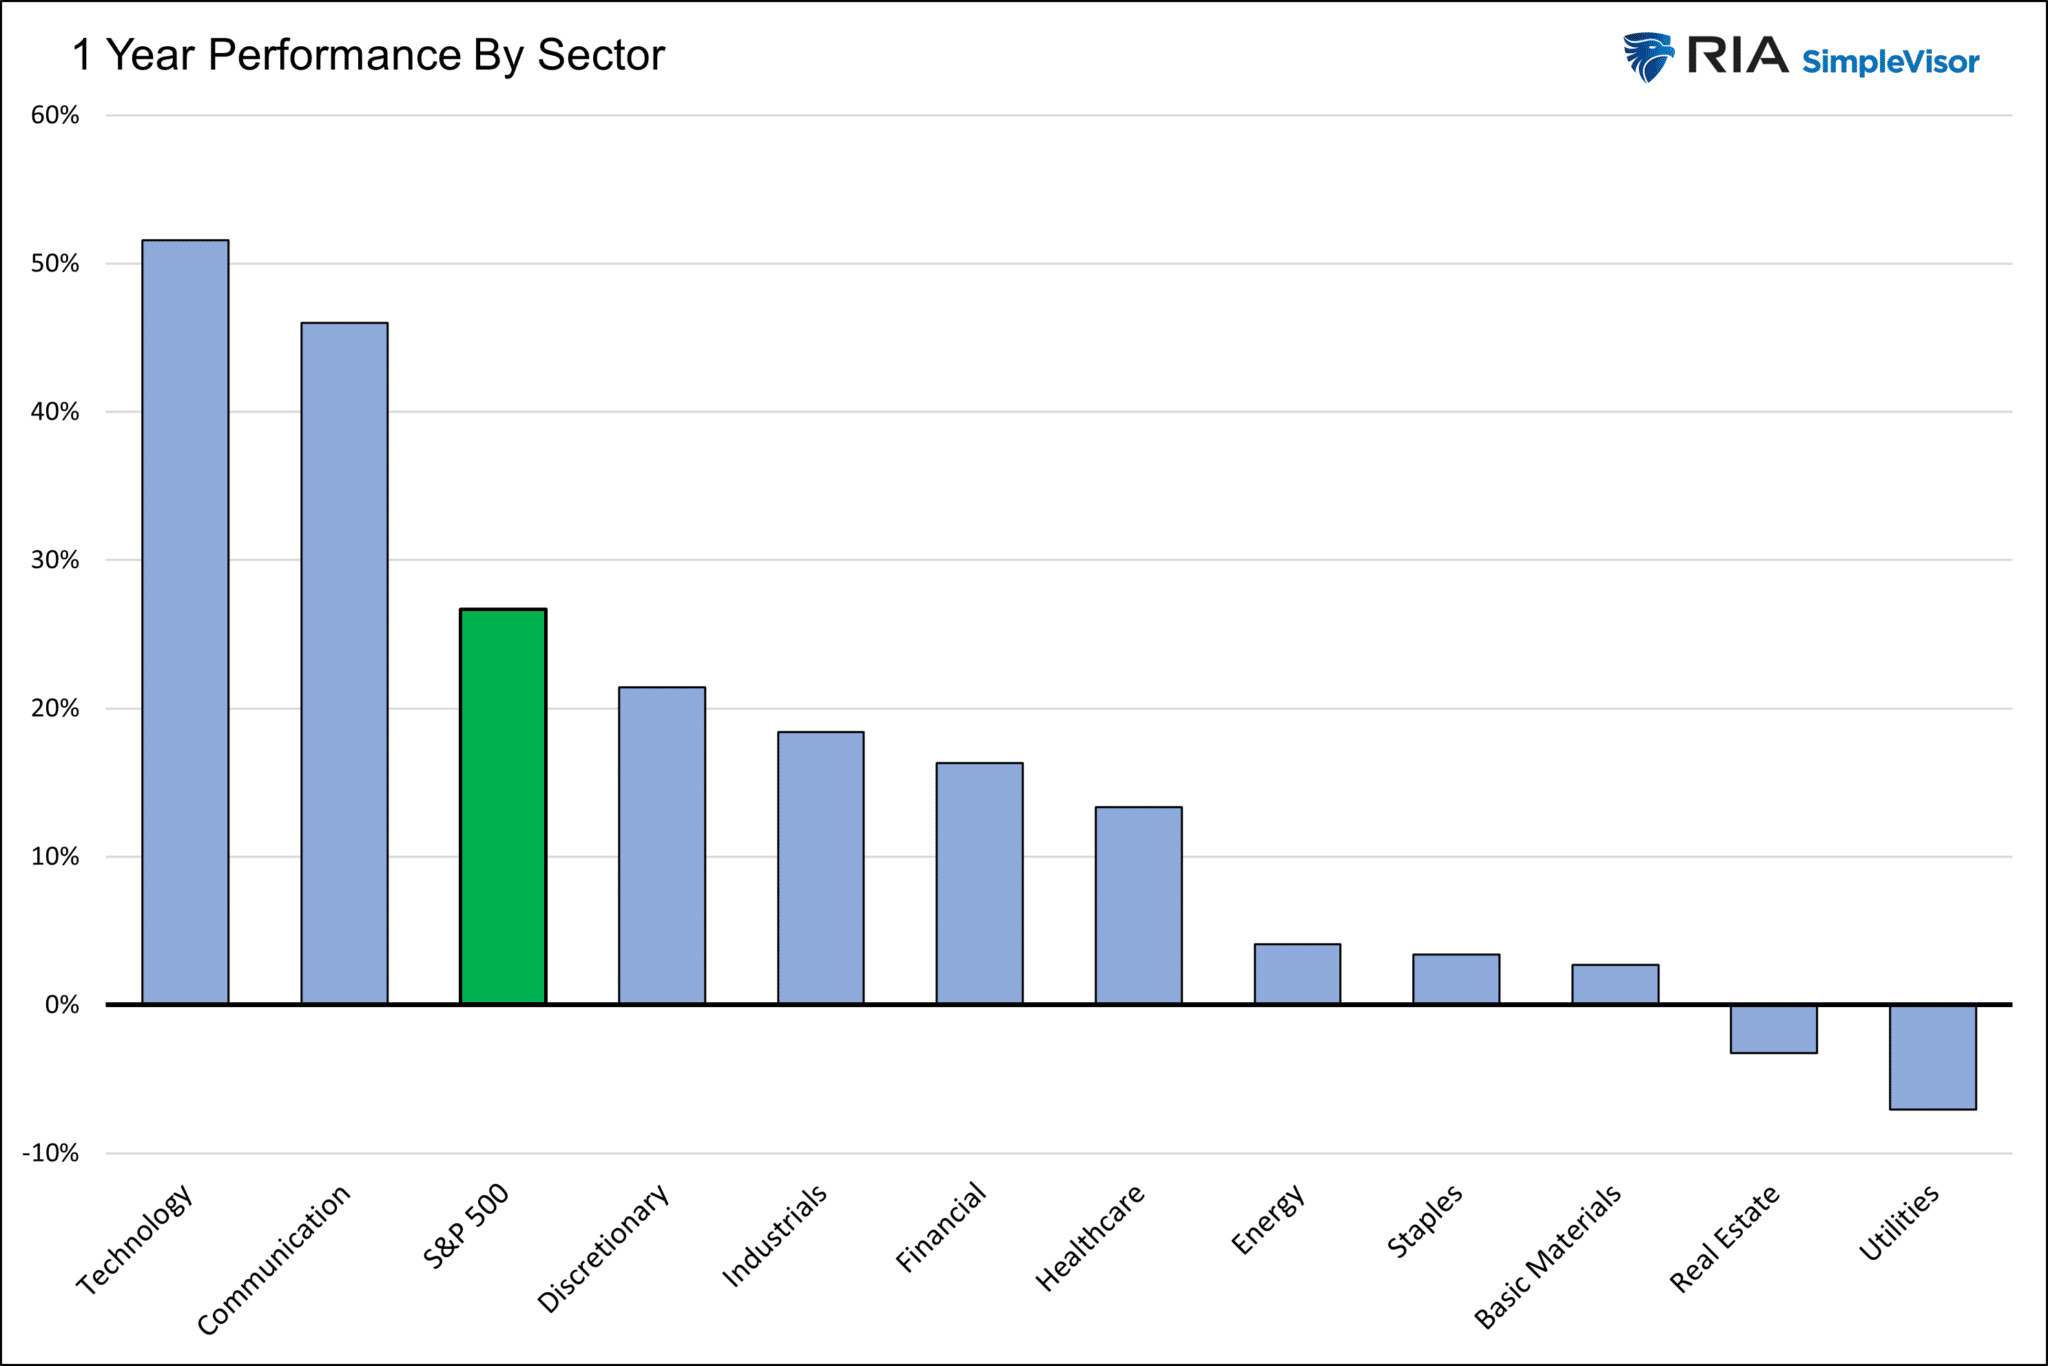
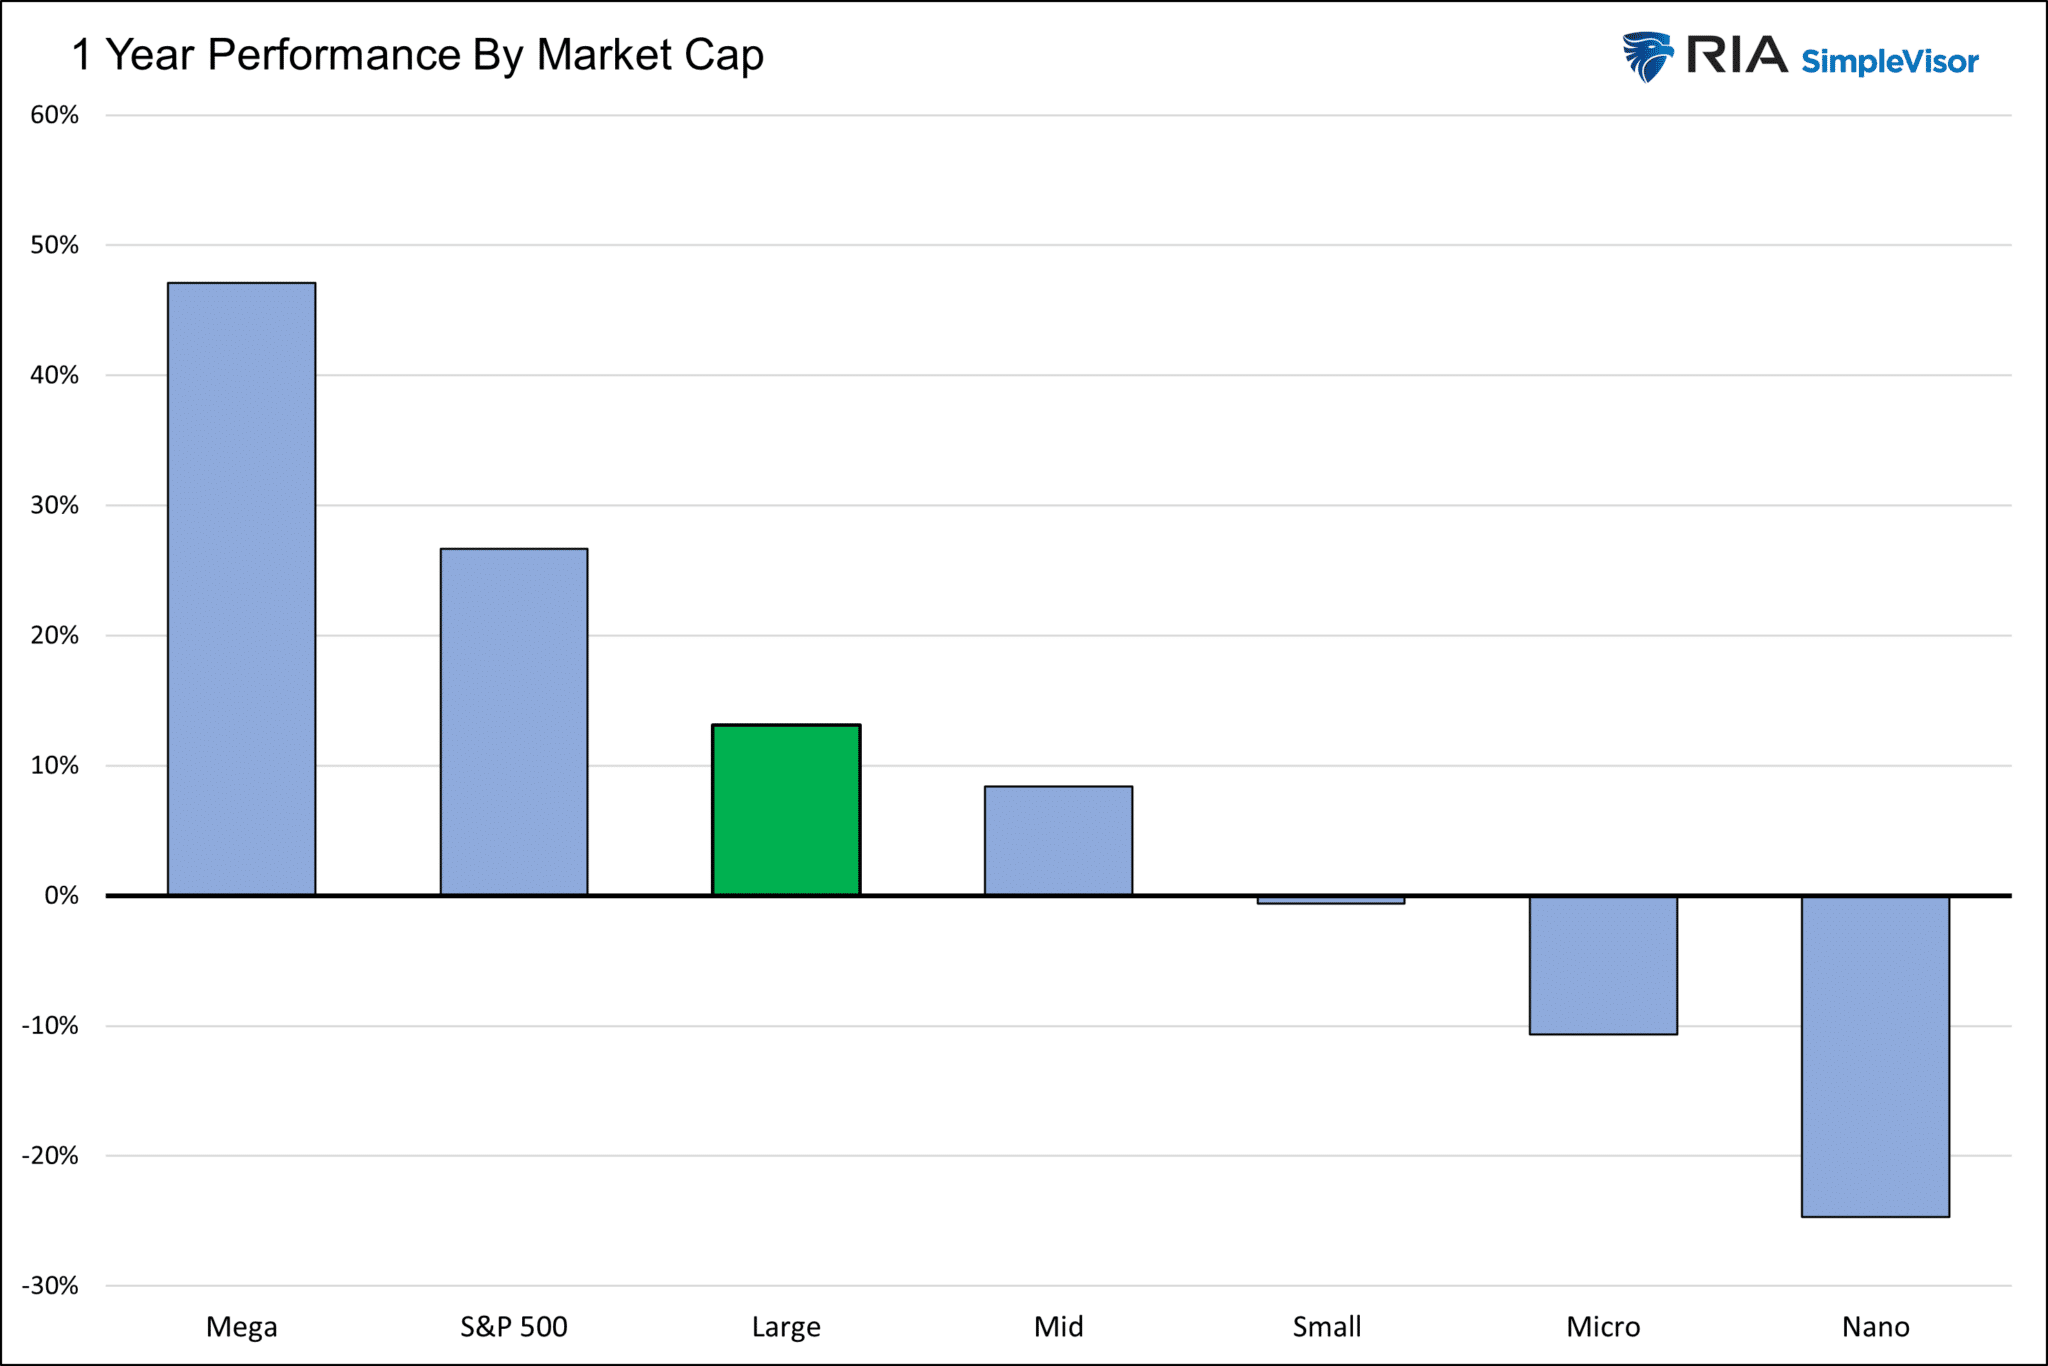
Over the past year, we have written plenty on the bad market breadth. Simply, a few stocks are grossly outperforming the vast majority of stocks. The first two graphs below show the massive difference in the returns by sector and market cap. We must ask the following questions: Is the divergence extreme, and if so, what has happened in similar instances in the past?
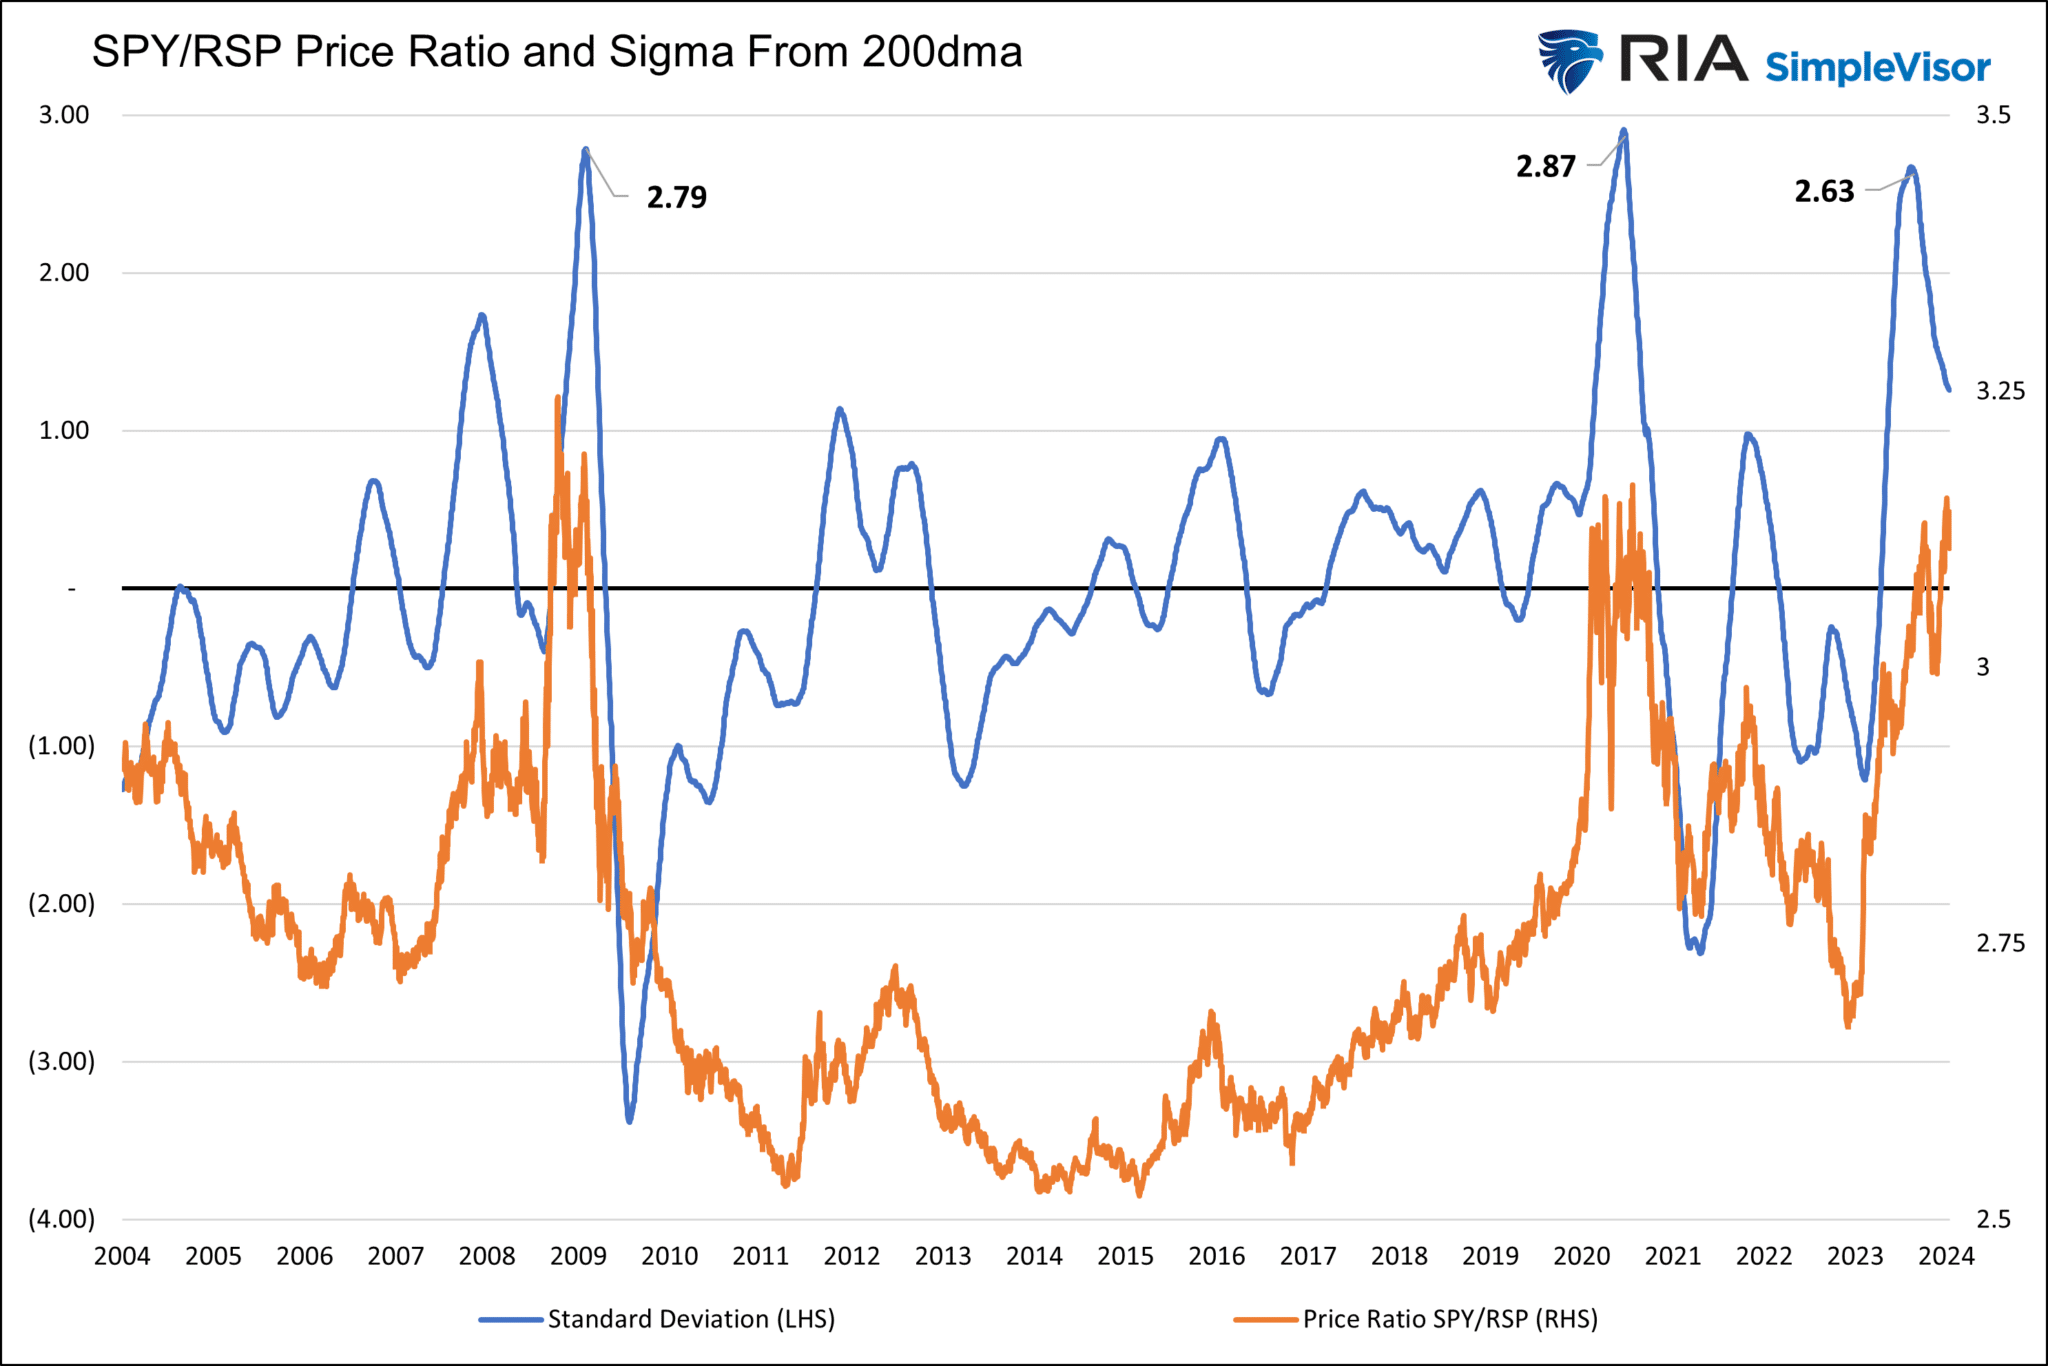
We present the third graph below to contextualize the recent poor market breadth and assess what may happen going forward. The orange line shows the price ratio of SPY and the equal-weighted S&P 500 ETF, RSP. As shown, the ratio is approaching the prior peaks of 2008 and 2020. After each peak, RSP grossly outperformed SPY. The blue line is the standard deviation (sigma) of the ratio versus its 200-day moving average. The ratio’s sigma just topped near the two prior peaks. In 2008, the sigma and ratio peaks were aligned. In 2020, the ratio lagged the rapidly declining sigma by a few months.
Assuming the past is prescient, the recent peak should serve as a warning that the dominance of the Magnificent Seven and a few other stocks may be in its last innings. This doesn’t necessarily mean the major stock indexes will fall, but it may signal a change in market leadership.
Tweet of the Day
“Want to have better long-term success in managing your portfolio? Here are our 15-trading rules for managing market risks.”
Please subscribe to the daily commentary to receive these updates every morning before the opening bell.
If you found this blog useful, please send it to someone else, share it on social media, or contact us to set up a meeting.
Also Read


