


The markets went through an extended period earlier this year where bad news was good news. The logic is that bad economic news would raise the prospect that the Fed would relent on rate hikes sooner than expected. Following the FOMC last week, investors seem to understand better the Fed is not close to pivoting even if economic data continues to weaken. It appears bad news is once again bad news for the markets. The Fed clarified that weak economic data would not derail their hawkish policy until inflation is closer to 2%. The Fed estimates GDP growth will be minimal as such bad economic news is already factored into their 2023 Fed Funds forecast.
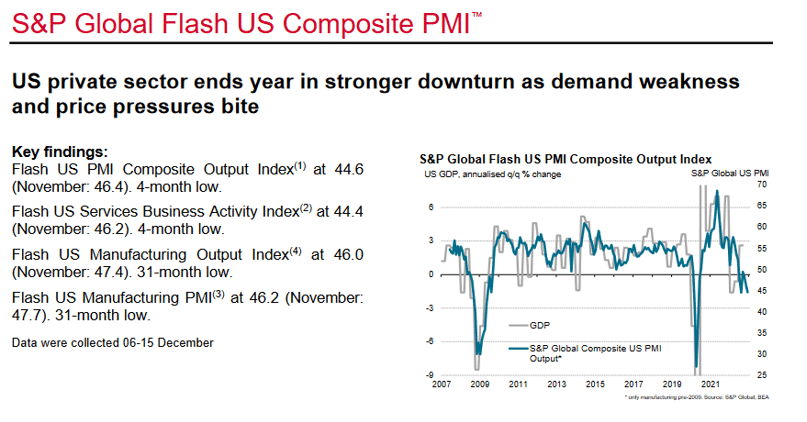
Weak retail sales drove the market lower on Thursday. On Friday morning, the markets were clawing back from a negative opening until weaker than expected PMI data pushed it back down. The manufacturing and services PMI reports came in moderately below estimates. Further, they are both below 50, indicating economic contraction. As shown below, the last two recessions were accompanied by sharp declines in the composite PMI.
What To Watch Today
Economy
10:00 a.m. ET: NAHB Housing Market Index, December (34 expected, 33 prior)
Earnings

Market Trading Update
Last week, we suggested the Fed would likely be more “hawkish” following a report from Nick Timaros of the WSJ suggesting the Fed would lay out further rate increases.
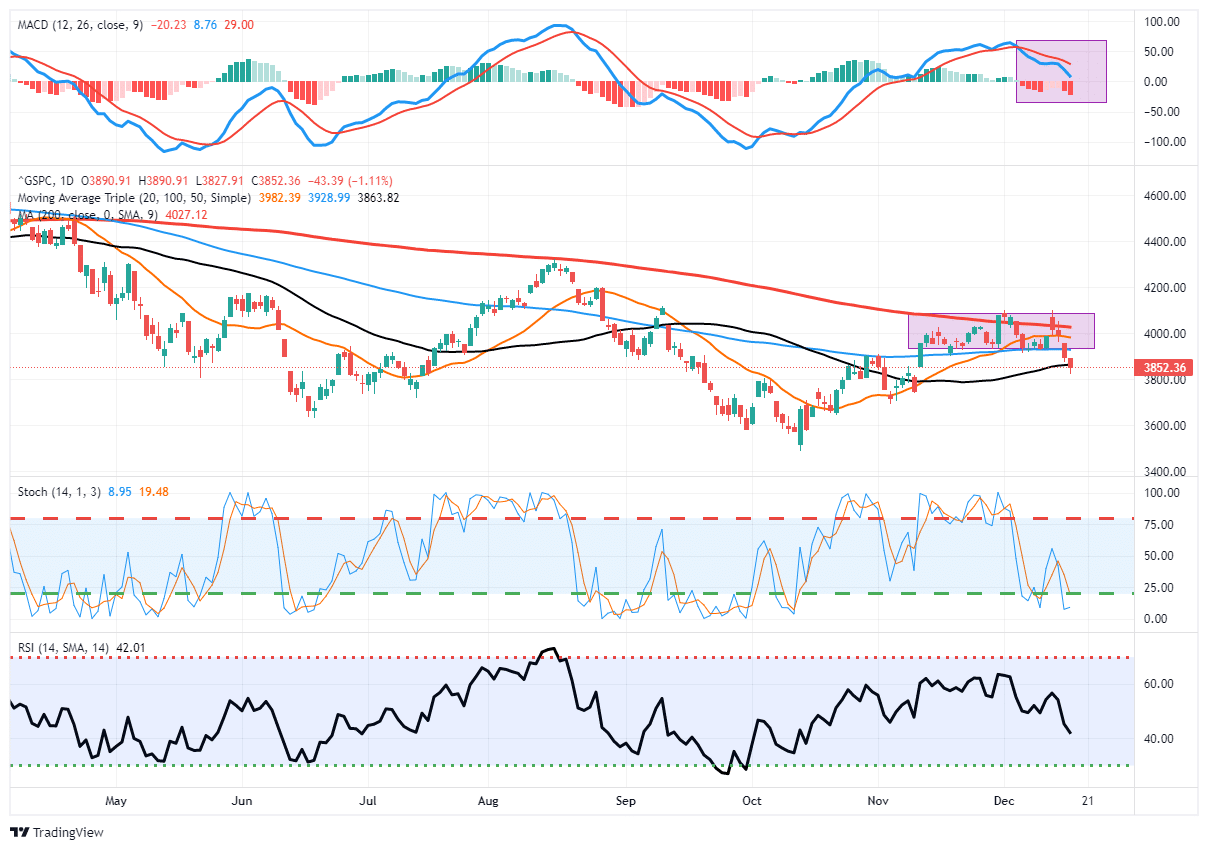
This past week, the CPI report did come in a bit weaker than expected, sending the market surging early in the day above the 200-DMA and the downtrend line. However, it could not hold those gains ahead of the Fed meeting. As we will discuss next, Jerome Powell was indeed more hawkish than expected, signaling further rate increases and making clear that no “pivot” was coming. That one-two punch sent stocks tumbling and wiped out the entirety of the “weaker CPI” rally from early in the week.
The MACD sell signal remains a good signal NOT to get sucked into rally attempts. Remaining cautious has served readers well over the last several weeks. The good news, if you want to call it that, is the 50-DMA held on Friday and sets the market up for a “Santa Rally” into year-end. The not-so-good news is that the rally may be somewhat limited, given the downside break of the recent consolidation range, which will provide overhead resistance.
Historically, the last two weeks of December and the first week of January tend to be positive as portfolio managers “window dress” into year-end for annual reporting.
Yale Hirsch first documented the pattern in 1972, writing in “Stock Trader’s Almanac” that the S&P 500 had gained an average of 1.5% during that seven-day period from 1950 through 1971. The pattern has remained true to today. Since 1950, the broad market index has increased an average of 1.3%.
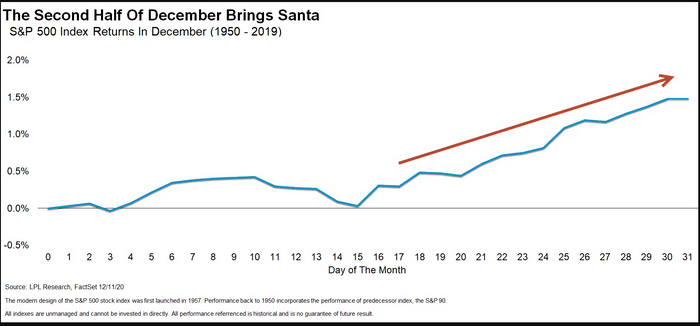
While this seasonal period does have a statistically high probability of being positive, such does not mean it “must” be. There are years when “Santa Failed To Visit.”
The Week Ahead
The Fed’s self-imposed media blackout is over, and Fed members are free to share their thoughts on monetary policy publically. We are likely to get a wide range of opinions. Some will caution that interest rates are now near the point where risks are balanced or even skewing toward the Fed having overtightened. Others will want to remain vigilant in the inflation fight. These members will make it clear the Fed wants to keep Fed Funds at 5% or higher throughout 2023 and possibly beyond.
The week’s most important piece of data, PCE inflation, will come on Friday. Because Friday is Christmas Eve-Eve, many market makers will be thinly staffed, and liquidity could be problematic. Any upward or downward surprises in the Fed’s favored inflation report may cause significant market moves. Housing data will be released throughout the week, including the NAHB Index, Building Permits, Housing Starts, and Existing Home Sales. These numbers will likely be weak as high mortgage rates weigh heavily on the sector.
The Philadelphia Fed Questions the BLS
The Philadelphia Fed released an interesting research piece arguing that the BLS estimate of job growth in 2022 may be way off the mark. To wit:
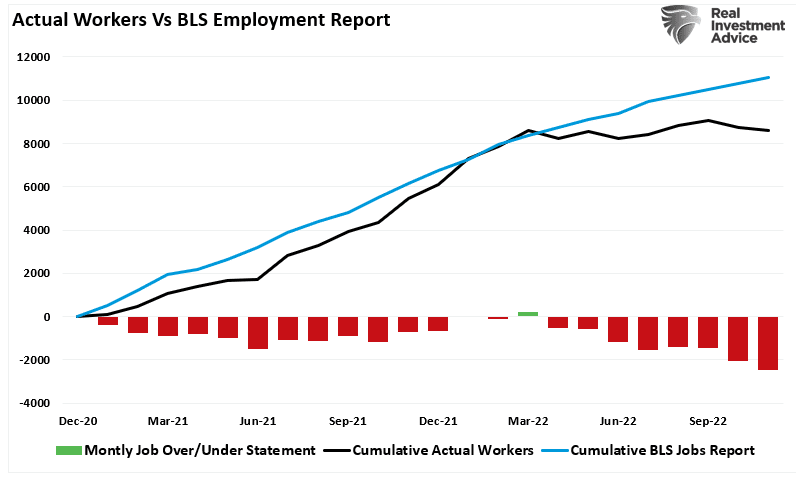
In the aggregate, 10,500 net new jobs were added during the period rather than the 1,121,500 jobs estimated by the sum of the states; the U.S. CES estimated net growth of 1,047,000 jobs.
The BLS hastily puts together the employment data, making its report timely. As a result, they heavily rely on statistical analysis and exclude a considerable amount of data that will not be complete for a few weeks. The Philadelphia Fed recently aggregated the job growth reported by each state. As shown below, per the Philadelphia Fed, the BLS may have overestimated job growth by over 2mm jobs. Who is right? The truth may likely lay somewhere in the middle. If the labor markets were much weaker, why are jobless claims still residing near record lows and JOLTs still reporting a near-record number of job openings? Further, wages continue to climb at a good clip, not what one would expect if there were no job growth for six months. Regardless of how you quantify the jobs market, the labor market is still historically tight.

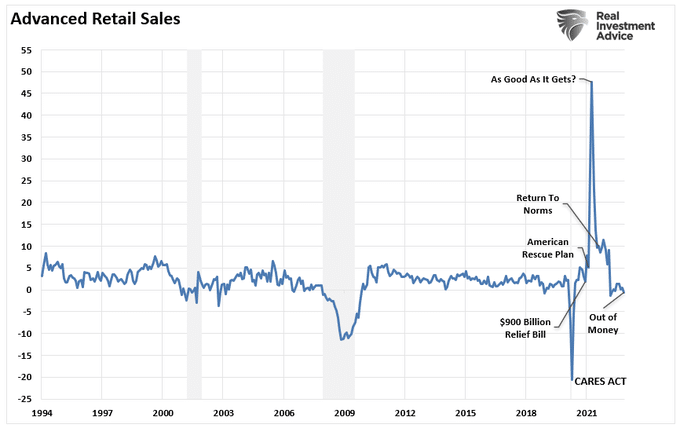
The Pig In The Python
In 2020 and 2021, the Government flooded the economy with money in the form of stimulus payments. At the same time, in its infinite wisdom, it shut down manufacturing and production. Those actions created a massive demand surge when there was no supply, giving us the current inflation. As you can see, that “pig in the python” is now beginning to exit and will likely lead to a much more rapid retreat in consumption and, ultimately, economic growth than many expect.
Here is the math: Retail Sales make up ~40% of Personal Consumption Expenditures (PCE) which comprises ~70% of the GDP calculation.
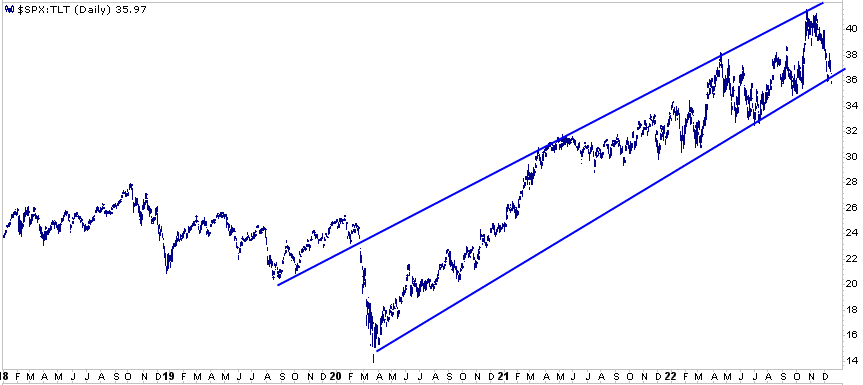
Stocks vs. Bonds
Over the past few months, we have written two articles (LINK 1 LINK 2) sharing fundamental analysis that argues bonds may outperform stocks in both the short and long term. The graph below compares the price ratio of the S&P 500 to the UST bond ETF TLT. It supplements our analysis with a technical backdrop. The graph shows bonds grossly outperformed stocks in early 2020 as the pandemic started, and investors flocked to the safety of Treasury bonds. However, when the fiscal and monetary engines rode to the rescue, stocks took off relative to bonds. The upward trend continued through 2021 when the stimulus flowed freely. This year both stocks and bonds are down due to high inflation and the Fed’s aggressive removal of monetary stimulus. However the trend continued upward in its channel. Over the last three years, the ratio has formed a clearly defined channel pattern.
Looking ahead, the ratio can break below the channel in a combination of ways. For instance, if TLT returns to its late 2021 highs and the S&P stays at current levels, the ratio would return to 25. Conversely, TLT can remain at current levels, and the S&P 500 declines to 2800 to achieve the same result. More likely, a combination of equity weakness and bond strength will cause the ratio to normalize.
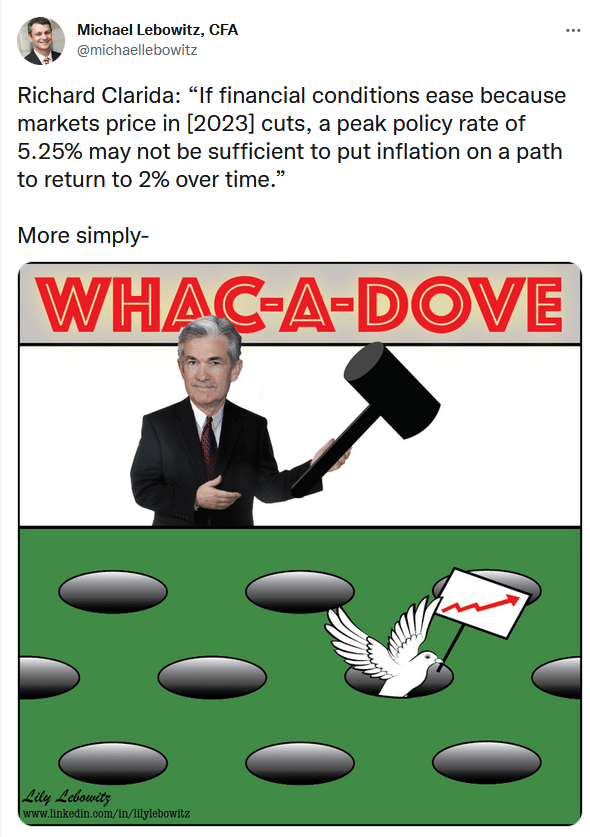
Tweet of the Day
Please subscribe to the daily commentary to receive these updates every morning before the opening bell.
If you found this blog useful, please send it to someone else, share it on social media, or contact us to set up a meeting.
Also Read


