


In this issue of “Stimulus. No Stimulus. Market Bounces With Headlines.”
- Market Bounces With Headlines
- Back To Excess Optimism
- Bull Now, Bear Later
- Portfolio Positioning Update
- MacroView: Recessions Are A Good Thing, Let Them Happen
- Sector & Market Analysis
- 401k Plan Manager
Follow Us On: Twitter, Facebook, Linked-In, Sound Cloud, Seeking Alpha
We Need You To Manage Our Growth.
Are you a strong advisor who wants to grow your practice? We need partners we can work with to manage our lead flow. If you are ready to move your practice forward, we would love to talk.

Catch Up On What You Missed Last Week

Market Bounces With Headlines
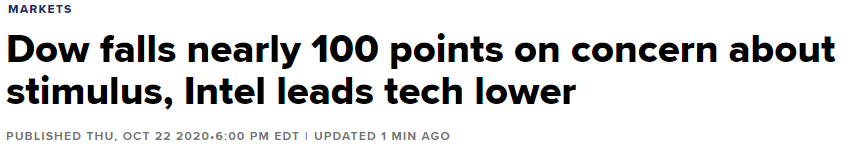
Over the past couple of weeks, markets haven’t paid much attention to the economic or earnings data but have drifted from one “stimulus” headline to the next.
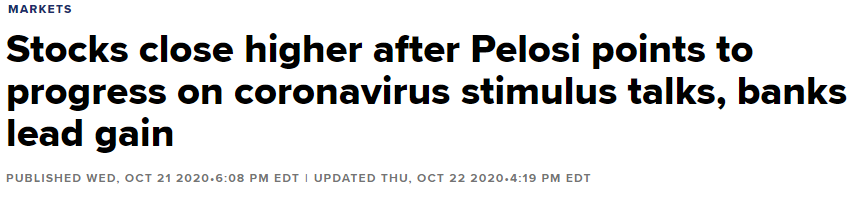
You get the idea. The daily swings of the market have made it tough to navigate. However, as discussed Monday in our “3-Minutes” video, indicators were already suggesting price action would be weak.
Such was the case as stock prices drifted lower on the daily disappointment of failed stimulus talks.
Deal Or No Deal
The lack of stimulus is NOT surprising. As we stated on the #RealInvestmentShow many times, there is “no incentive” for either side to pass “stimulus” before the election. If the stimulus passes, President Trump will get credit for providing aid to the American people. Such a “feather in the cap” would be something the Democrats are unwilling to provide.
Zerohedge came to the same conclusion on Friday:
“House Speaker Nancy Pelosi told MSNBC a stimulus bill ‘can be passed before the Nov. 3 election if President Trump cooperates.’ However, hedging that statement, she stated that Trump has been ‘back and forth’ on a deal. She also added that Trump needs to get Senate Republicans to back any agreement.
In response, the White House immediately countered with Press Secretary McEnany saying Pelosi is making it harder by not budging ‘even one inch’ on her stimulus demands.”
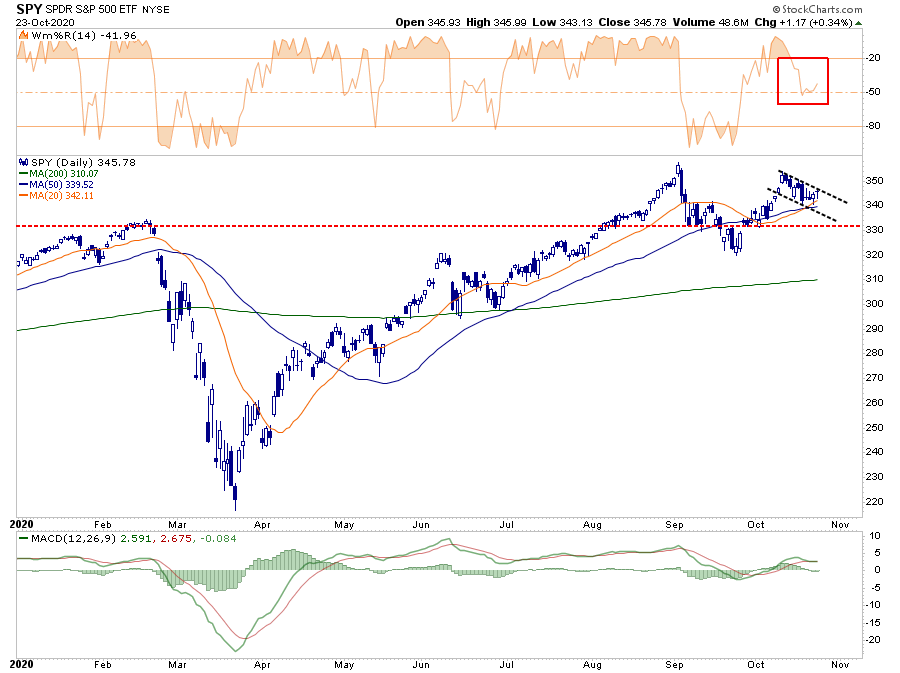
The market read between the lines and realized no “deal” is coming. While the markets were hammered initially, traders bid shares up on “hope” stimulus is still coming. The good news is that while the market remains in a downtrend, it continues to hold support at the 20-dma and 50-dma cross.

Market Back To Excess Optimism
What is most fascinating is that while Congress and the media are complaining about how the economy needs more stimulus, the market doesn’t agree. Despite the fact, there has been no stimulus passed, retail stores and the housing market have posted record sales. Restaurants are getting customers back, and credit card spending has picked up sharply from the lows, and, in Houston, traffic has returned.
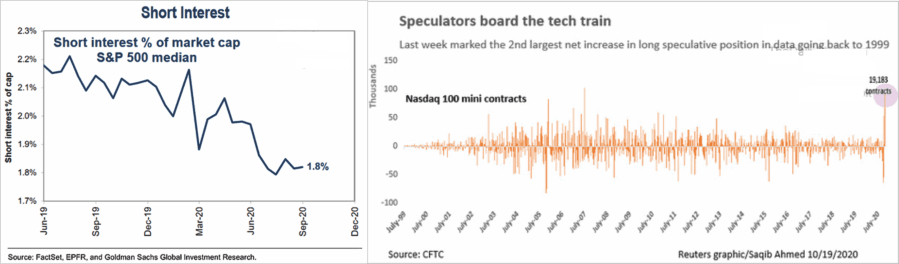
The market is also picking up on the “recovery,” bifurcated as it may be, as stock market speculation has now surged back to records in both record low short-interest and options contracts.
As I noted on Tuesday in “Bulls Are All In, Again,”
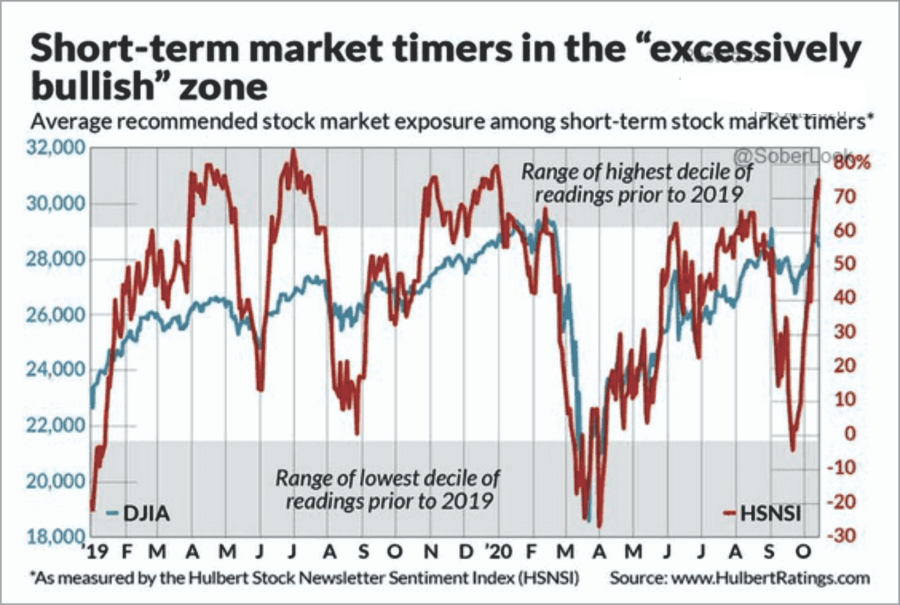
“Fed actions shifted the ‘risk appetite’ of investors through ‘perceived’ insurance against losses. As we head into a potentially contentious election, market ‘bulls’ are ‘all in’ again as hopes remain high that more ‘stimulus’ will soon come.
Since the Fed intervened in March, investor sentiment has gotten run back up to extremes despite the economy remaining amid a deep recession.”
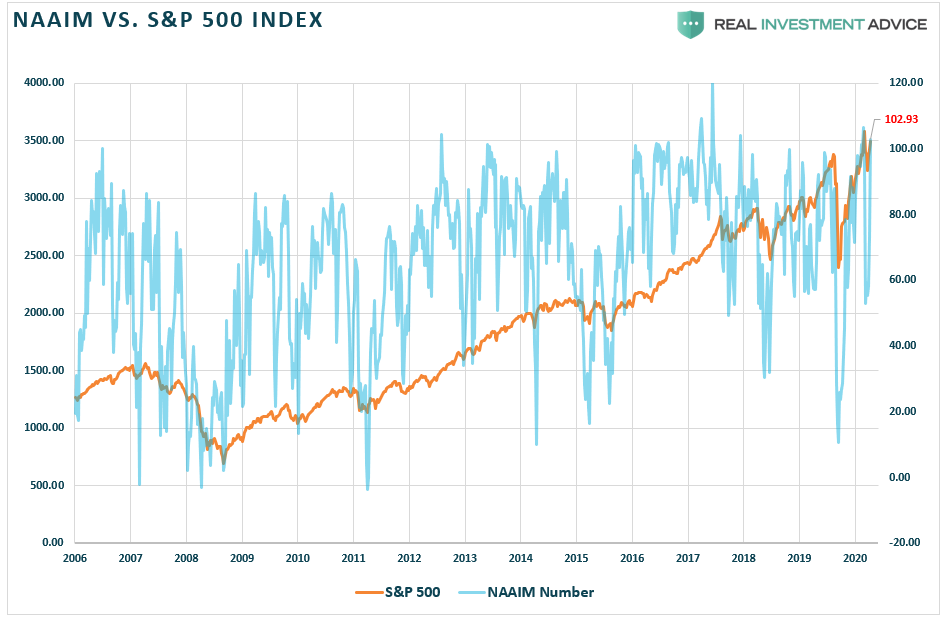
I also pointed out that professional asset managers are also back to being fully long in portfolios.
“One of the sub-components of the ‘Fear/Greed’ gauge is the NAAIM index of professional investors, which measures the percentage allocation to that group’s equities. Currently, equity allocations of professional investors are back to full weightings. While such doesn’t mean the markets are about to crash, more often than not, their ‘bullishness’ has tended to be an excellent short-term ‘contrarian’ indicator.”
However, while the stock market is wildly bullish, there is a clear disconnect with the economic recovery, such as it may be.
The Great Disconnect
There is currently a “Great Divide” between a “recessionary” economy and a surging bull market in stocks. Given the relationship between the two, they both can’t be right.
The economy, earnings, and asset prices over time are highly correlated, as shown by the chart below.
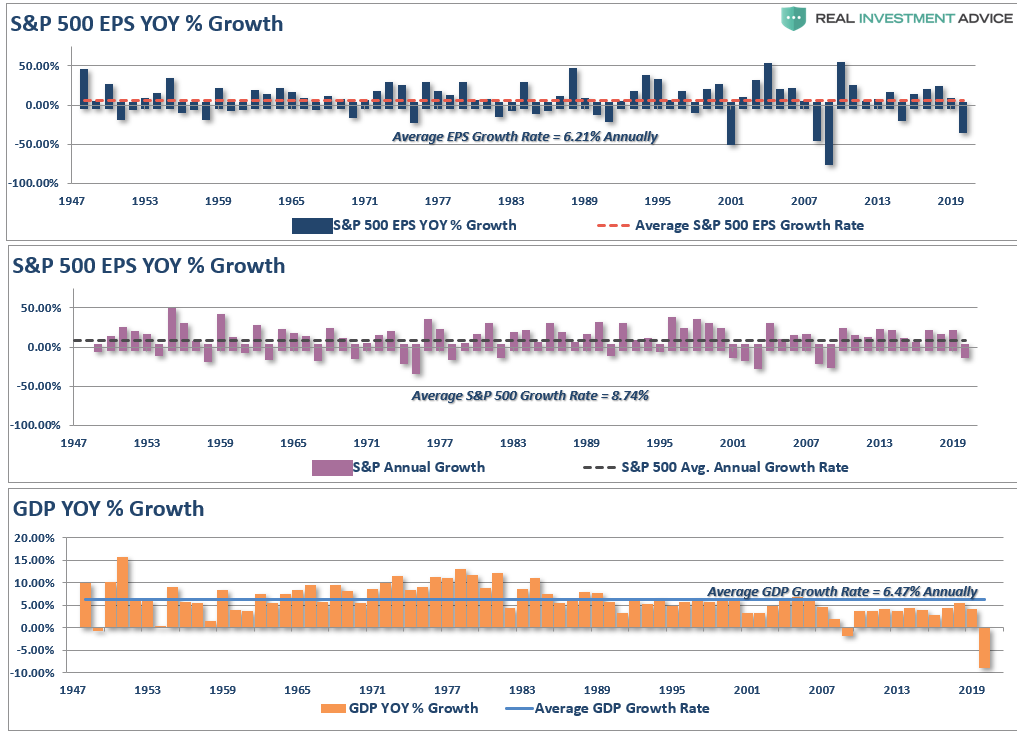
Since 1947, earnings per share have grown at 6.21% annually, while the economy expanded by 6.47% annually. That close relationship in growth rates should be logical, particularly given the significant role consumer spending has in the GDP equation.
The correlation between the two is shown in the chart below.
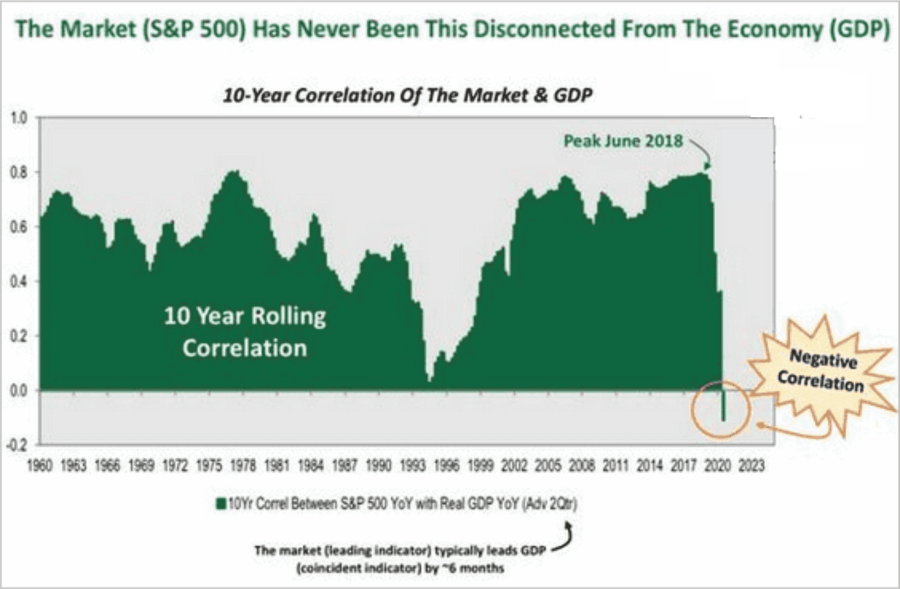
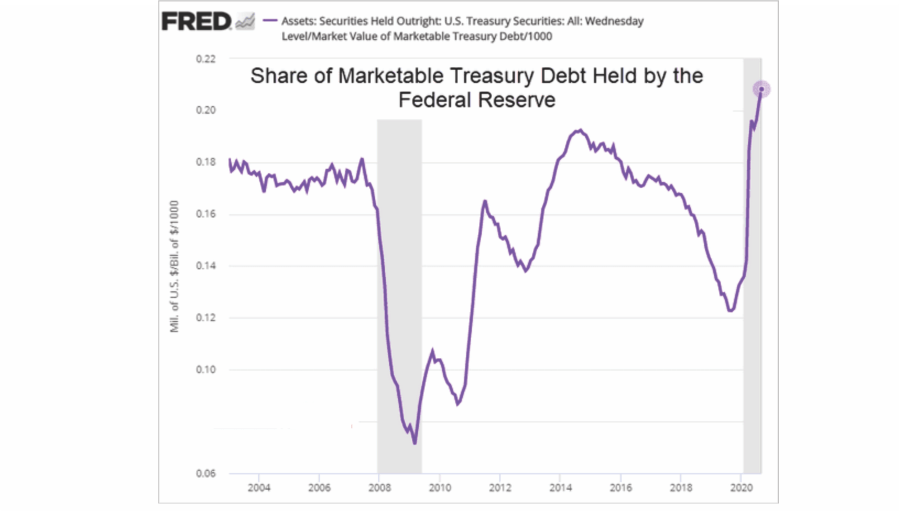
The current “negative correlation” is quite an anomaly given that corporate earnings are derived from economic activity. However, that relationship broke due to the massive amount of Federal Reserve interventions in the financial markets. Currently, the Fed owns the largest amount of the Treasury Bond market in history.
As shown above, the liquidity flowed into the most highly liquid equities (mega-caps.) Such led to a massive distortion in the markets between the vast majority of index constituents and a handful of mega-cap companies.
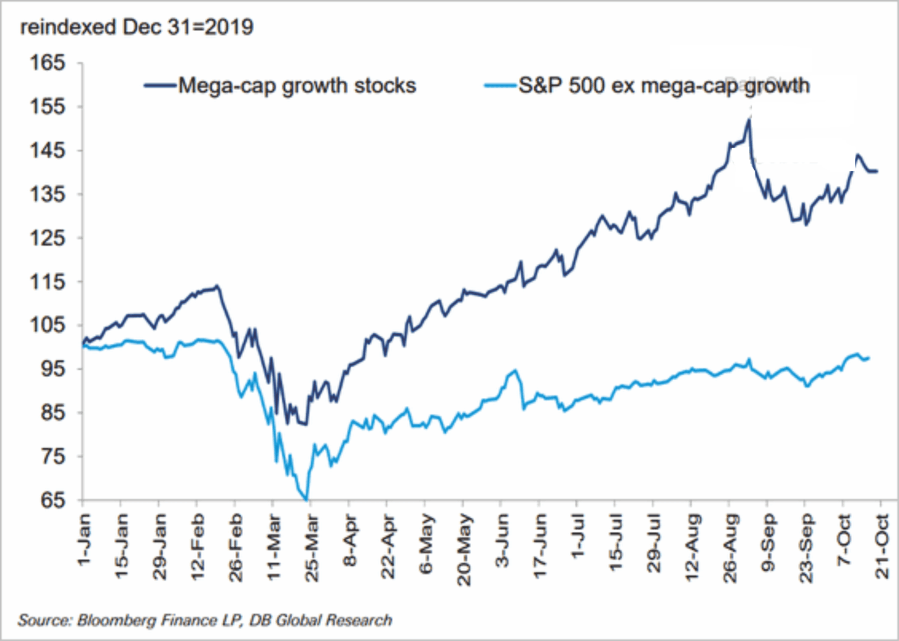
That distortion of the financial markets by the Federal Reserve has created an illusion that the stock market, which should represent the economy, is doing exceedingly well when it reality it isn’t.

Bull Now, Bear Later
The is no arguing the market is bullishly biased in the short-term. However, in the longer-term, slower economic growth rates will eventually impact companies’ ability to generate higher profit margins. Such will especially be the case in the event of Biden victory and higher tax rates.
Valuations remain problematic on many levels, but the distortion of the markets to the economy is most prevalent in the market capitalization to GDP ratio.
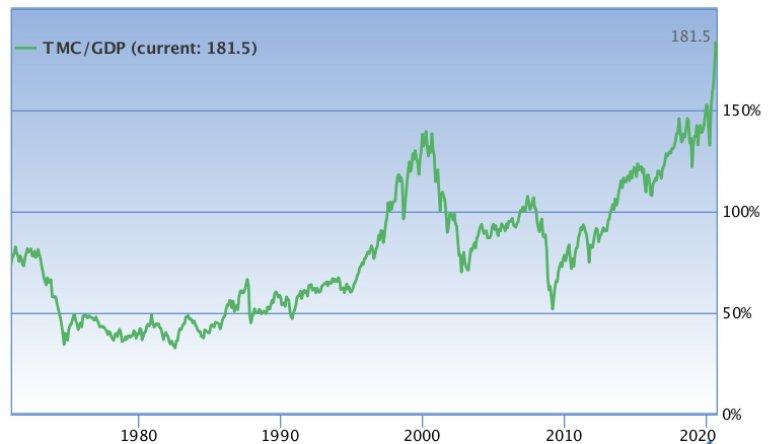
More importantly, the deviation of the market from long-term means remains extreme. With the markets overbought, extended, and, as noted above, extremely optimistic about the near-term future, the risk of a bigger correction remains elevated.
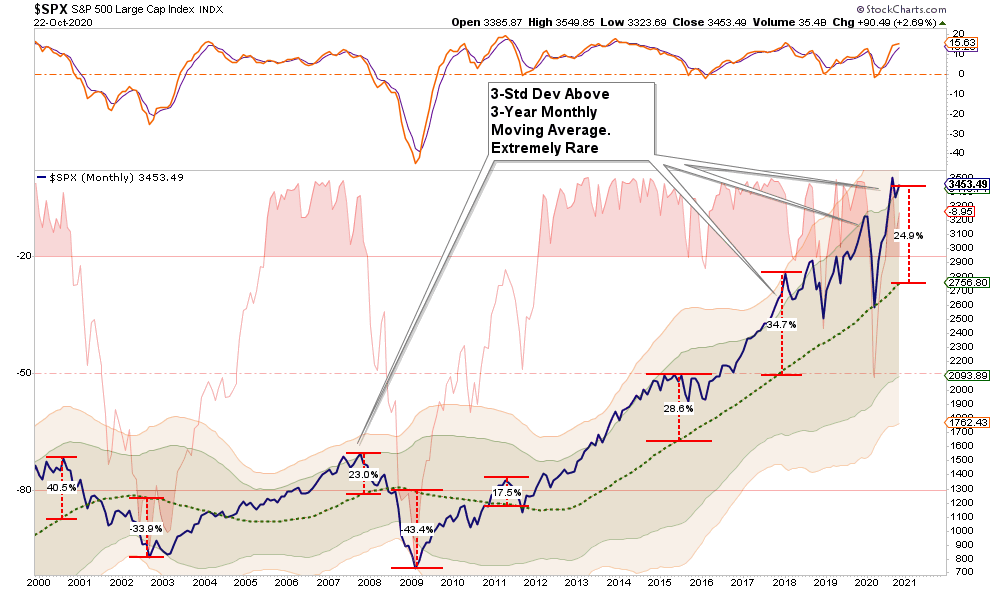
While the Federal Reserve, through its interventions, quickly abated the previous decline by not allowing for a reversion to occur, the risk of a secondary reversion remains.
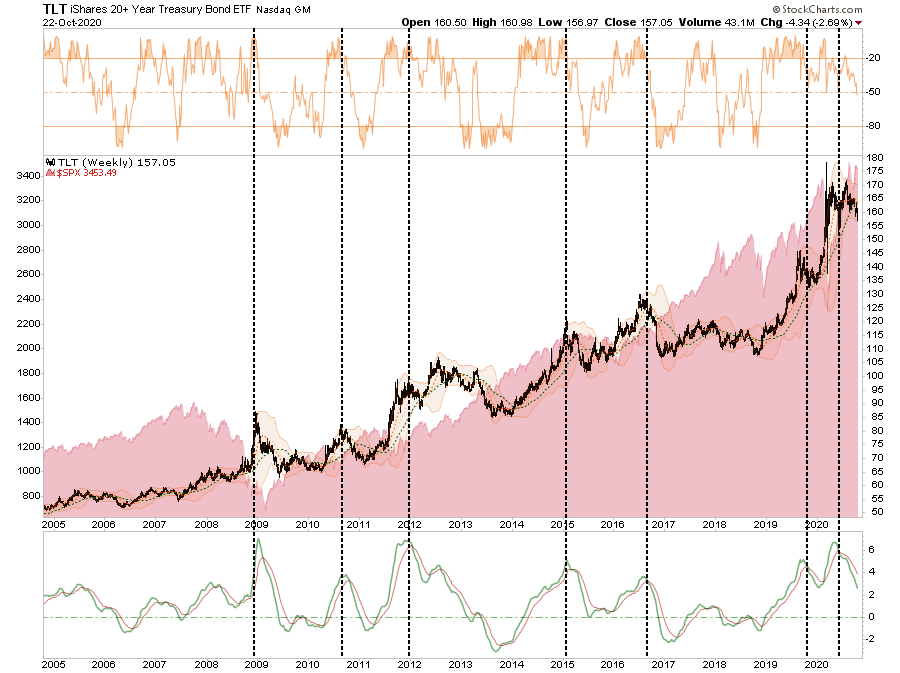
In particular, pay attention to interest rates. The recent rise in interest rates, on the assumption of more stimulus leading to an inflationary impulse, has a long history of not playing well with equity markets. Higher interest rates undermine the market’s mantra of overpaying for assets on an equivalent yield basis.
As stated last week, “risk happens fast,” which is why we continue to encourage you to focus on your overall exposures.

Portfolio Positioning Update
As we have discussed with our RIAPro Subscribers (30-Day Risk-Free Trial) during the course of this week, we have been gradually raising cash and rebalancing portfolio risks as we head into the Presidential election.
During the course of the last three weeks, we discussed that markets, between the election and the end of the year, tend to be positive if there is a “clean election.”
However, the market does not do well when there is a contested election where the outcome is unknown for several days to weeks. Such an event is what we deem to currently be a potential outcome given the large number of “mail-in” bailouts being cast this year due to the pandemic. Delayed collections, extended periods to count votes, etc., all suggest there could be a delay in the election process.
Raising Cash
We have increased our cash holdings during the past week, reduced our bond duration, and rebalanced equities. This is a process that we will continue into next week as more clarity emerges around the election and delivery of more stimulus.
While such actions may seem “silly” in a very bullish and exuberant market, let me repeat the critical mistakes investors most often make in managing their portfolios from last week.
- Investors are slow to react to new information (they anchor), which initially leads to under-reaction but eventually shifts to over-reaction during late-cycle stages.
- The “herding” effect ultimately drives investors. A rising market leads to “justifications” to explain over-valued holdings. In other words, buying begets more buying.
- Lastly, as the markets turn, the “disposition” effect takes hold, and winners are sold to protect gains, but losers are held in the hopes of better prices later.
If the election process goes smoothly, we will quickly add back equity exposure in the areas that we think will benefit the most from the next president’s policies. If “risk happens,” we have cash, allowing us to take advantage of discounted asset prices the market gives us.
As noted last week, this is why we hold cash.
“Given the length of the current market advance, deteriorating internals, high valuations, and weak economic backdrop, reviewing cash as an asset class in your allocation may make some sense. Chasing yield at any cost has typically not ended well for most.”
The best asset any investor can have is “liquidity,” which provides “opportunity.”

The MacroView
If you need help or have questions, we are always glad to help. Just email me.
See You Next Week
By Lance Roberts, CIO
Market & Sector Analysis
Analysis & Stock Screens Exclusively For RIAPro Members
S&P 500 Tear Sheet
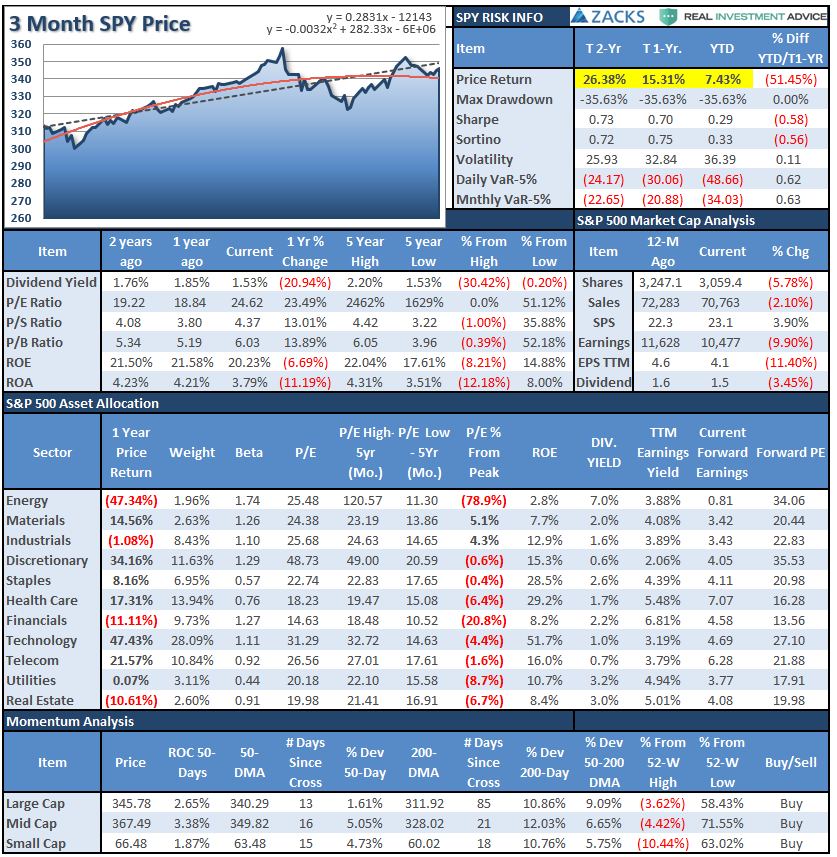
Performance Analysis
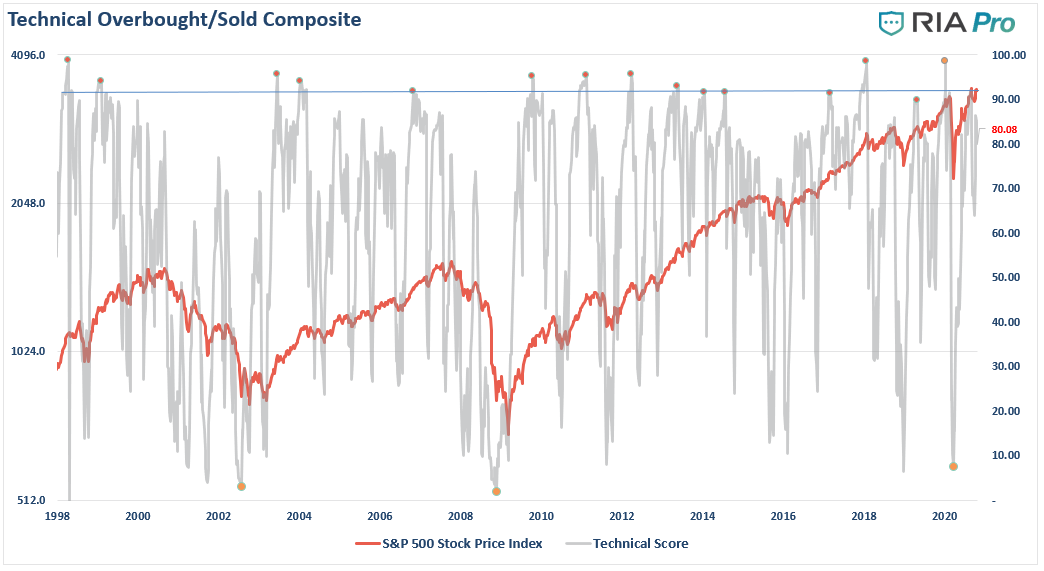
Technical Composite
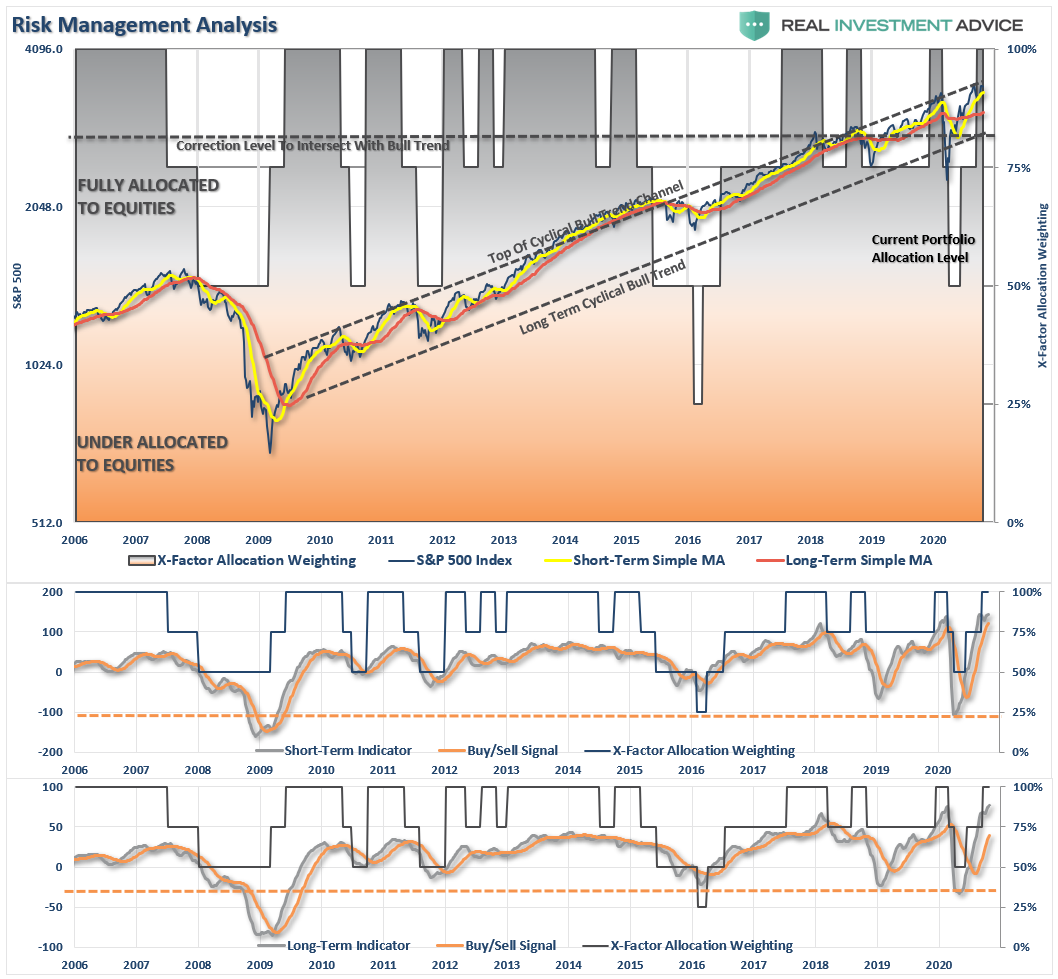
The technical overbought/sold gauge comprises several price indicators (RSI, Williams %R, etc.), measured using “weekly” closing price data. Readings above “80” are considered overbought, and below “20” is oversold.
Portfolio Positioning “Fear / Greed” Gauge
The “Fear/Greed” gauge is how individual and professional investors are “positioning” themselves in the market based on their equity exposure. From a contrarian position, the higher the allocation to equities, to more likely the market is closer to a correction than not. The gauge uses weekly closing data.

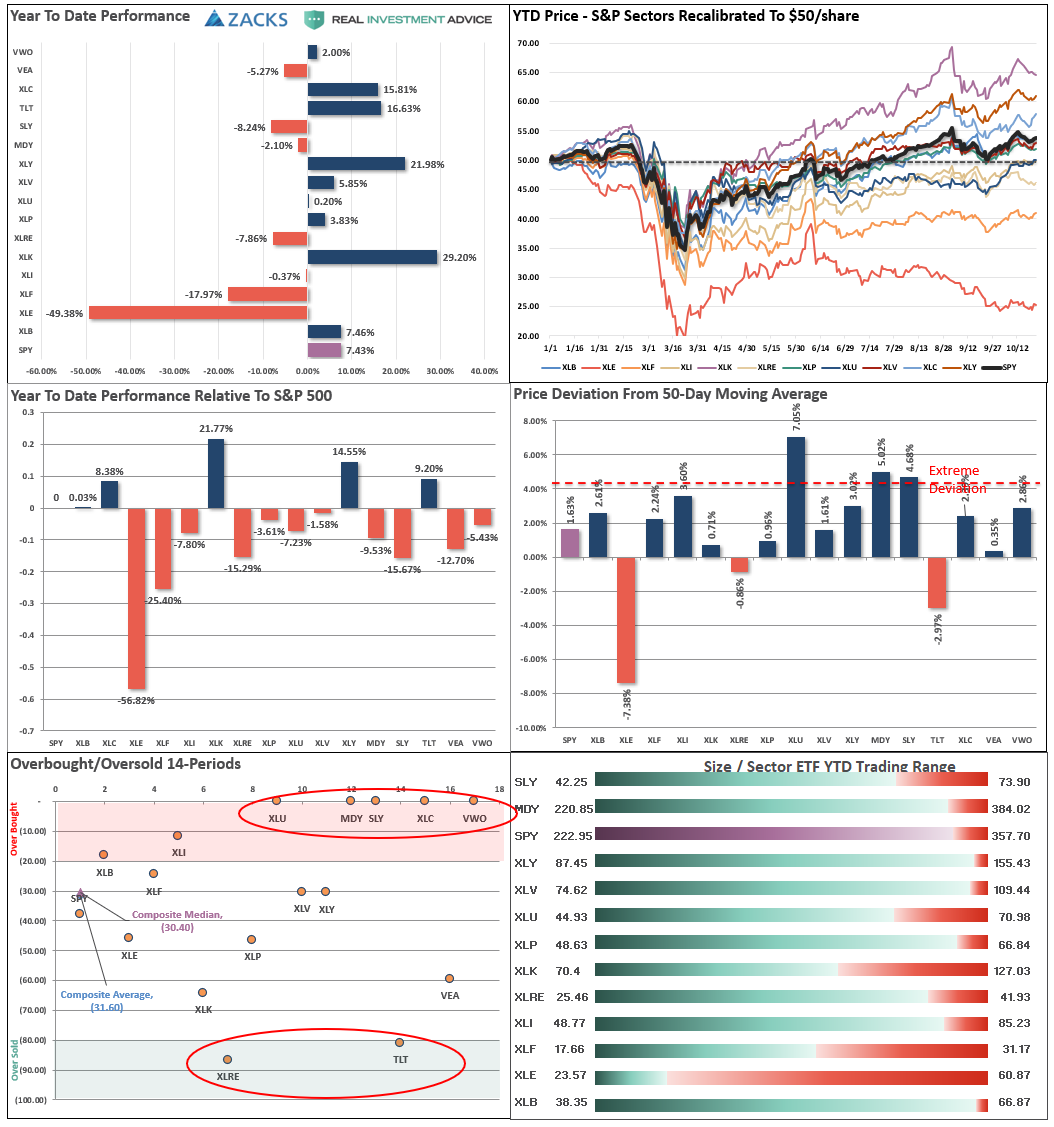
Sector Model Analysis & Risk Ranges
How To Read.
- The table compares each sector and market to the S&P 500 index on relative performance.
- The “MA XVER” is determined by whether the short-term weekly moving average crosses positively or negatively with the long-term weekly moving average.
- The risk range is a function of the month-end closing price and the “beta” of the sector or market.
- The table shows the price deviation above and below the weekly moving averages.

Weekly Stock Screens
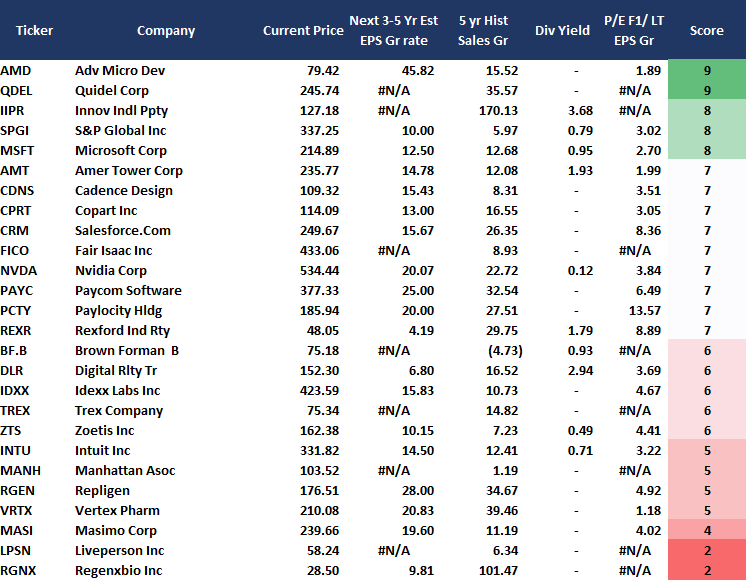
Currently, there are 3-different stock screens for you to review. The first is S&P 500 based companies with a “Growth” focus, the second is a “Value” screen on the entire universe of stocks, and the last are stocks that are “Technically” strong and breaking above their respective 50-dma.
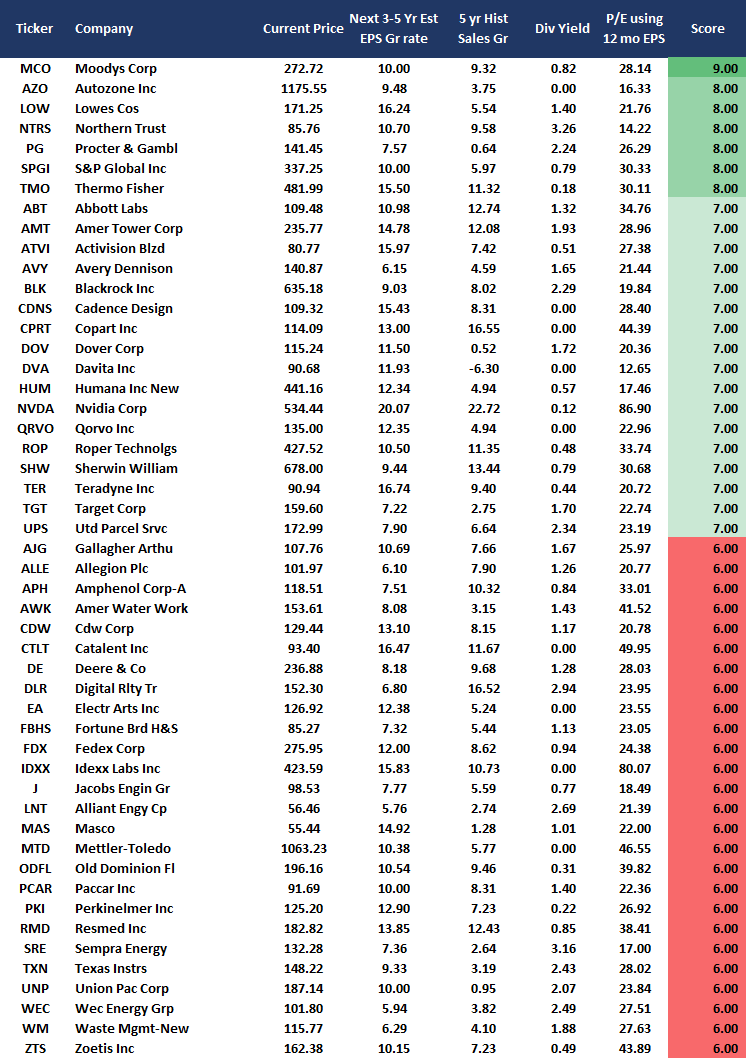
We have provided the yield of each security and a Piotroski Score ranking to help you find fundamentally strong companies on each screen. (For more on the Piotroski Score – read this report.)
S&P 500 Growth Screen
Low P/B, High-Value Score, High Dividend Screen

Aggressive Growth Strategy
Portfolio / Client Update
As stated last week, the good news is the support levels just below Friday’s closing levels, with the 20-dma crossing back above the 50-dma, are holding. Such should keep the markets fairly range-bound heading into next week.
The not-so-good news is that we are just one week away from the Presidential election, which potentially argues for more market volatility. Our biggest concern remains the risk of a contested election. As noted in the main body of this week’s newsletter:
“Over the past week, we have increased our cash holdings, reduced our bond duration, and rebalanced equities. This is a process that we will continue into next week as more clarity emerges around the election and delivery of more stimulus.
While such actions may seem “silly” in a very bullish and exuberant market, let me repeat from last week the critical mistakes investors most often make in managing their portfolios.
- Investors are slow to react to new information (they anchor), which initially leads to under-reaction but eventually shifts to over-reaction during late-cycle stages.
- The “herding” effect ultimately drives investors. A rising market leads to “justifications” to explain over-valued holdings. In other words, buying begets more buying.
- Lastly, as the markets turn, the “disposition” effect takes hold, and winners are sold to protect gains, but losers are held in the hopes of better prices later.
If the election process goes smoothly, we will quickly add back equity exposure in the areas that we think will benefit the most from the policies of the next President. If “risk happens,” we have cash which will allow us to take advantage of discounted asset prices the market gives us.”
We are keenly aware of the risk and continue to take action to position ourselves accordingly.
Portfolio Changes
Over the course of the past week, we took several actions to increase cash in portfolios to provide a downside hedge.
In the Equity & ETF Models, we sold 5% of our Treasury Bond (TLT) position to lower duration currently as interest rates are temporarily under the pressure of more stimulus expectations. The belief is that more stimulus will lead to inflation and higher rates. As we have repeatedly discussed, the stimulus is actually “deflationary” as it uses debt for a one-time boost. While we temporarily reduced our holdings, we are setting up for an excellent opportunity to add back to our holdings for a sizable gain in the future.
We also sold ATT (T). While we like the position from a “value” perspective, it violated our stop-loss levels. We used the earnings announcement to remove the portfolios’ position to reduce an underperforming asset’s drag. While we still believe that “value” will eventually be the “place to be,” the market doesn’t agree with us currently.
We are currently holding roughly 15% in cash, along with our bond holdings and reduced equity weightings. We will likely take further actions next week, depending on market actions, to further shore up our defenses.
Our short-term concern is protecting your portfolio. Once we get through the election, we can focus on the economic recovery and where we go from here.
Please don’t hesitate to contact us if you have any questions or concerns.
Lance Roberts
CIO
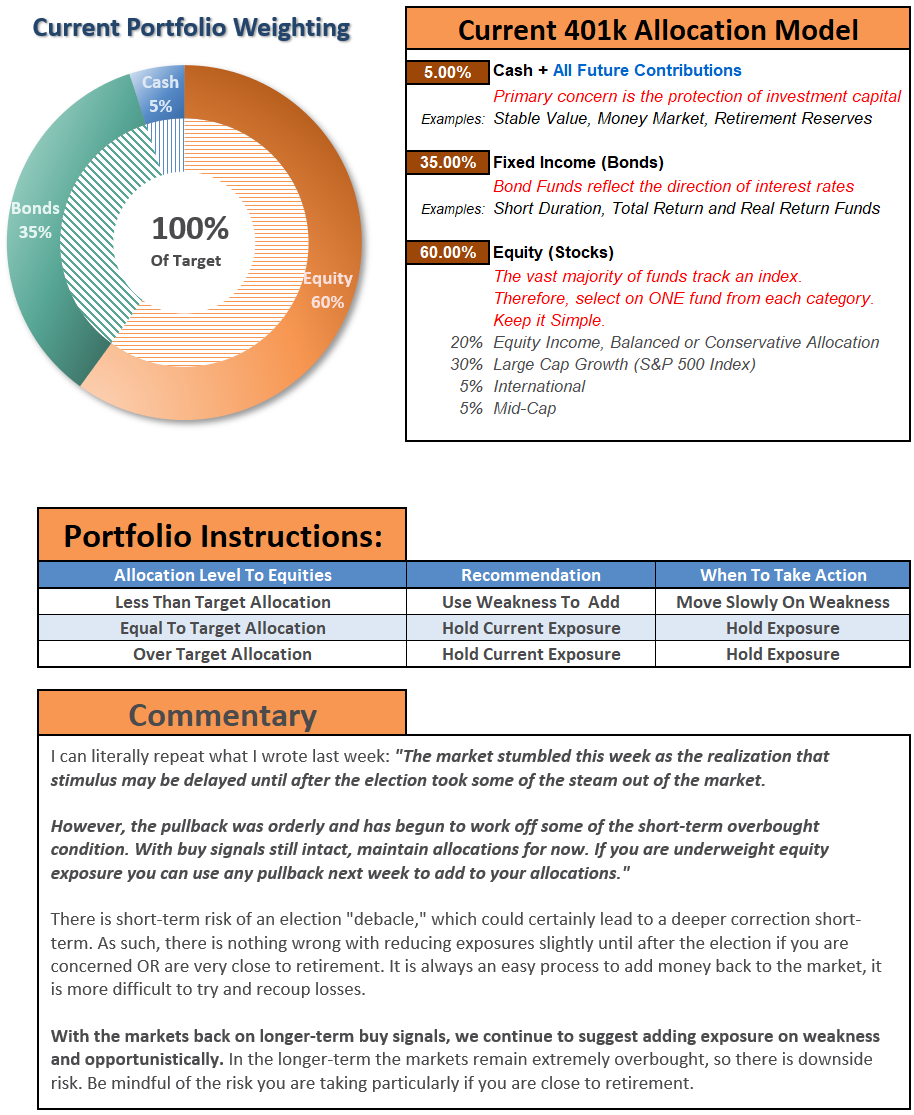
THE REAL 401k PLAN MANAGER
A Conservative Strategy For Long-Term Investors
If you need help after reading the alert, do not hesitate to contact me.
Model performance is a two-asset model of stocks and bonds relative to the weighting changes made each week in the newsletter. Such is strictly for informational and educational purposes only, and one should not rely on it for any reason. Past performance is not a guarantee of future results. Use at your own risk and peril.

401k Plan Manager Live Model
As an RIA PRO subscriber (You get your first 30-days free), you can access our live 401k plan manager.
Compare your current 401k allocation to our recommendation for your company-specific plan and our on 401k model allocation.
You can also track performance, estimate future values based on your savings and expected returns, and dig down into your sector and market allocations.
If you would like to offer our service to your employees at a deeply discounted corporate rate, please contact me.


Lance Roberts is a Chief Portfolio Strategist/Economist for RIA Advisors. He is also the host of “The Lance Roberts Podcast” and Chief Editor of the “Real Investment Advice” website and author of “Real Investment Daily” blog and “Real Investment Report“. Follow Lance on Facebook, Twitter, Linked-In and YouTube
Customer Relationship Summary (Form CRS)
Also Read


