


In October, the BLS reports that 2.2. million people found work. As the unemployment rate plunges, the Fed may be finding themselves trapped to take more action.
Did 2.2 million people find jobs in October? That’s what the BLS says.
BLS Jobs Statistics at a Glance
Details from the monthly BLS Employment Report.
- Nonfarm Payroll: +638,000 to 141,720,000 – Establishment Survey
- Employment: +2,243,000 to 149,806,000– Household Survey
- Unemployment: -1,519,000 to 11,061,000- Household Survey
- Baseline Unemployment Rate: -1.0 to 6.9% – Household Survey
- U-6 unemployment: -0.7 to 12.1% – Household Survey
- Civilian Non-institutional Population: +183,000 to 260,925,000
- Civilian Labor Force: +724,000 to 160,867,000 – Household Survey
- Not in Labor Force: -541,000 to 100,058,000 – Household Survey
- Participation Rate: +0.3 to 61.7% – Household Survey
Initial Reaction
Wow. That’s a lot of employment. The discrepancy between employment and jobs is 2,243,000 – 638,000 = 1,605,000.
The Bloomberg Econoday unemployment rate consensus was 7.7%.

BLS Error Rate
For March through September, BLS published an estimate of the misclassification of the unemployment rate had misclassified workers been included among the unemployed. Repeating this same approach, the overall October unemployment rate would have been 0.3 percentage points higher than reported. However, this represents the upper bound of our estimate of misclassification and probably overstates the size of the misclassification error.
According to usual practice, we accept the data from the household survey as recorded. To maintain data integrity, we take no ad hoc actions to reclassify survey responses.
I strongly question the accuracy of the BLS assertion that 0.3% is the high end of their error rate.
Job Revisions
- The change in total nonfarm payroll employment for August was revised up by 4,000 from +1,489,000 to +1,493,000
- The change for September was revised up by 11,000 from +661,000 to +672,000.
Part-Time Jobs
- Involuntary Part-Time Work: +383,000 to 6,683,000
- Voluntary Part-Time Work: +503,000 to 19,421,000
- Total Part-Time Work: +1,002,000 to 26,163,000
- Total Full-Time Work: +1,170,000 to 123,593,000
Employment Reporting Silliness
- Voluntary plus involuntary part-time work rose by 886,000.
- Part-time work rose by 1,002,000
- Full-time work rose by 1,170,000
- Total employment rose by 2,243,000
Don’t try to make sense of those numbers as they never add up. I list them as reported.

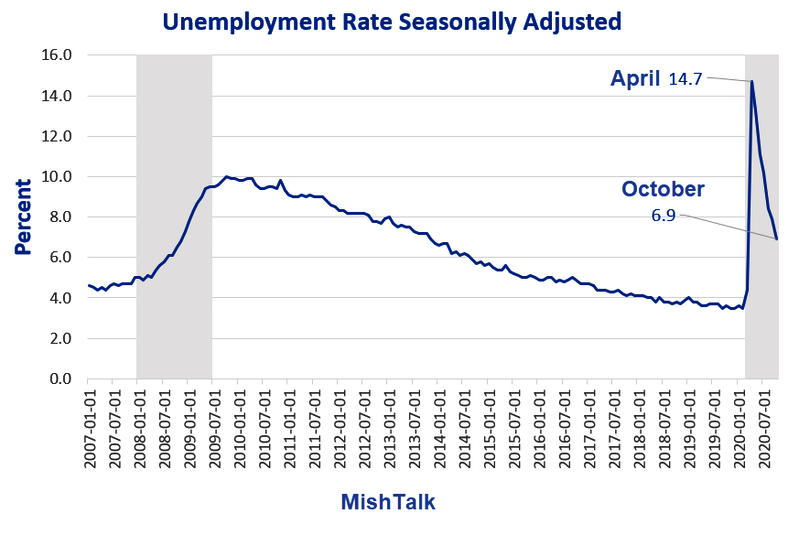
Unemployment Rate – Seasonally Adjusted Long-Term

Unemployment Details
- The Unemployment: -1,519,000 to 11,061,000
- Survey Baseline Unemployment Rate: -1.0 to 1.9%
Nonfarm Payrolls Month-Over-Month

That chart is from the BLS. The title is inaccurate.
The chart represents jobs, from the Establishment Survey. Employment comes from the Household Survey.
Nonfarm Payrolls

That chart puts a much-needed perspective on the recovery.

Hours And Wages
Average weekly hours of all private employees were flat at 34.8 hours. Importantly, the average weekly hours of all private service-providing employees rose 0.1 hours to 33.8 hours. Lastly, average weekly hours of manufacturers rose 0.3 hours to at 40.5 hours.
Average Hourly Earnings of All Nonfarm Workers rose $0.04 to $29.50.
Year-over-year, wages rose from $28.24 to $29.50. That’s a gain of 4.5%.
The month-to-month and especially year-over-year gains are very distorted because more higher-paid workers kept their jobs than lower-paid employees.
Average hourly earnings of Production and Supervisory Workers rose $0.05 to $24.82.
In August, I reported “Average hourly earnings of Production and Supervisory Workers rose $0.18 to $24.81.” We are now a penny ahead of August.
Year-over-year, wages rose from $23.76 to $24.82. That’s a gain of 4.5%.
For a discussion of the income distribution, please see What’s “Really” Behind Gross Inequalities In Income Distribution?
Birth Death Model
Starting January 2014, I dropped the Birth/Death Model charts from this report.
For those who follow the numbers, I retain this caution: Do not subtract the reported Birth-Death number from the reported headline number. That approach is statistically invalid.
BLS Covid-19 Statement on the Birth-Death Model
The widespread disruption to labor markets due to the COVID-19 pandemic and the potential impact to the birth-death model have prompted BLS to both revisit research conducted in the aftermath of the Great Recession (2008-2009) and incorporate new ideas to account for changes in the number of business openings and closings. We implemented two areas of research to improve the accuracy of our birth-death model in the CES estimates. These adjustments will better reflect the net effect of the contribution of business births and deaths to the estimates. These two methodological changes are the following:
1: A portion of both reported zeros and returns from zero in the current month from the sample were used in estimation to better account for the fact that business births and deaths will not offset.
2: Current sample growth rates were included in the net birth-death forecasting model to better account for the changing relationships between business openings and closings.
BLS will determine on a monthly basis if the adjusted birth-death model described here continues to be necessary. We will disclose these changes each month in the Employment Situation news release. All months in the tables of net birth-death forecasts on this page include footnotes for any month in which a regressor was used to supplement the forecasts.
The Birth-Death model is essentially garbage but we likely will not find how distorted this is until the annual revisions next year.
Table 15 BLS Alternative Measures of Unemployment

Table A-15 is where one can find a better approximation of what the unemployment rate really is.
The official unemployment rate is 6.9%. However, if you start counting all the people who want a job but gave up, all the people with part-time jobs that want a full-time job, all the people who dropped off the unemployment rolls because their unemployment benefits ran out, etc., you get a closer picture of what the unemployment rate is. That number is in the last row labeled U-6.
U-6 is much higher at 12.1%. Both numbers would be way higher still, were it not for millions dropping out of the labor force over the past few years.
Some of those dropping out of the labor force retired because they wanted to retire. The rest is disability fraud, forced retirement, discouraged workers, and kids moving back home because they cannot find a job.

Strength is Relative
It’s important to put the jobs numbers into proper perspective.
In the household survey, if you work as little as 1 hour a week, even selling trinkets on eBay, you are considered employed.
Furthermore, in the household survey, if you work three part-time jobs, 12 hours each, the BLS considers you a full-time employee.
Lastly, in the payroll survey, three part-time jobs count as three jobs. The BLS attempts to factor this in, but they do not weed out duplicate Social Security numbers. The potential for double-counting jobs in the payroll survey is large.
Household Survey vs. Payroll Survey
The payroll survey (sometimes called the establishment survey) is the headline jobs number, generally released the first Friday of every month. The report comes from employer reporting.
Alternatively, the household survey is a phone survey conducted by the BLS. It measures unemployment and many other factors.
If you work one hour, you are employed. If you don’t have a job and fail to look for one, you are not considered unemployed, rather, you drop out of the labor force.
Looking for jobs on Monster does not count as “looking for a job”. You need an actual interview or send out a resume.
These distortions artificially lower the unemployment rate, artificially boost full-time employment, and artificially increase the payroll jobs report every month.
Recovery Will Take Years
The improvements are welcome but huge headwinds remain.
The economy has added 12.1 million jobs since the April lows.
However, jobs remain 10.1 million jobs below the February 2020 peak. Millions of those jobs will not return.
Those that do return will take many months.
Meanwhile, as deficits balloon along with Fed stimulus, so do the stock market bubbles.
Payback time of some sort for these distortions is on deck.

Mike Shedlock,/ Mish is a registered investment advisor and a though leader on economics and finance. His “MishTalk” global economics blog is highly read and he posts several articles daily on the global economy. Topics include interest rates, central bank policy, gold, precious metals, jobs, and economic reports from an Austrian Economic perspective. Follow Mish on Twitter or email him.
Also Read


