


Each week we produce a Sector Buy Sell chart book of the S&P 500 sectors to review where money is flowing within the market as whole. This helps refine not only decision making about what to own and when, but what sectors to overweight or underweight to achieve better performance.
HOW TO READ THE SECTOR BUY/SELL REVIEW CHARTS
There are three primary components to each chart:
- The price chart is in orange
- The Over Bought/Over Sold indicator is in gray
- The Buy / Sell indicator is in blue.
When the gray indicator is at the TOP of the chart, there is typically more risk and less reward available at the current time. In other words, the best time to BUY is when the short-term condition is over-sold. Likewise when the buy/sell indicator is above the ZERO line investments have a tendency of working better than when below the zero line.
NEW PORTFOLIO TOOL: Under the PORTFOLIO tab you will see a new tool called ALERTS. When you click on the link, any position that you in a WATCHLIST or PORTFOLIO will show up in the ALERTS window. You can add SELL TARGETS, STOP LOSS, and Daily % Changes. When those levels are triggered, you will be sent an email and the alerts will show on your dashboard.
We are using this system for all our current positions and will be reporting our targets in these daily updates.
Basic Materials
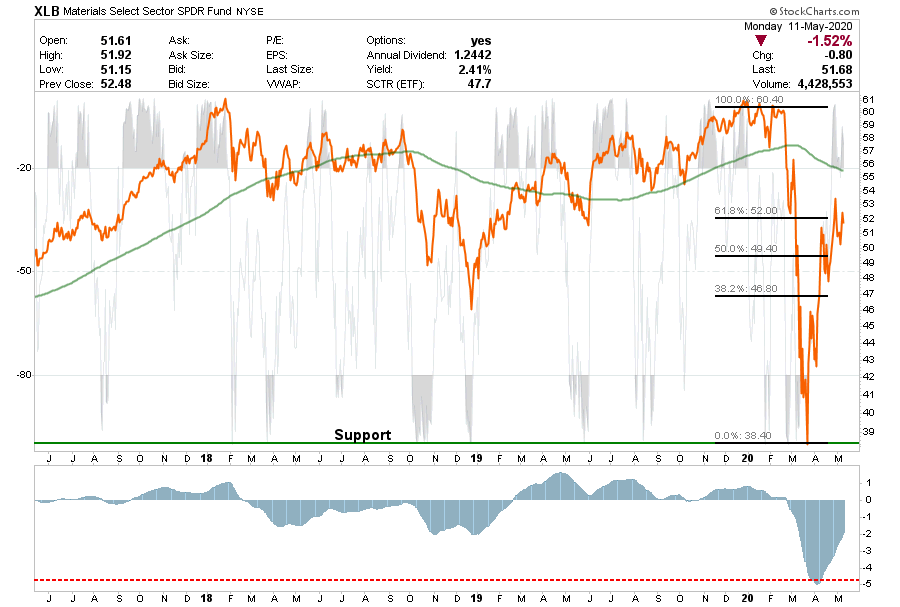
- XLB failed at the 61.8% retracement rally last week, is overbought, and is underperforming the market. It failed again at the 61.8% retracement level on Monday.
- We are out of the sector for now due to the underperformance. However, if we do enter a trade, parameters will be very tight as the outlook for earnings remains dismal
- We have lowered our trading alert to $46 which may set up a tradeable opportunity.
- Short-Term Positioning: Bearish
- Last Week: No Positions
- This Week: No Positions
- Long-Term Positioning: Bearish
Communications
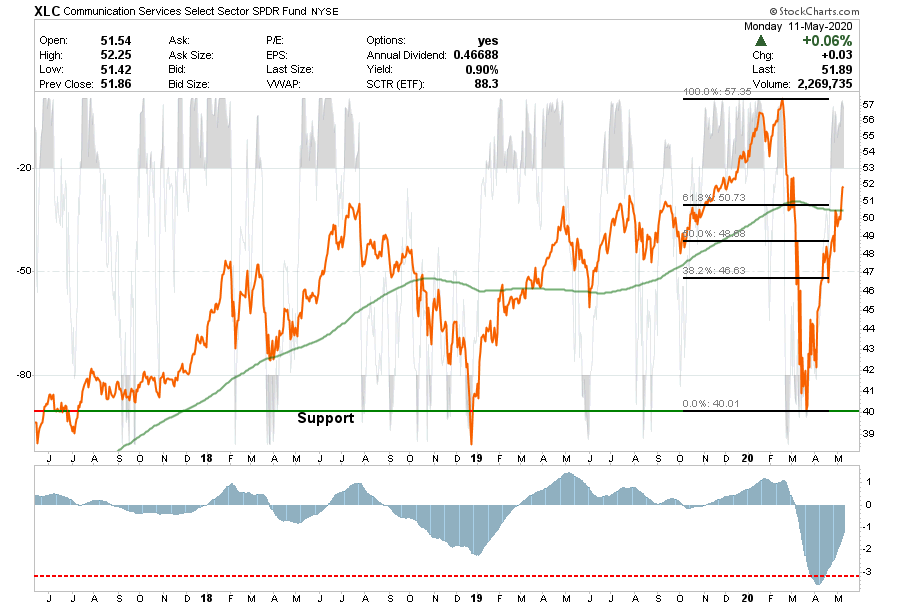
- XLC continues to perform better than the overall market.
- We added to this sector previously, and the 200-dma retracement level has been reached. With the break above the 61.8% retracement level we added again to the sector on Monday.
- We continue to like the more defensive quality of the sector, BUT on a short-term basis it is very overbought. We are looking for a pullback to add further to our holdings.
- Our have set an alert at $49 to revisit adding to our holdings.
- Short-Term Positioning: Bullish
- Last Week: Hold positions
- This Week: Hold positions
- Long-Term Positioning: Neutral
Energy
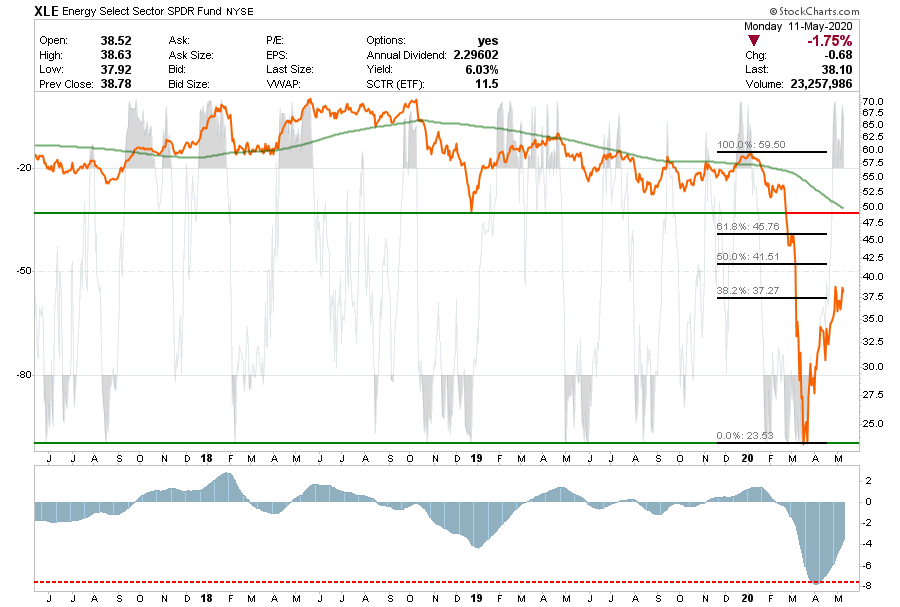
- Energy stocks have been trading much better than the commodity as relative strength has improved for the sector.
- We added a holding of XLE to our sector model (XOM, CVX to the equity model) to trade this current rally. We are looking for an opportunity to add to our holdings.
- We have a stop-loss alert set at $30, with a high-alert set at $40. The sector is about at the same level as last week, so no action taken.
- Short-Term Positioning: Bearish
- Last week: Hold positions
- This week: Hold positions
- Stop loss is $30.
- Long-Term Positioning: Bearish
Financials
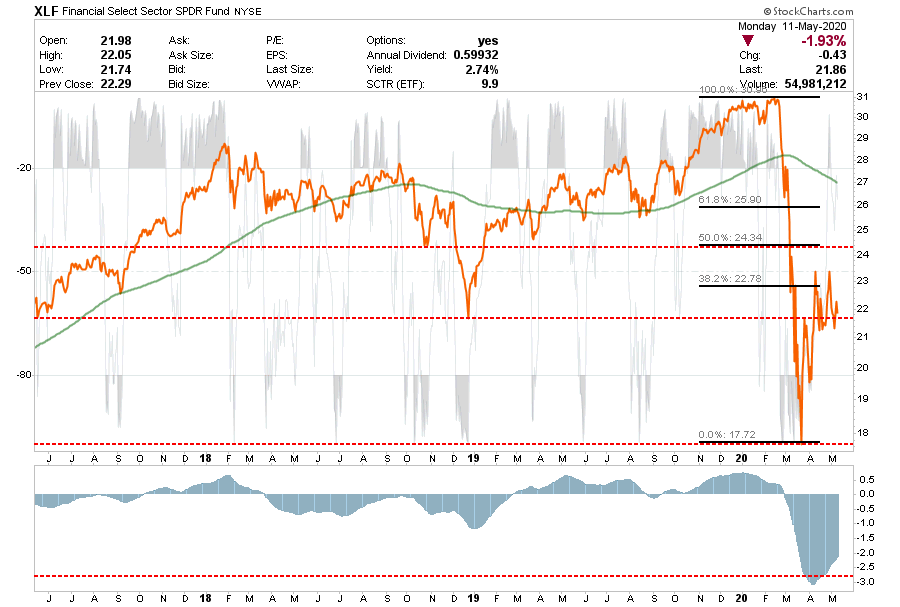
- Financials have lagged the bear market rally badly, and continue to underperform.
- We sold out of financials previously and will re-evaluate once the market calms down and finds a bottom.
- We continue to suggest selling rallies in financials.
- We have an alert set at $21 to start evaluating holdings.
- Short-Term Positioning: Neutral
- Last week: No position
- This week: No position
- Long-Term Positioning: Neutral
Industrials
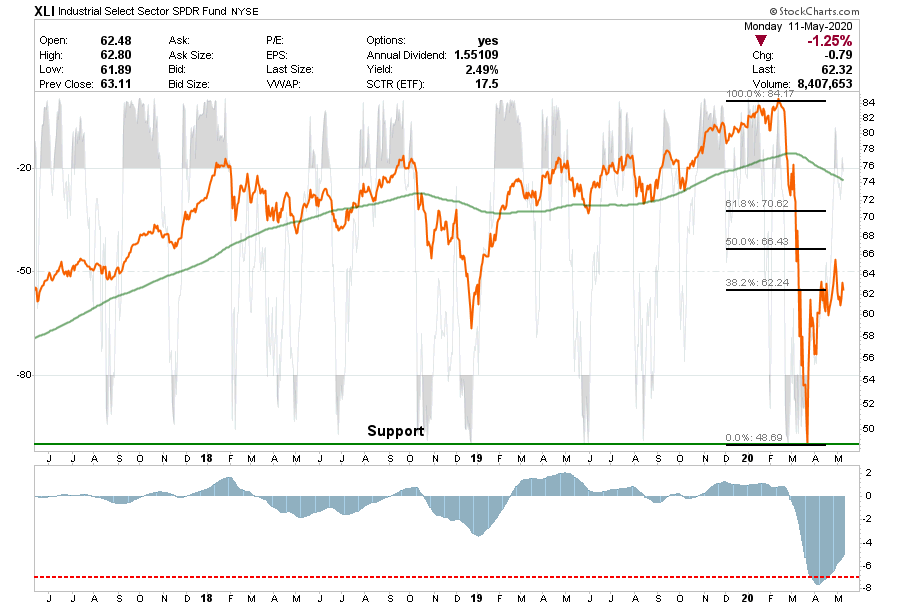
- As with XLB, so goes XLI.
- XLI had a good rally and is again retesting the 38.2% retracement level.
- We sold all of our holdings previously and will opt to wait for a better market structure to move back into the sector.
- We have an alert set at $58 to evaluate positions
- Short-Term Positioning: Bearish
- Last week: No position.
- This week: No position.
- Long-Term Positioning: Bearish
Technology
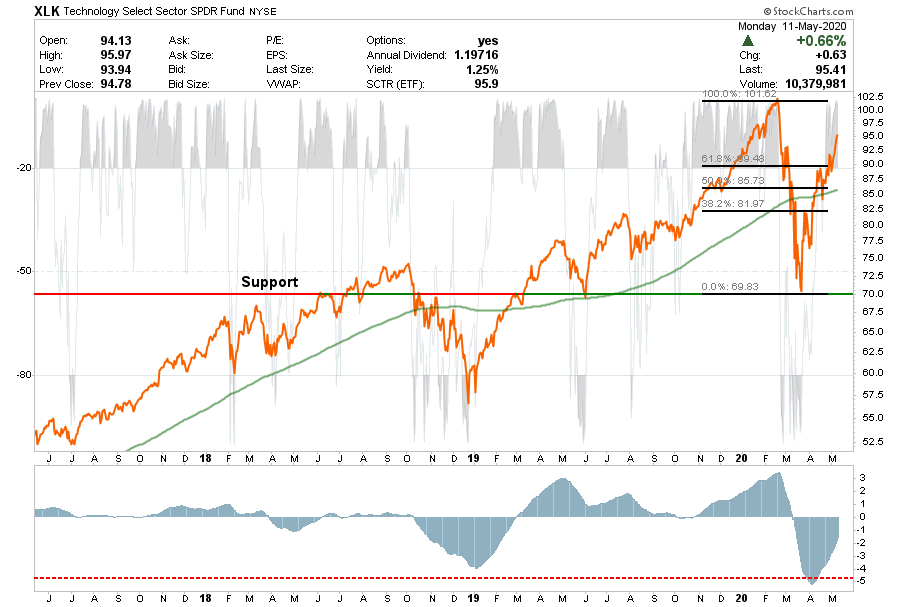
- Technology continues to be the best looking sector chart available. We are at full weight in the sector now but will look to overweight on a pullback to support.
- The rally on Monday continues push toward all-time highs and is back into positive territory for year. However, it is a narrow advance driven by the 5-major constituents. So goes AAPL, so goes the market.
- If we get a pullback that holds support at the 200-dma and the 50% retracement level, we will look add more weight to the sector. We have an alert set at $86.
- Short-Term Positioning: Bullish
- Last week: Holding positions.
- This week: Holding positions.
- Long-Term Positioning: Bullish
Staples
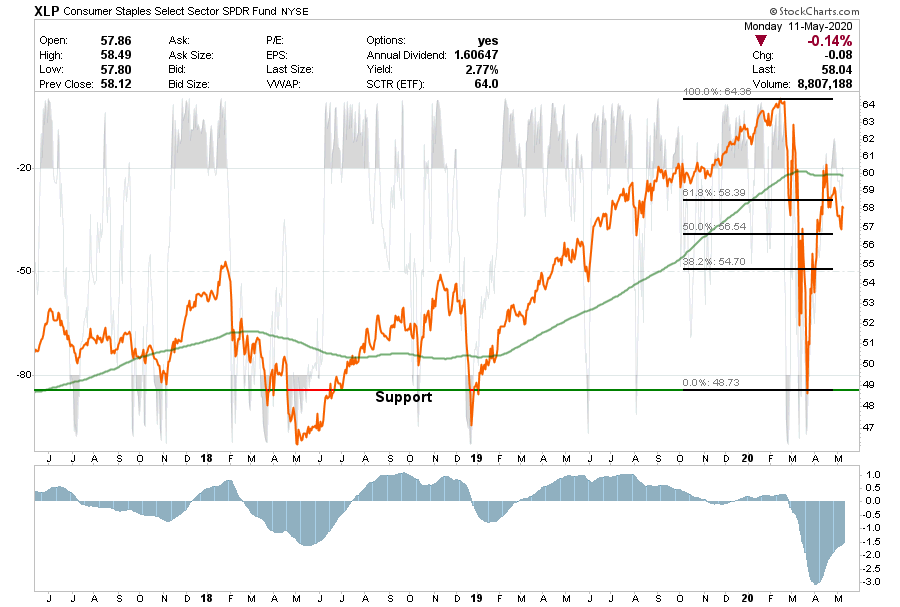
- XLP recently pulled back and held support at the 50% retracement level. We increased our exposure slightly to the sector on this test.
- XLP is working off the overbought condition somewhat, but still has more to go.
- We have an alert set at $55 as our stop-level.
- Short-Term Positioning: Bullish
- Last week: Hold positions
- This week: Holding positions
- Long-Term Positioning: Bullish
Real Estate
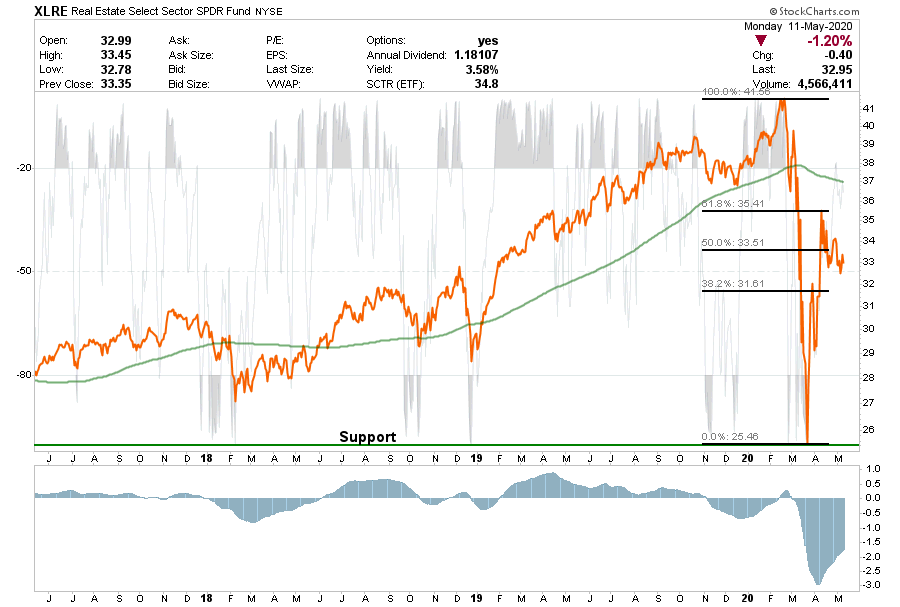
- XLRE has recently rallied back to the 61.8% retracement level, and failed support at the 50% retracement last week.
- The sector is not overbought and is oversold relative to the market. If XLRE holds the $32 level, we should see some better performance here soon on a “safety rotation” trade with “bonds.”
- We have a low limit alert at $32 if lower support is getting threatened.
- Short-Term Positioning: Bullish
- Last week: No position
- This week: Be patient.
- Long-Term Positioning: Bullish
Utilities
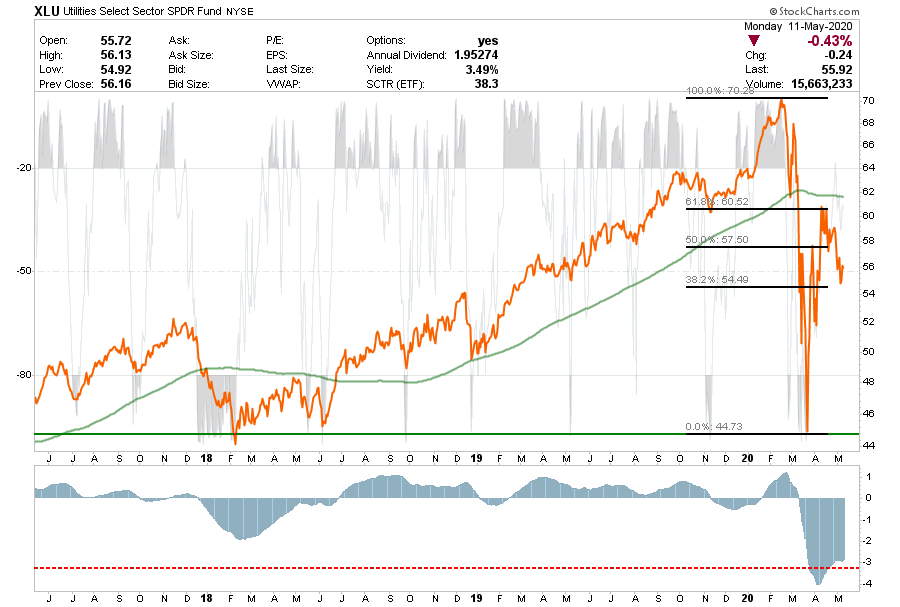
- XLU ran into the 61.8% retracement level, failed, and has now broken the 50% retracement support level.
- If XLU is working to hold support at the 32.8% retracement. If it can hold that support and work off the overbought condition, we will likely add to our holdings.
- We should see a relative “risk off” safety trade with XLRE if we see a pullback in the broader market.
- We have an alert set at $54.
- Short-Term Positioning: Bullish
- Last week: Hold position.
- This week: Hold position
- Long-Term Positioning: Bullish
Health Care
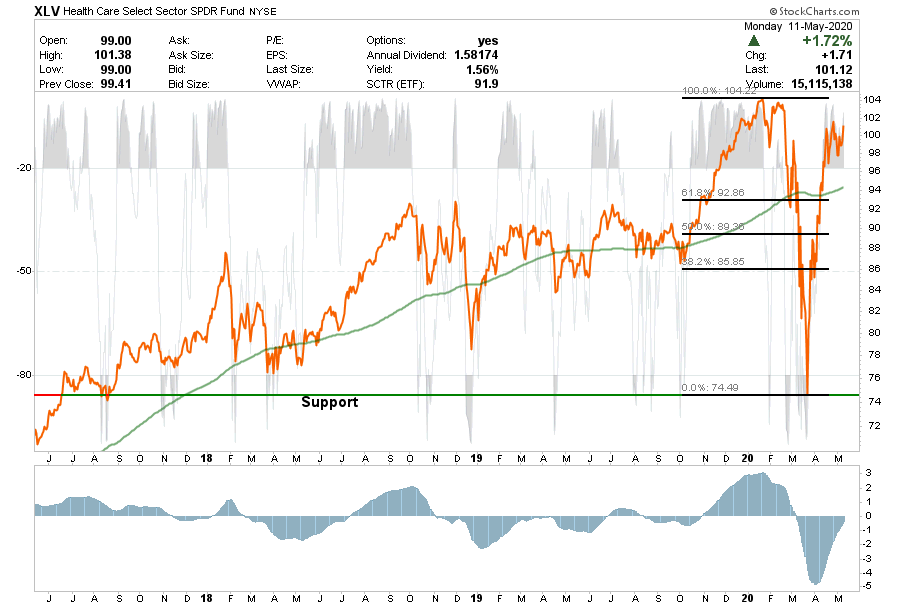
- XLV finally ran into resistance near all-time highs. The 200-dma is now important support and needs to hold.
- Look for a short-term pullback that holds the 62.8% retracement level and the 200-dma and consolidates a bit here before adding weight. The sector is very overbought short-term.
- We have an alert set at $95 to add to our holdings.
- Short-Term Positioning: Neutral
- Last week: Hold positions
- This week: Look to add
- Long-Term Positioning: Bullish
Discretionary
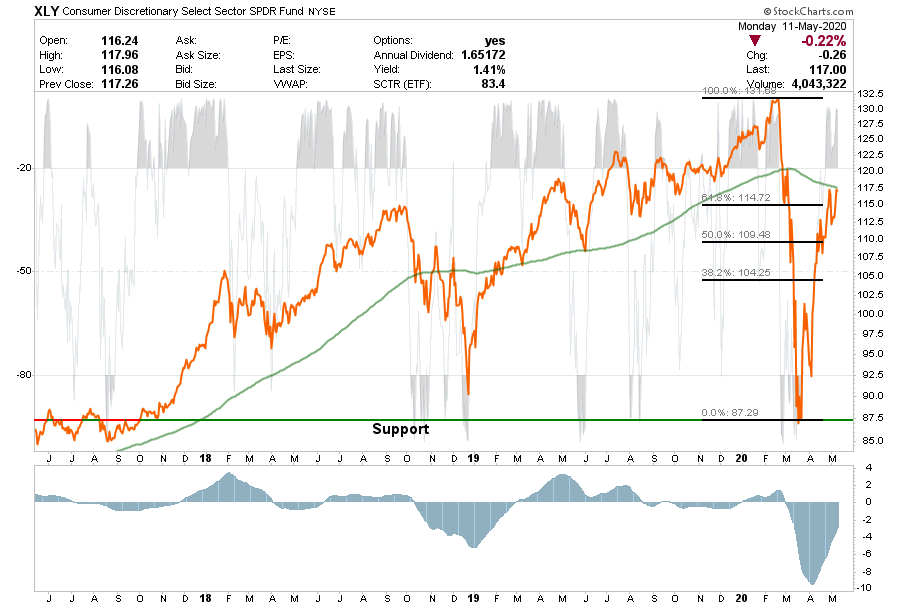
- Discretionary is performing better now.
- XLY rallied to the 200-dma and failed, but is again retesting that level of resistance on Monday.
- The sector is VERY overbought, so a pullback is likely, but there is a trading opportunity to if XLY can break above the 200-dma.
- We are focusing on Staples for the time being but have an alert set to add Discretionary as a trading position at $110.00 on a pullback or $118 on a breakout.
- Short-Term Positioning: Neutral
- Last week: No position
- This week: No position
- Long-Term Positioning: Neutral
Transportation
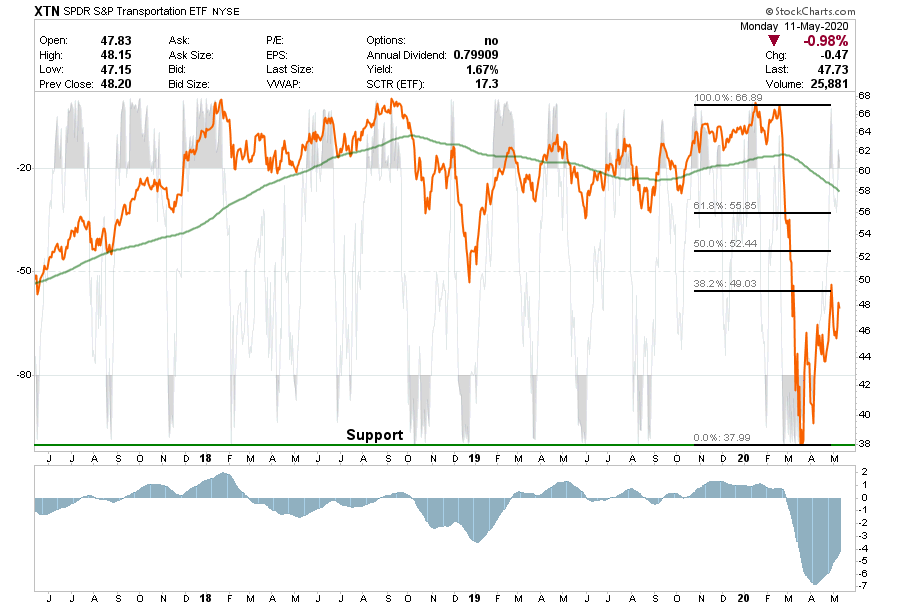
- We have remained out of the economically sensitive sector as the impact of the “coronavirus” continues to rip through earnings in this sector.
- The sector mustered a weak rally from lows back to the 38.2% retracement level, got very overbought, and has now failed at resistance.
- We have an alert set for a trading opportunity set at $44, but we aren’t excited about it.
- Short-Term Positioning: Neutral
- Last week: No position
- This week: No position
- Long-Term Positioning: Bearish


Lance Roberts is a Chief Portfolio Strategist/Economist for RIA Advisors. He is also the host of “The Lance Roberts Podcast” and Chief Editor of the “Real Investment Advice” website and author of “Real Investment Daily” blog and “Real Investment Report“. Follow Lance on Facebook, Twitter, Linked-In and YouTube
Customer Relationship Summary (Form CRS)
Also Read


