


The Sector Relative Value Report provides guidance on which industries or sectors are likely to outperform or underperform the S&P 500.
Click on the Users Guide for details on the model’s relative value calculations as well as guidance on how to read the model’s graphs.
This report is just one of many tools that we use to assess our holdings and decide on potential trades. Just because this report may send a strong buy or sell signal, we may not take any action if it is not affirmed in the other research and models we use.
Commentary
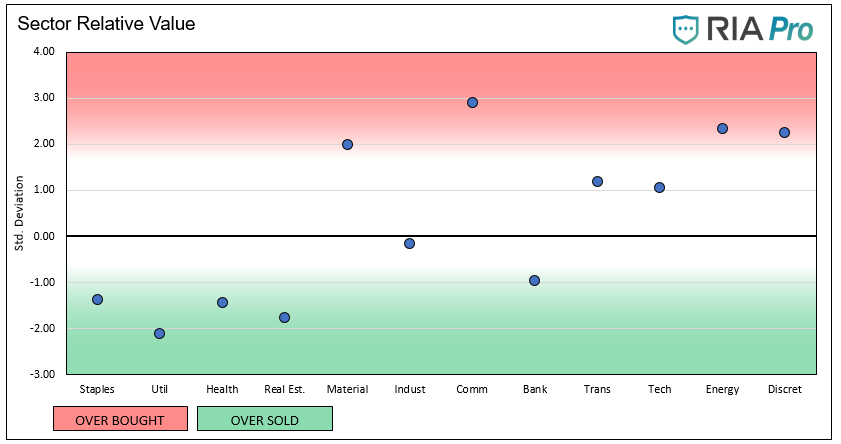
- The most telling story about this week’s graphs is that we enlarged the y-axis to 4 standard deviations from 3. We did this to accommodate the Communications and Energy sectors, which rose above 3 during the week but backed off with Thursday’s market sell-off.
- A 3 standard deviation event is rare, and it signals future relative value performance for those sectors will be weak. We are also keeping a close eye on other market internals as this may be a sign the market as a whole is getting ready to reverse.
- Staples, Utilities, and Health, all considered safety sectors, became more oversold this past week, while the two noteworthy momentum sectors, Energy and Communications, became more overbought. The momentum trade is in full swing as investors are chasing recent winners at the expense of those recently lagging.
- Because of the sharp divergence in relative value between Utilities and Communications, we are considering adjusting our allocations toward Utilities from Communications.
- In addition to this report, we are working on another relative value analysis that is not quite ready for prime time. However, early results show us that the Dow Jones Industrial Average (DIA) and 20 Year UST ETF (TLT) are oversold versus the S&P 500, while the Nasdaq (QQQ) is over overbought. These readings are also evidence of the momentum trade.
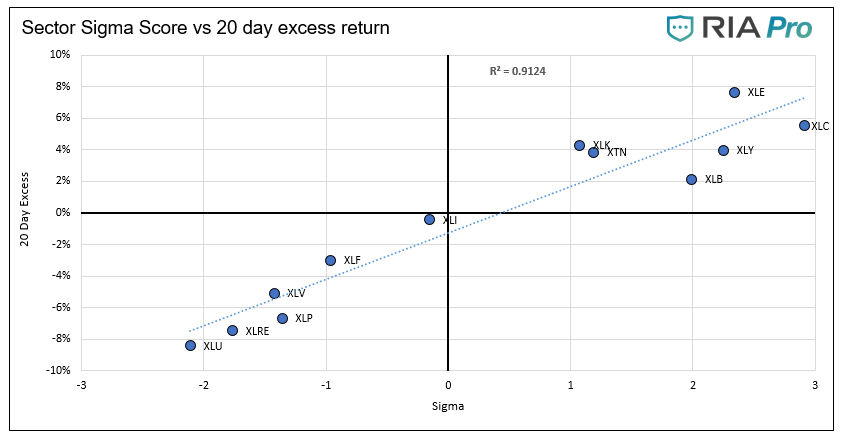
- The R-squared on the sigma/20 day excess return scatter plot is strong at .9124.
Graphs
The ETFs used in the model are as follows:
- Staples XLP
- Utilities XLU
- Health Care XLV
- Real Estate XLRE
- Materials XLB
- Industrials XLI
- Communications XLC
- Banking XLF
- Transportation XTN
- Energy XLE
- Discretionary XLY
- S&P 500 SPY


Michael Lebowitz, CFA is an Investment Analyst and Portfolio Manager for RIA Advisors. specializing in macroeconomic research, valuations, asset allocation, and risk management. RIA Contributing Editor and Research Director. CFA is an Investment Analyst and Portfolio Manager; Co-founder of 720 Global Research.
Follow Michael on Twitter or go to 720global.com for more research and analysis.
Customer Relationship Summary (Form CRS)
Also Read


