


The Relative Value Report provides guidance on which sectors, factors, indexes, and bond classes are likely to outperform or underperform its appropriate benchmark.
Click on the Users Guide for details on the model’s relative value calculations as well as guidance on how to read the graphs.
This report is just one of many tools that we use to assess our holdings and decide on potential trades. Just because this report may send a strong buy or sell signal, we may not take any action if it is not affirmed in the other research and models we use.
Commentary
- Over the last few weeks, we have noticed that the standard deviation score we use has been muted as compared to scores from a month or two ago. This is logical given the reduced market volatility and the way we normalize data to calculate the score. The takeaway is that extreme scores may now be between +/-1 to 2 versus +/-3 to 4.
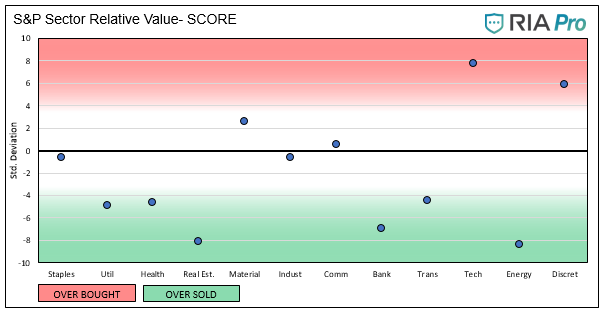
- The last graph shown below, titled “S&P Sector Relative Value- SCORE”, shows the raw relative value scores (before normalizing). Note the greater divergence in scores versus the normalized graph we lead with below.
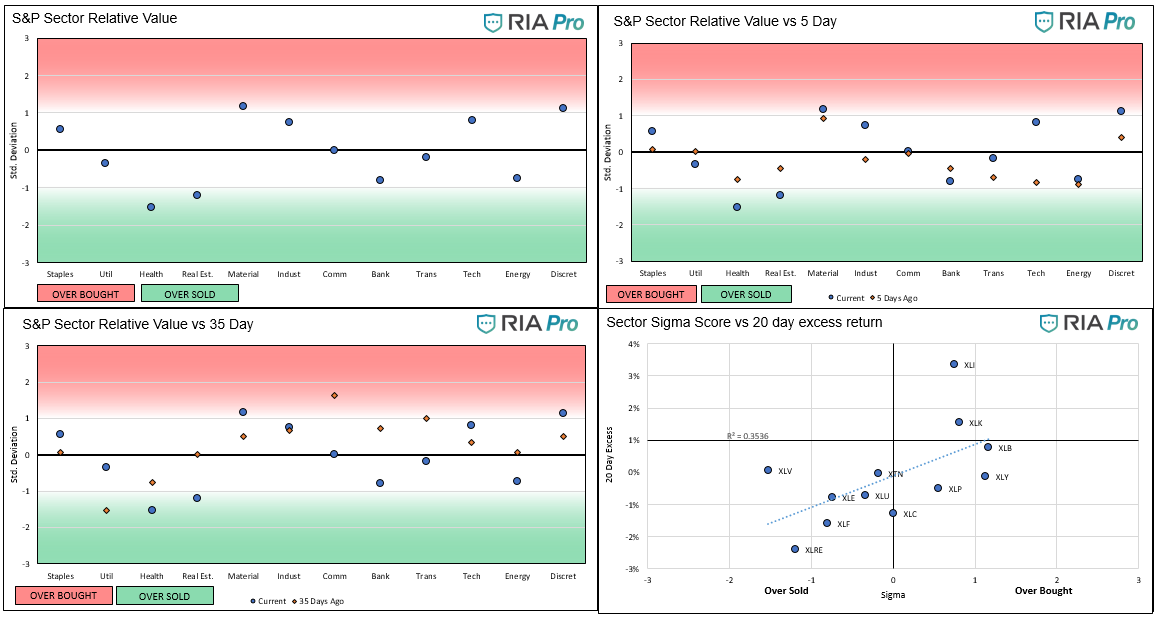
- Materials and Discretionary appear the most overbought sectors this week, while Healthcare and Real estate the most oversold.
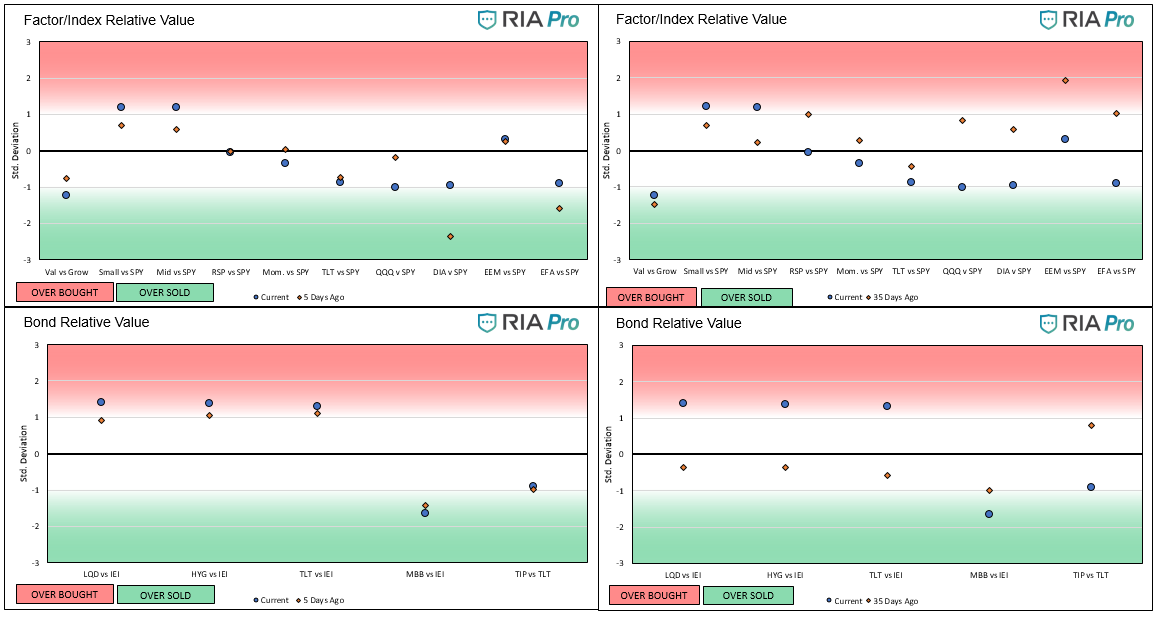
- Most of the factor/indexes are hovering near fair value versus the S&P or their appropriate benchmark. Small and Mid-cap are overbought, while value versus growth continues to languish.
- Bonds continue to remain stable as yields trade in a tight range.
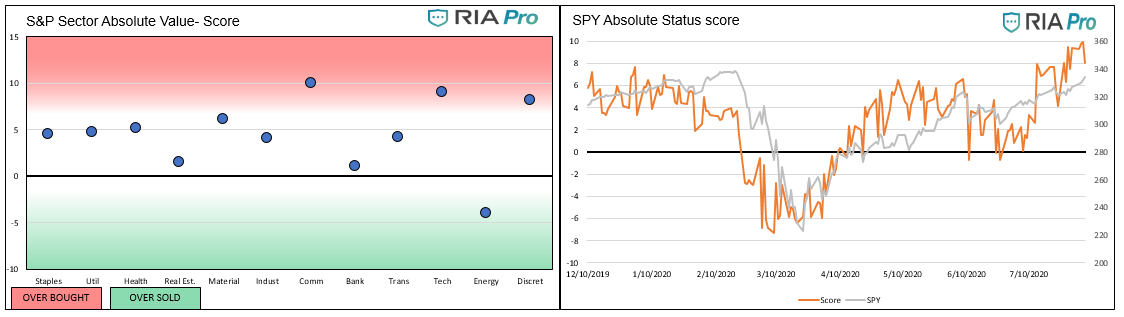
- We have been working on a new version of this report using the same technical scoring methodology but on an absolute, not relative basis. We do not assess the ratio of one index to another, instead just the index outright. This is comparable to what we put out in the Weekend Newsletter.
- On an absolute basis, every sector is overbought but Energy. The graph shows the score, which is not normalized. Not surprisingly, Technology and Communications are the most overbought.
- The chart to the right graphs the absolute score (orange line) of the S&P with its price in gray. While its extremely overbought score fell slightly this past week, the S&P 500 is still more overbought today than at the prior record highs in February.
Graphs (Click on the graphs to expand)
The ETFs used in the model are as follows:
- Staples XLP
- Utilities XLU
- Health Care XLV
- Real Estate XLRE
- Materials XLB
- Industrials XLI
- Communications XLC
- Banking XLF
- Transportation XTN
- Energy XLE
- Discretionary XLY
- S&P 500 SPY
- Value IVE
- Growth IVW
- Small Cap SLY
- Mid Cap MDY
- Momentum MTUM
- Equal Weighted S&P 500 RSP
- NASDAQ QQQ
- Dow Jones DIA
- Emerg. Markets EEM
- Foreign Markets EFA
- IG Corp Bonds LQD
- High Yield Bonds HYG
- Long Tsy Bonds TLT
- Med Term Tsy IEI
- Mortgages MBB
- Inflation TIP


Michael Lebowitz, CFA is an Investment Analyst and Portfolio Manager for RIA Advisors. specializing in macroeconomic research, valuations, asset allocation, and risk management. RIA Contributing Editor and Research Director. CFA is an Investment Analyst and Portfolio Manager; Co-founder of 720 Global Research.
Follow Michael on Twitter or go to 720global.com for more research and analysis.
Customer Relationship Summary (Form CRS)
Also Read


