


The Relative Value Report provides guidance on which sectors, factors, indexes, and bond classes are likely to outperform or underperform its appropriate benchmark as well its relative strength on an absolute basis.
Click on the Users Guide for details on the model’s relative value calculations as well as guidance on how to read the graphs.
This report is just one of many tools that we use to assess our holdings and decide on potential trades. Just because this report may send a strong buy or sell signal, we may not take any action if it is not affirmed in the other research and models we use.
Commentary
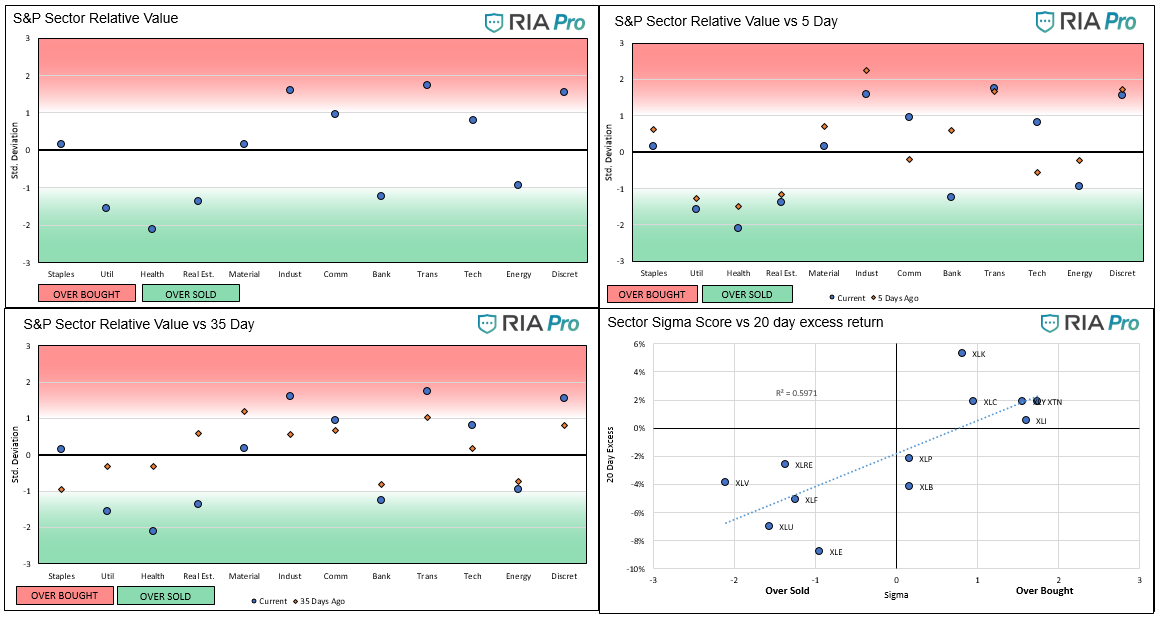
- Utilities, Healthcare, and Realestate are the three cheapest sectors versus the S&P 500. Industrials, Transportations, and Discretionary are the most expensive.
- Investors in Industrials and Transportations sectors are clearly betting on a continuation of the reflation trade. Recent weakness in oil and copper, as well as the daunting fiscal stimulus cliff, make us wary of the inflation trade. We reduced exposure to Transports and Industrials this week while adding to Realestate.
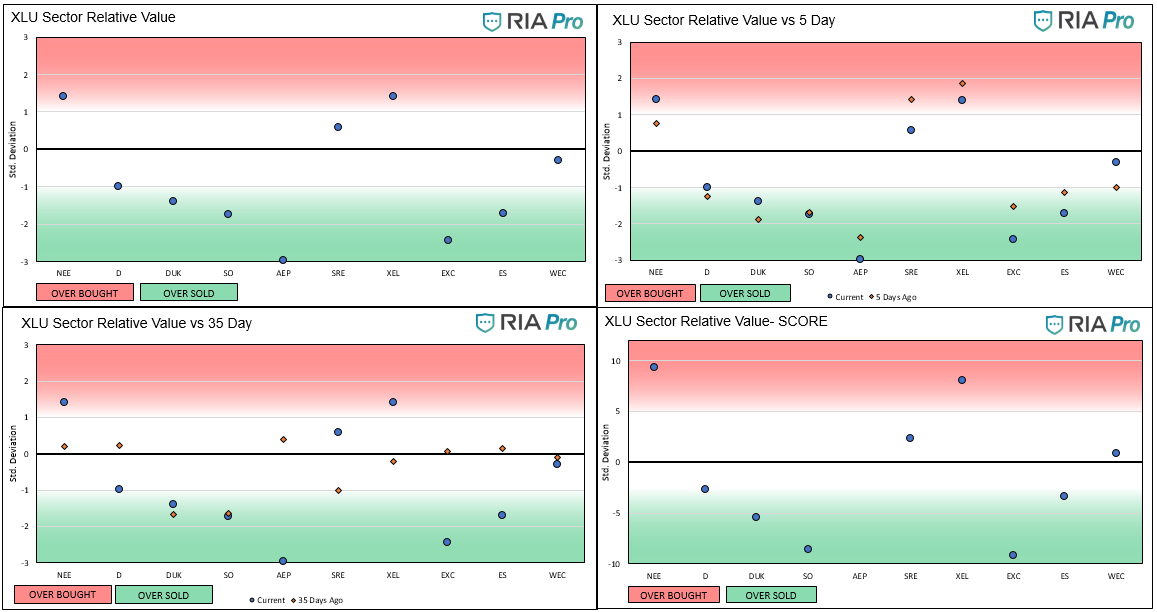
- We created a new set of analyses and charts allowing us to determine relative value by individual stocks in each sector versus the appropriate sector ETF. Below, in the last set of graphs, we present the Utility sector and its top ten holdings. Based on that analysis, AEP and EXC are oversold versus XLU. If you are looking to add to the sector, they may provide a relative pickup versus XLU. We own 2% of AEP and are considering adding to it.
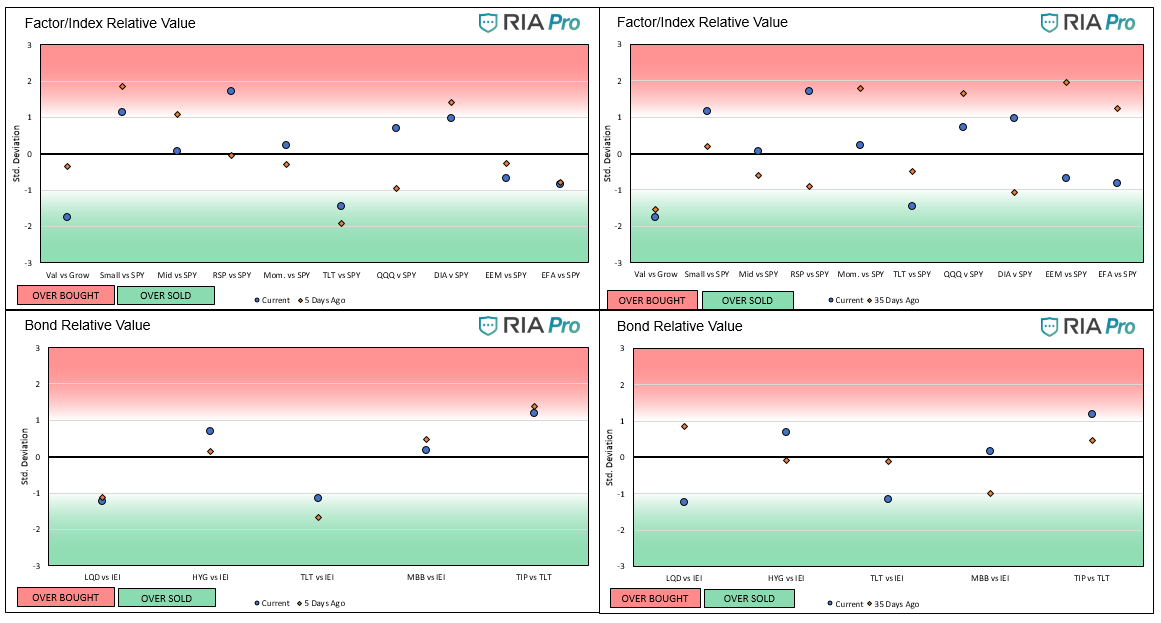
- After a few positive weeks, Value is languishing once again against the S&P. Most other indexes and factors are outperforming it. Interestingly, the equal-weighted S&P 500 (RSP) is now the most overbought index.
- On the bond front, TLT and LQD are marginally cheap versus 3-7 year USTs (IEI). Mortgages, MBB, after weeks of being oversold, have finally crossed slightly into overbought territory.
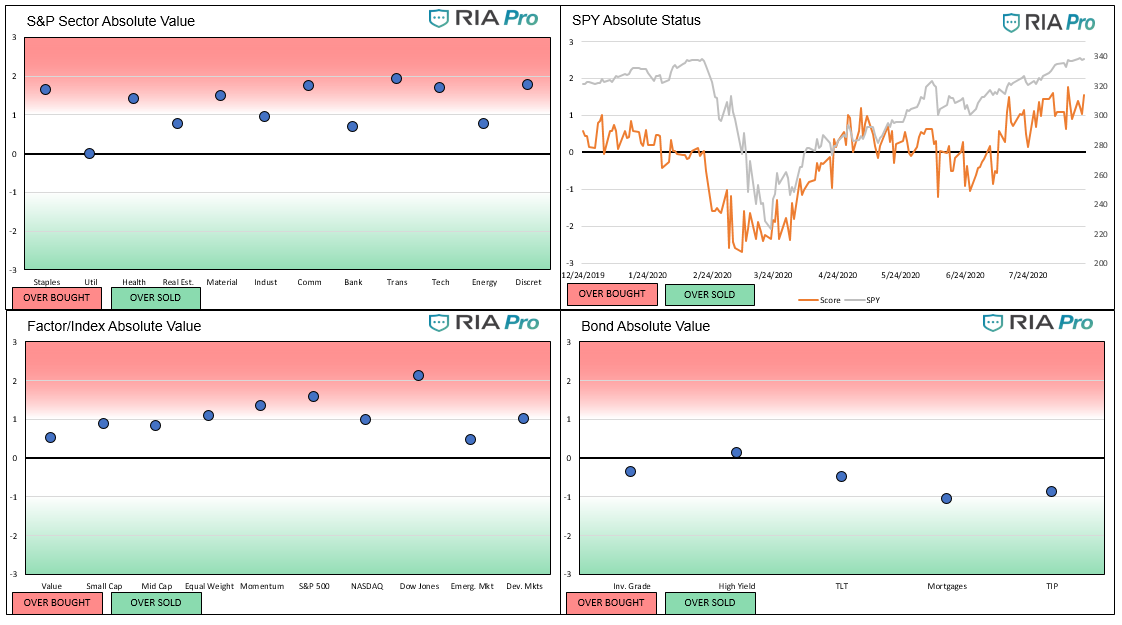
- On an absolute analysis (not relative to a benchmark) every sector, factor, and index, except utilities are overbought. The S&P 500 continued to stay near its most overbought levels of the year. Except for the high yield sector, all bonds are slightly oversold.
Graphs (Click on the graphs to expand)
The ETFs used in the model are as follows:
- Staples XLP
- Utilities XLU
- Health Care XLV
- Real Estate XLRE
- Materials XLB
- Industrials XLI
- Communications XLC
- Banking XLF
- Transportation XTN
- Energy XLE
- Discretionary XLY
- S&P 500 SPY
- Value IVE
- Growth IVW
- Small Cap SLY
- Mid Cap MDY
- Momentum MTUM
- Equal Weighted S&P 500 RSP
- NASDAQ QQQ
- Dow Jones DIA
- Emerg. Markets EEM
- Foreign Markets EFA
- IG Corp Bonds LQD
- High Yield Bonds HYG
- Long Tsy Bonds TLT
- Med Term Tsy IEI
- Mortgages MBB
- Inflation TIP


Michael Lebowitz, CFA is an Investment Analyst and Portfolio Manager for RIA Advisors. specializing in macroeconomic research, valuations, asset allocation, and risk management. RIA Contributing Editor and Research Director. CFA is an Investment Analyst and Portfolio Manager; Co-founder of 720 Global Research.
Follow Michael on Twitter or go to 720global.com for more research and analysis.
Customer Relationship Summary (Form CRS)
Also Read


