


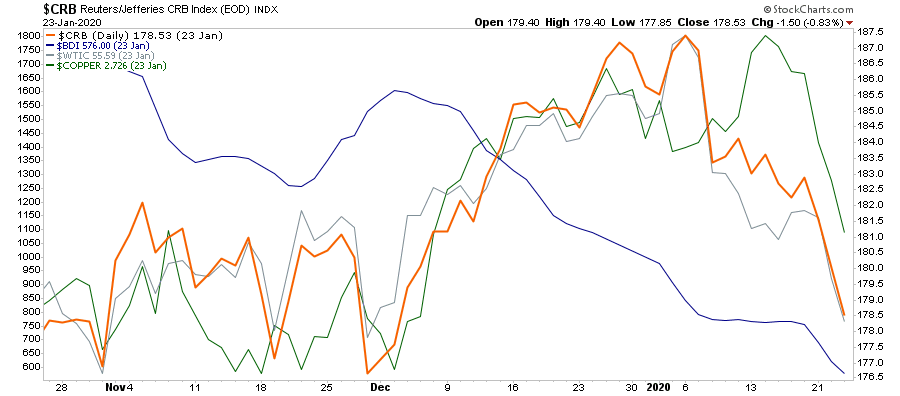
As we have been warning for the last couple of months in our weekly newsletter, the ongoing collapse in commodity prices suggested a problem was emerging that trailing “sentiment” data was clearly overlooking. To wit:
“There are a few indicators which, by their very nature, should be signaling a surge in economic activity if there was indeed going to be one. Copper, energy prices, commodities in general, and the Baltic Dry index, should all be rising if economic activity is indeed beginning to recover.
Not surprisingly, as the “trade deal” was agreed to, we DID see a pickup in commodity prices, which was reflected in the stronger economic reports as of late. However, while the media is crowing that “reflation is on the horizon,” the commodity complex is suggesting that whatever bump there was from the “trade deal,” is now over.”
Importantly, that decline happened BEFORE the “Coronavirus,” which suggests the virus will only worsen the potential impact.
I want to reiterate an important point.
The risk to the market, and the economy, is not “sick people.” It is the shutdown of the global supply chain.
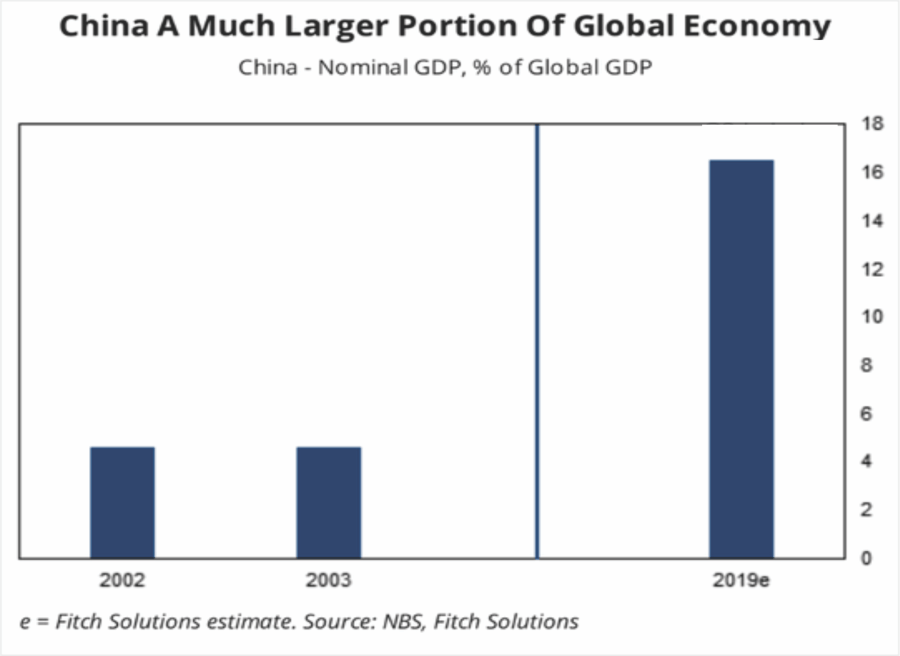
China is a substantially larger portion, and economically more important, than it was in 2003 when SARS hit. As noted by Johnson & Palmer of Foreign Policy:
“China itself is a much more crucial player in the global economy than it was at the time of SARS, or severe acute respiratory syndrome, in 2003. It occupies a central place in many supply chains used by other manufacturing countries—including pharmaceuticals, with China home to 13 percent of facilities that make ingredients for U.S. drugs—and is a voracious buyer of raw materials and other commodities, including oil, natural gas, and soybeans. That means that any economic hiccups for China this year—coming on the heels of its worst economic performance in 30 years—will have a bigger impact on the rest of the world than during past crises.
That is particularly true given the epicenter of the outbreak: Wuhan, which is now under effective quarantine, is a riverine and rail transportation hub that is a key node in shipping bulky commodities between China’s coast and its interior.
But it isn’t just China. It is also hitting two other economically important countries: Japan and South Korea, which will further stall exports and imports to the U.S.
Given that U.S. exporters have already been under pressure from the impact of the “trade war,” the current outbreak could lead to further deterioration of exports to and from China, South Korea, and Japan. This is not inconsequential as exports make up about 40% of corporate profits in the U.S. With economic growth already struggling to maintain 2% growth currently, the virus could shave between 1-1.5% off that number.
With our Economic Output Composite Indicator (EOCI) already at levels which has previously denoted recessions, the “timing” of the virus could have more serious consequences than currently expected by overzealous market investors.
(The EOCI is comprised of the Fed Regional Surveys, CFNAI, Chicago PMI, NFIB, LEI, and ISM Composites. The indicator is a broad measure of hard and soft data of the U.S. economy)
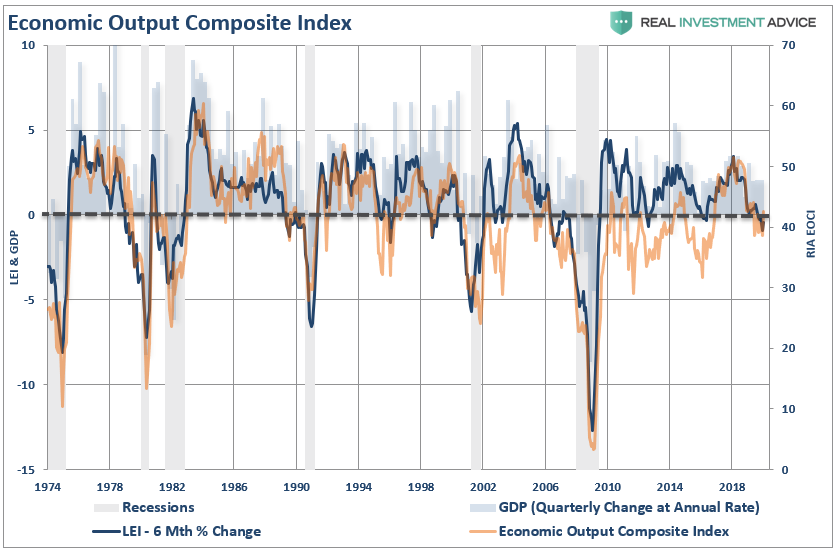
Given the current level of the index as compared to the 6-Month rate of change of the Leading Economic Index, there is a rising risk of a recessionary drag within the next 6-months.
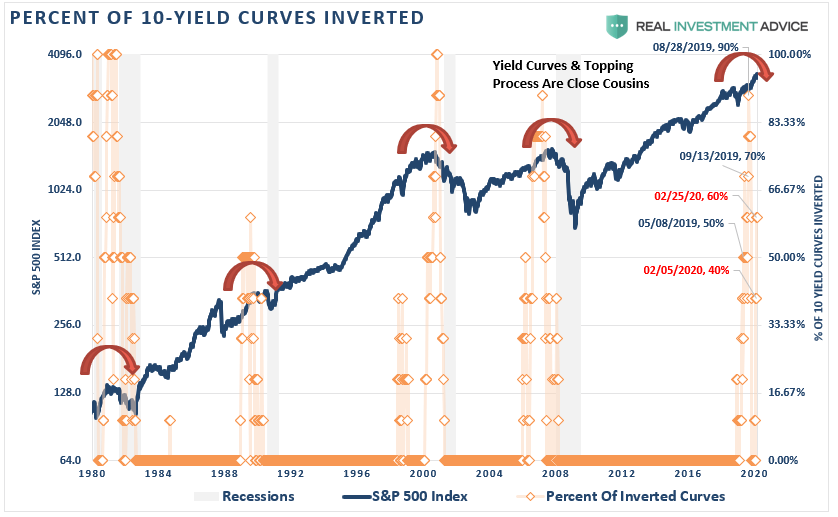
This is what the collapsing yield curve is already confirming as the 10-year plunged to the lowest levels on record. Currently, 60% of the yields we track have now inverted.
Outside of the indicators we track, Eric Hickman previously made similar observations:
“The long history (49+ years) of these indicators can be used to get a sense of timing for when a recession may begin. I have measured historically how long these indicators signaled before (or after) the start of their accompanying recession. Comparing this time-frame to when these indicators triggered recently, suggests a range for when this recession may come. The chart below shows the time ranges (minimum amount of time historically to maximum amount of time historically) in which each indicator would suggest a recession start.”

“There are a few conclusions to this. First, five recession indicators have signaled. Second, there is nothing unusual in the timing that the recession hasn’t started yet. Third, no matter which of the five indicators you use, a recession will likely begin in 2020 and the average center-point of the indicators is in March, just a little over two months away. Don’t confuse the Fed’s ‘on-hold’ stance to have any more meaning than the hope that the consumer and labor market’s strength will continue. History suggests that this is not a good bet to make.”
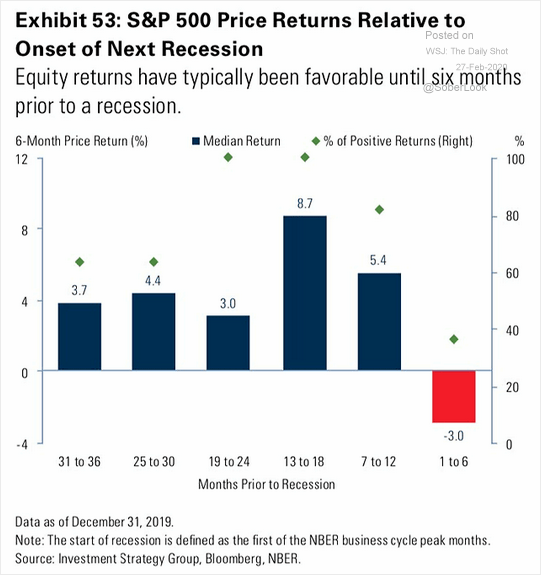
The problem with most of the current analysis, which suggests a “no recession” scenario, is based heavily on lagging economic data which is highly subject to negative revisions. The stock market, however, is a strong leading indicator of investor expectations of growth over the next 12-months. Historically, stock market returns are typically favorable until about 6-months prior to the start of a recession.
The compilation of the data all suggests the risk of recession is markedly higher than what the media currently suggests. Yields and commodities are suggesting something quite different.


Lance Roberts is a Chief Portfolio Strategist/Economist for RIA Advisors. He is also the host of “The Lance Roberts Podcast” and Chief Editor of the “Real Investment Advice” website and author of “Real Investment Daily” blog and “Real Investment Report“. Follow Lance on Facebook, Twitter, Linked-In and YouTube
Customer Relationship Summary (Form CRS)
Also Read


