


In this issue of “Powell Can’t Raise Rates As Economy Remains On Life-Support.”
- Market Review And Update
- Powell Says No Rate Hikes
- An Economic Coma
- Portfolio Positioning
- #MacroView: Is “Hyperinflation” Really A Threat
- Sector & Market Analysis
- 401k Plan Manager
Follow Us On: Twitter, Facebook, Linked-In, Sound Cloud, Seeking Alpha
RIA Advisors Can Now Manage Your 401k Plan
Too many choices? Unsure of what funds to select? Need a strategy to protect your retirement plan from a market downturn?
RIA Advisors can now manage your 401k plan for you. It’s quick, simple, and transparent. In just a few minutes, we can get you in the “right lane” for retirement.

Catch Up On What You Missed Last Week

Market Review & Update
Last week, we stated:
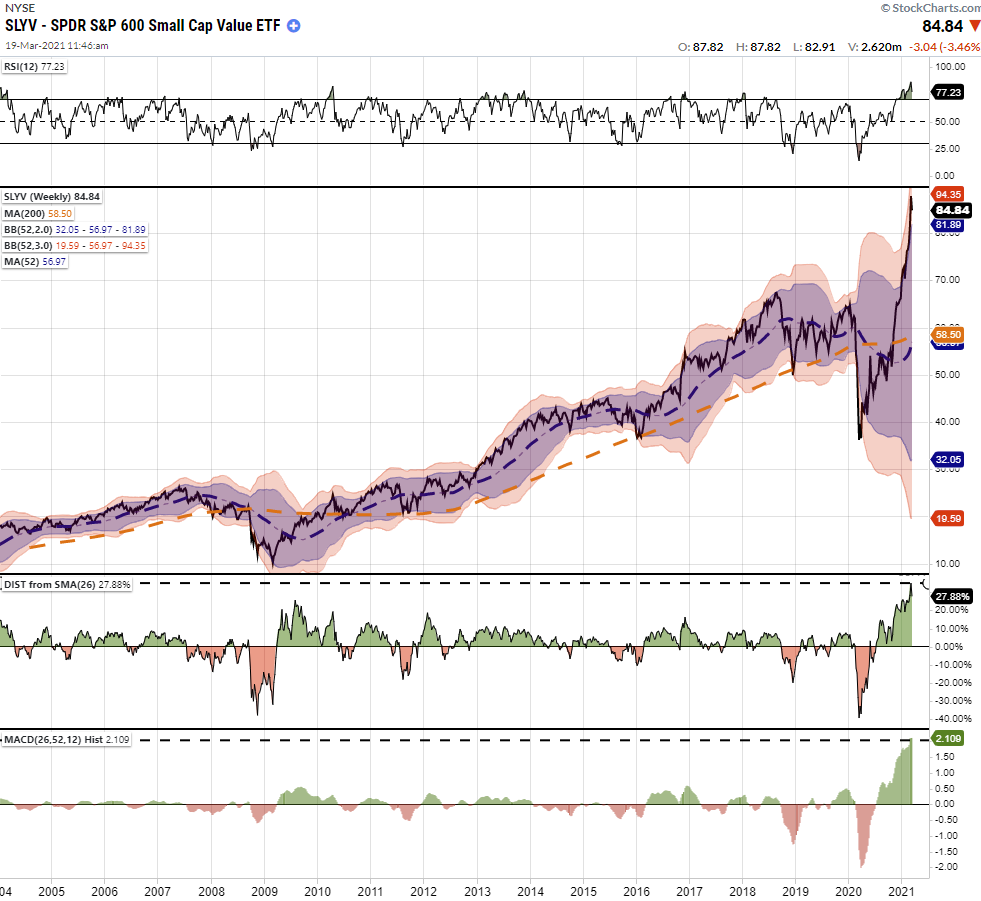
“With valuations still extended, the recent correction didn’t reduce speculative fervor. Furthermore, prices remain well deviated above long-term means, particularly in the small and mid-cap space.
While more stimulus will likely support prices over the next few weeks, the threat of rising inflation and interest rates could undermine growth expectations.”
Over the past week, the market didn’t make a lot of headway, as price rises were limited while intraday dips got repeatedly bought. Such is what we would expect with the “money flow” indicators we have discussed over the last several weeks back on “buy signals.” (Importantly, note that Friday’s early morning decline held the uptrend line from the October lows.)
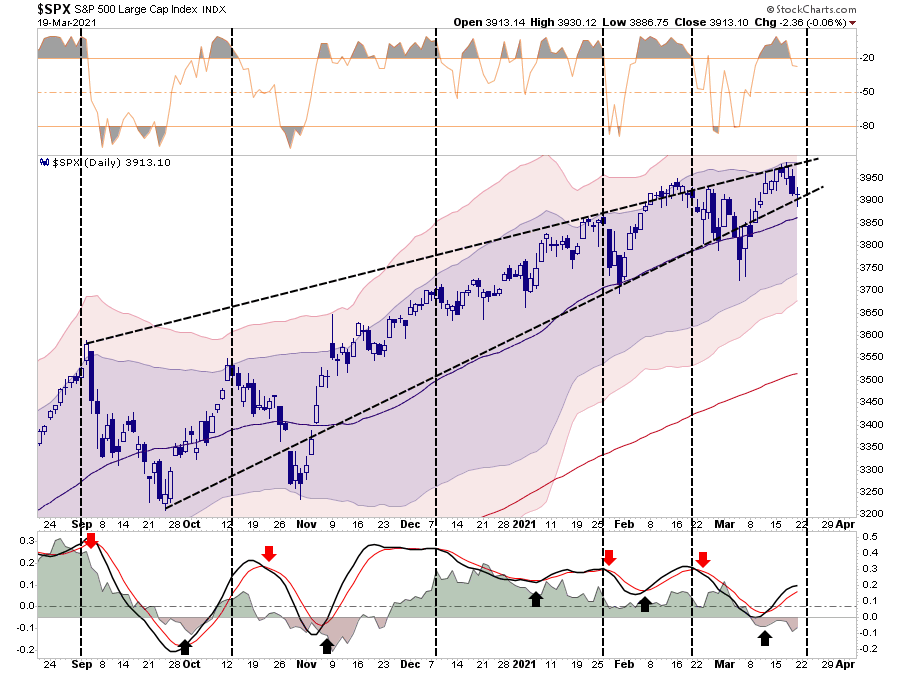
However, while overall market action remains bullish, there are two concerning points shown in the chart below. The highlighted box shows money flows remain negative currently. As stated previously, such suggests rallies may stay limited for now. The second is the negative divergence of the actual index (red dashed line) which also confirms the weakness of the underlying “buying.”
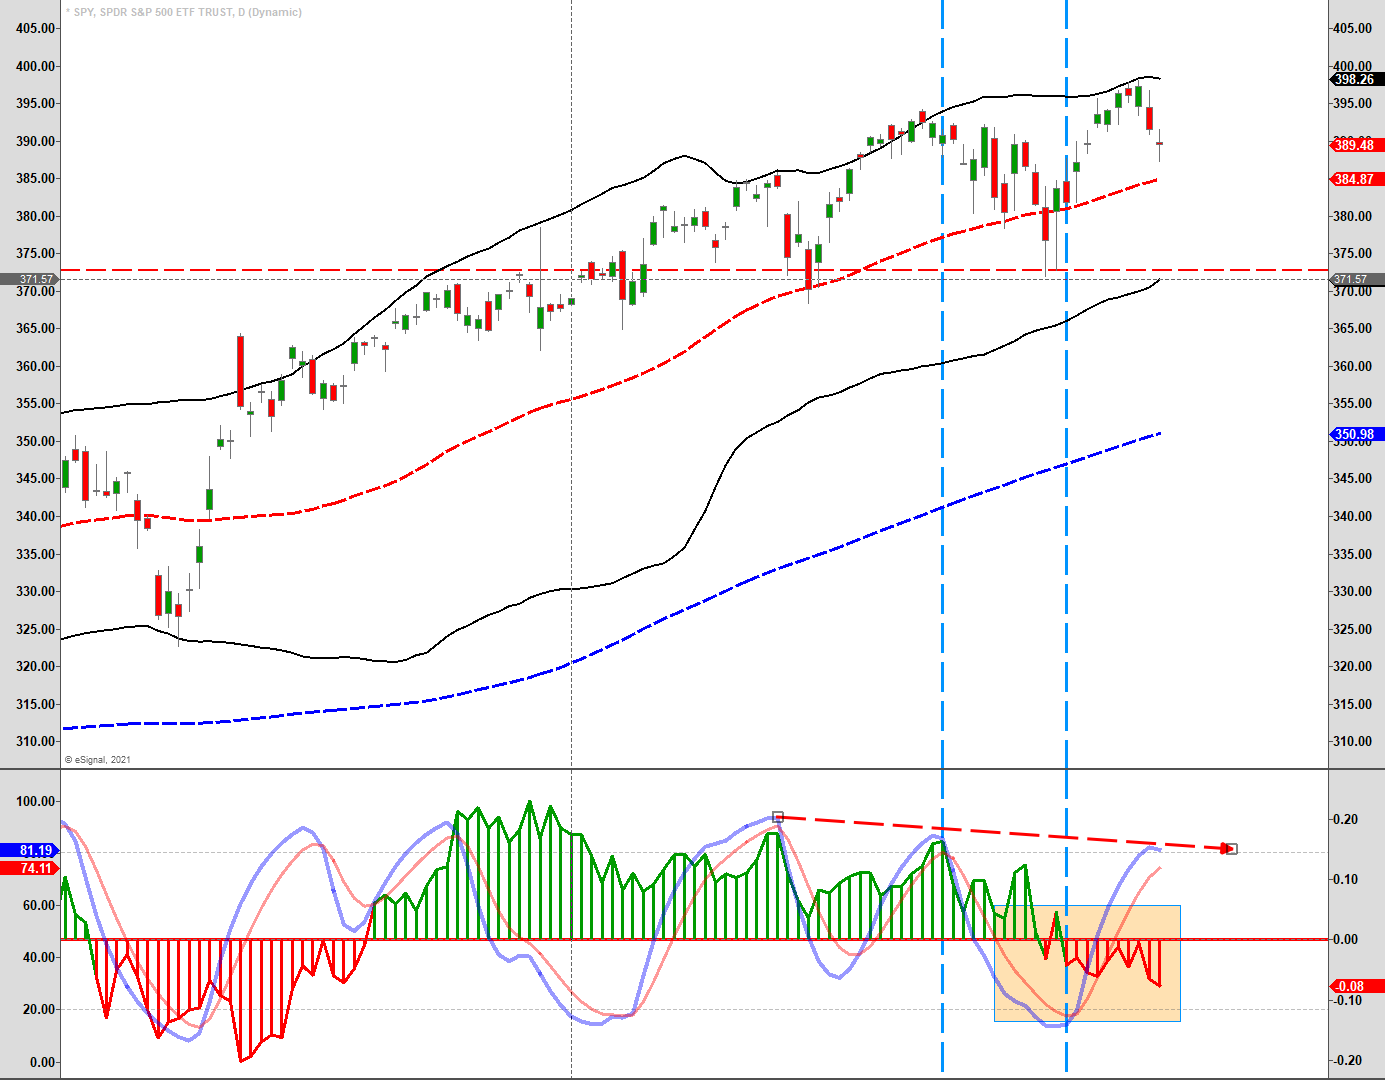
With our indicators still on “buy signals” across the board, the bias of prices near term is to the upside. However, with the oscillator now pushing into the upper zones, and starting to roll over, with the market overbought, further price increases will become more challenging.
We suggest using rallies over the next week or so to raise cash and reduce risk.
Rate Surge
Another more critical concern remains interest rates. The recent surge in rates has caused problems over the “growth” trade. As shown, the annual rate of change in rates has surged by 146% in recent months. That spike is unprecedented over the last 20-years but is a function of rates hitting 0.50% during the pandemic.
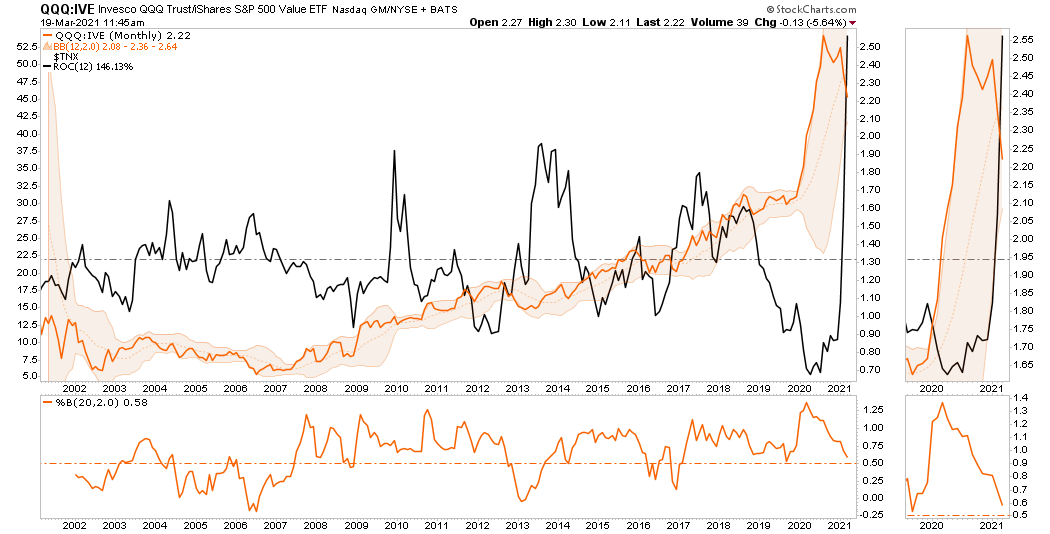
However, the recent underperformance of QQQ versus IVE (Value) is also unusual from a historical perspective. Previously, during swings higher in rates, the QQQ’s outperform IVE as investors sought companies that could generate earnings and had lower leverage.
Given the massive debt load corporations are carrying currently, combined with an inability to pass along higher input costs, I suspect we will see a rotation back towards growth. Such is particularly the case with companies already struggling with thin margins (especially in the small and mid-cap space.)
We suspect we may say a rotation from “value” back to “growth” sooner than later given the massive overbought conditions of the “value trade.”
For now, we are primarily maintaining our core positions. However, we did recently take profits in the highly overbought energy and financial positioning. We are starting to seriously look at further increasing our “growth” side of the portfolio during the next correction.

Powell Says No Rate Hikes
On Wednesday, Jerome Powell announced the latest changes to monetary policy. Instead, it was the lack of changes to the policy that was the most interesting.
“The U.S. economy is heading for its strongest growth in nearly 40 years, the Federal Reserve said on Wednesday, and central bank policymakers are pledging to keep their foot on the gas despite an expected surge of inflation.” – Reuters
In other words, despite the Fed’s mandate of maximum employment and price stability, the Fed is opting to let things run “hot” for quite some time to ensure that growth is “sticky.”
That stance makes some sense, given the economy still requires massive liquidity support more than a decade after the financial crisis. As I discussed previously in “Forever Stimulus:”
“They are increasingly on what I call a no-exit paradigm.
To understand the problem, we have to go back to the beginning. As we noted in our article on financial rescues, the bailouts and stimulus programs started in 2008 when the Federal Reserve intervened with the insolvency of Bear Stearns. They haven’t stopped since.”
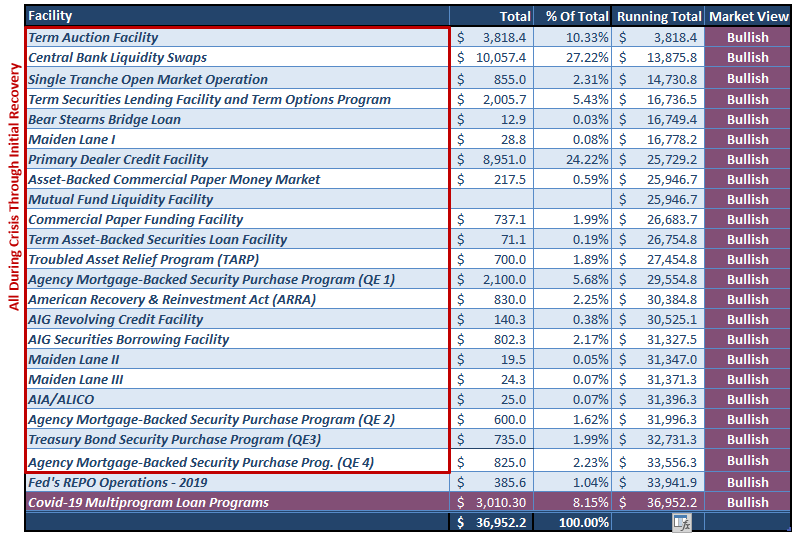
“To date, the Federal Reserve, and the Government, have pumped more than $36 Trillion into the economy. As shown below, the amount of economic growth achieved has been minimal during that same time frame. (The chart is the cumulative growth of interventions compared to the incremental increase in GDP.)”
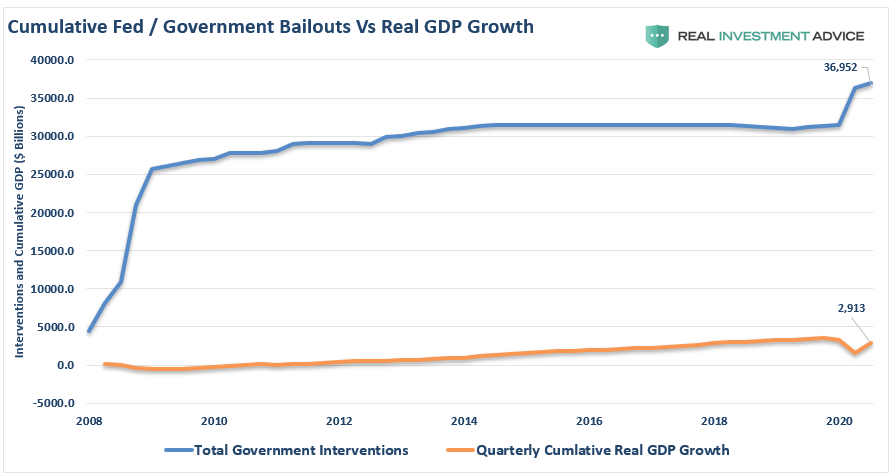
“What this equates to is more than $12 of liquidity for each $1 of economic growth.”
Not Won’t, But Rather Can’t
The Federal Reserve stumbled into a trap where continual interventions are required to sustain lower economic growth rates. Whenever the Fed withdraws interventions, economic growth collapses.
Such is why the applause by the media that Powell “won’t” raise rates is “silly.” The Fed had “no choice” but to keep rates unchanged and continue buying $120 billion a month in bonds. Any other choice would have been a disaster.
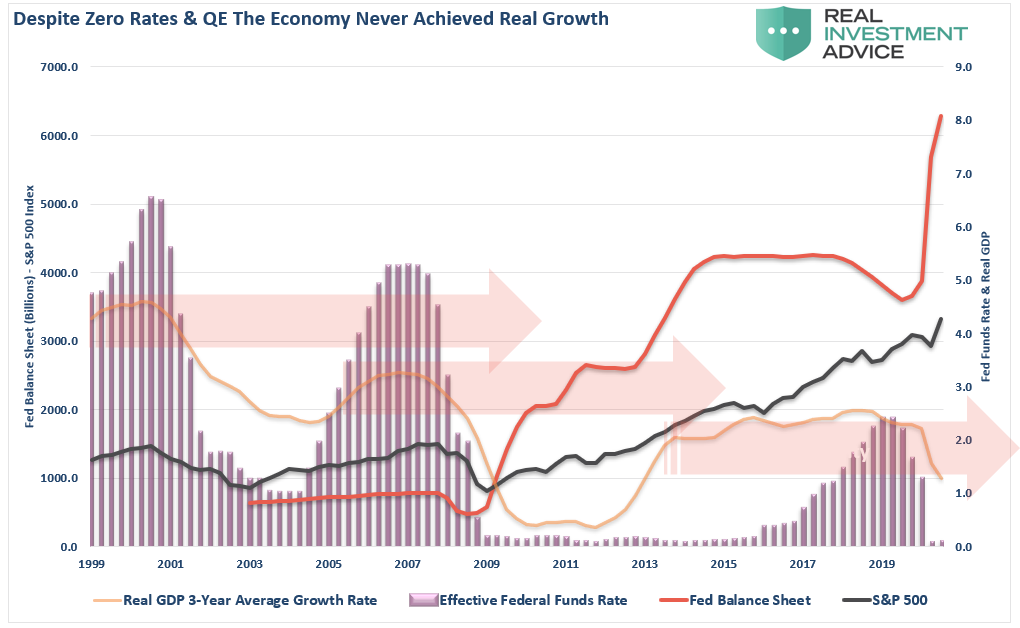
History also shows why the Fed is trapped. Since the turn of the century, each economic cycle has failed to attain a higher growth rate than previously. The Federal Reserve lowers interest rates to stimulate growth without much return on the capital spent. However, after reaching the “zero bound,” lower rates alone were ineffective, forcing the Fed into liquidity measures.
The problem now is that even if they wanted to increase rates and slow bond purchases, they can’t. Therefore, their only option is to “hope” that inflation will rise without getting out of control.
I suspect the result will not be great.

An Economic Coma
“We stand at a monetary crossroads as we continue to double down and embark on monetary policy that is detrimental to society and to our financial markets.
Yesterday, current Fed Chair Powell, like former Fed Chair Bernanke exhibited that he is out of touch and that he lives in a bubble that he has helped to create.” – Doug Kass
The mainstream media missed another crucial point while tripping over each other to fawn over Powell’s statement. It also underscores our comment about why growth will remain elusive.
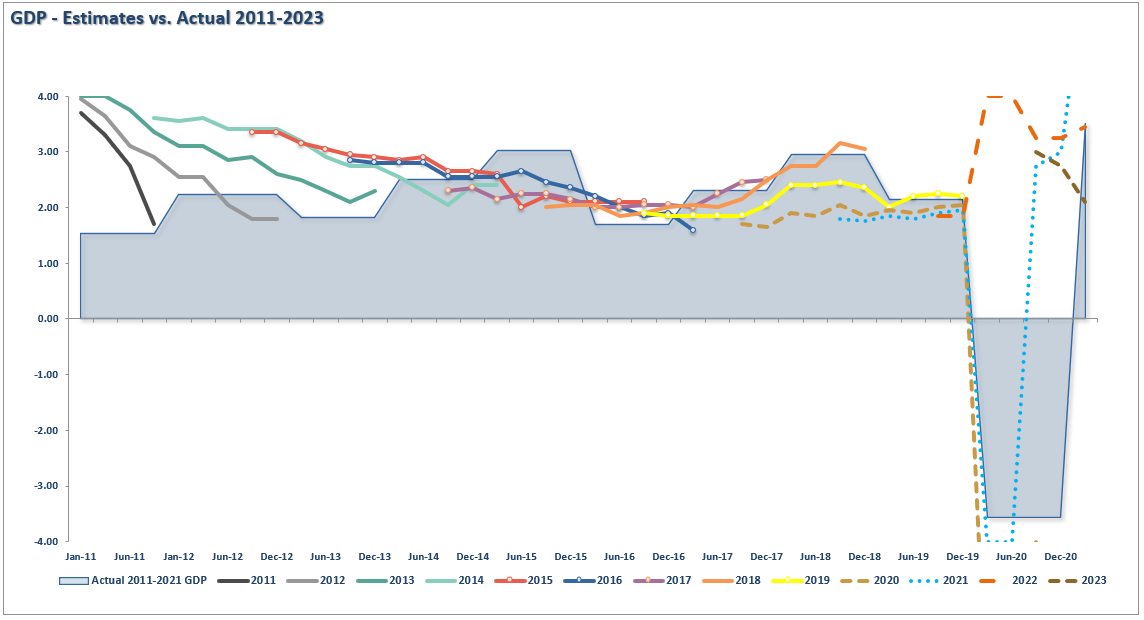
In the short-term, yes, there will be a surge in economic growth. However, as the table of the average of the Fed’s projections shows, after a short-term bump of activity, the economy will quickly slip back into its “coma” from the last decade.
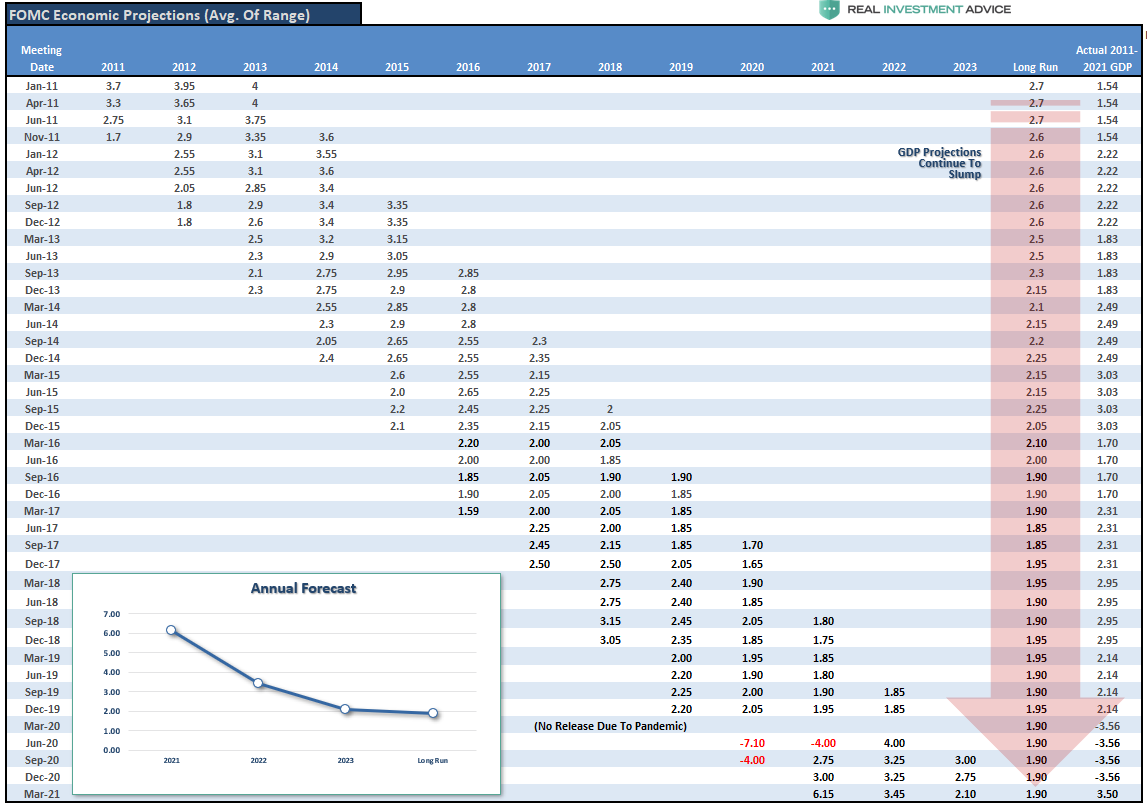
The chart below shows that the Fed tends to be overly optimistic in its assumptions in almost all cases. The actual real GDP growth rate disappoints more often than not.
The point here is that despite protestations from the financial media, monetary policy does not create or sustain economic growth or employment. All monetary policy does is drag forward future consumption.
Growth, as a result, is primarily an illusion.
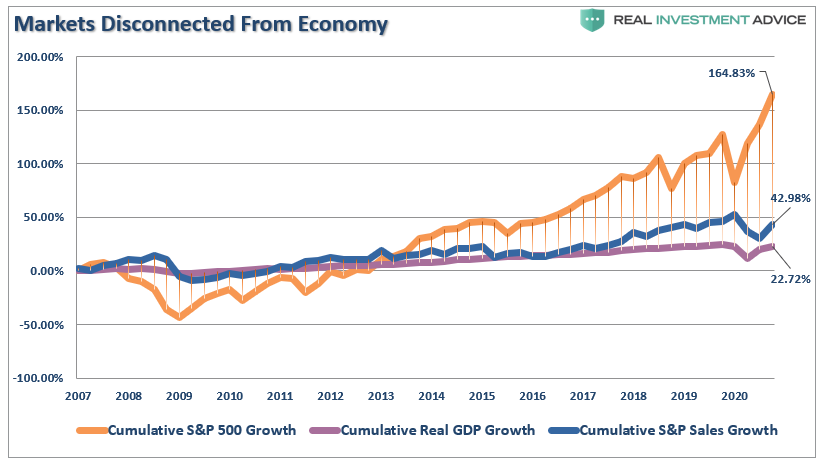
(From the peak in 2007 through year-end 2020, the S&P rose 165%, actual revenue increased by only 43%, while economic growth struggled to rise a cumulative 23%.)
While the Fed hopes they can sustain inflation above 2% for 3-years, I think the Fed realizes deflation remains a more significant threat. (A subject of this week’s #MacroView)

The Rate Trap
I want to be very clear.
In the short-term, we will see rising inflationary pressures and economic activity from the massive amount of liquidity flooding into the economy.
However, longer-term, it is all deflationary. My partner Michael Lebowitz made an important observation on Wednesday in “The Next Crisis:”
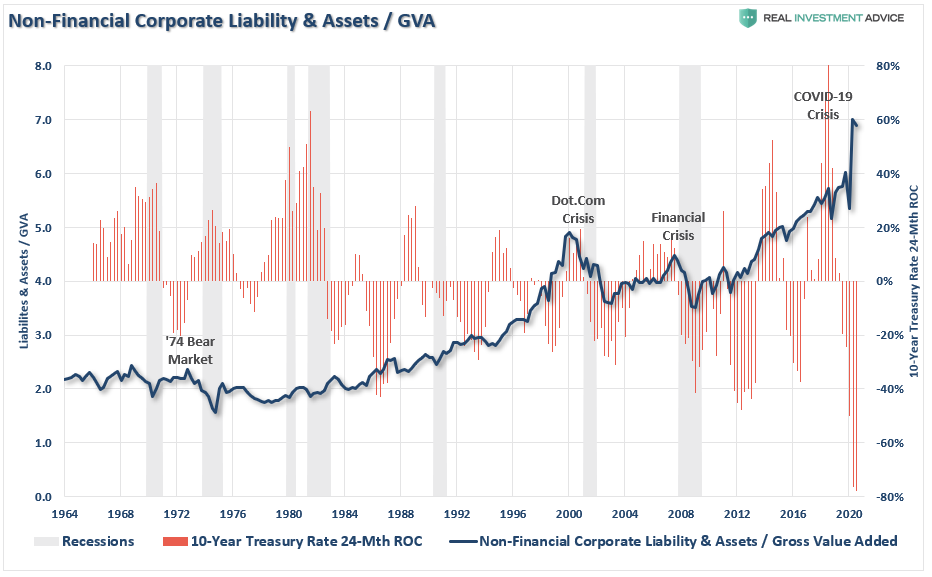
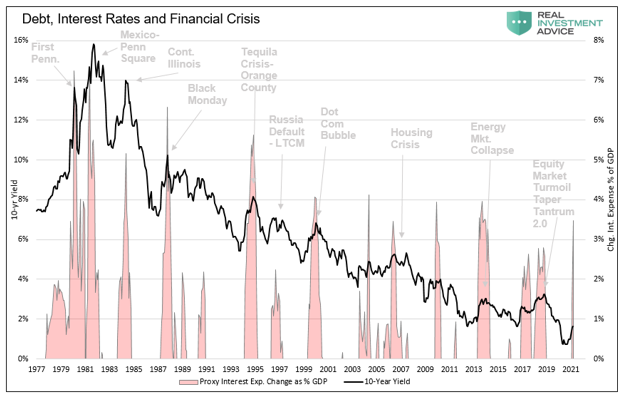
“Looking back over the last 40 years reveals a troubling problem. Every time interest rates reach the upper end of its downward trend, a financial crisis of sorts occurred.”
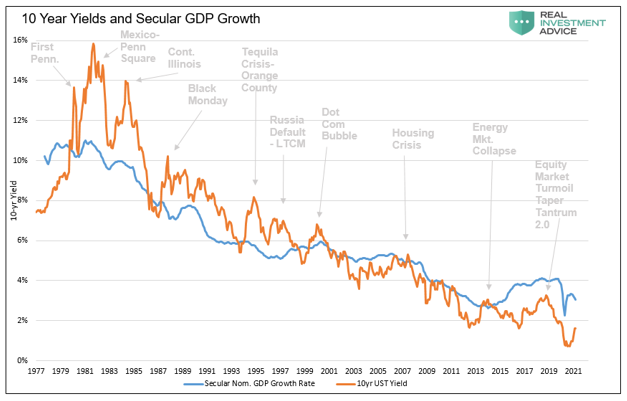
“Given crises frequently occur when rates rise sharply, we should contemplate how high rates can rise before the next crisis. Notice, as time goes on it takes less and less of a rate increase to generate a problem. The reason, as highlighted earlier, is the growth of debt outpaces the ability to pay for it.
The current one-year change in the proxy interest expense is up 3.50% from a year ago. As shown, the last two significant crises (2000 and 2008), along with a few minor ones, all happened when the proxy rose between three and four percent.
If Ten-year UST yields increase to 2.0% (currently 1.60%) by May, the proxy will increase to 5.25%, well above the 4.0% that popped the dot com and housing bubbles.”
The Fed’s problem is that while they may not be hiking rates, the bond market is doing it for them. Given the Fed’s actions are what causes rates to rise, by shifting risk preference, the result is a deflationary crash requiring more interventions and lower rates.
Wash. Rinse. Repeat.
I am going to leave you with one question:
“If monetary policy does create economic growth, inflation and sustainable employment, then why, after more than a decade, is the Fed still having to support the financial markets?”

Portfolio Update
The market continued to fluctuate this past week, as recent highs remain a challenge to hold onto. While over the last two weeks, we repeated steps to rebalance portfolio risk, portfolios continued to remain under pressure on the “growth” side.
We continued to take profits earlier this week by reducing our energy and financial names a bit to take profits. Such increased our overweight cash position slightly. Even though we are very short in the duration of our bond holdings, the sharp rise in yields this week pressured that side of the portfolio.
As noted in our market update, we are more than 2/3rds of the way through the current rally cycle, which increases downside risk as we head into April. The rise in yields, and ultimately the dollar, remains the key to the current market cycle. With the “value trade” excessively overbought and has become the recent “momentum” trade, we may see a relatively rapid rotation back into recently beaten-up sectors.
The #value trade is now a #momentum trade. pic.twitter.com/fgHLnvkiyJ
— Lance Roberts (@LanceRoberts) March 18, 2021
We believe the Fed is once again making a policy-mistake that will cost investors dearly. However, such will take time to play out, so investors will dismiss the warning short-term as “it’s different this time.”
They don't ring a bell at the top. Instead they put a sideshow barker on every street corner touting the ten-headed lady they've got inside the tent.
If you listen closely, you can almost hear "Step right up and behold the most amazing, the most extraordinary opportunity ever."
— Peter Atwater (@Peter_Atwater) March 17, 2021
I suspect it won’t be.
The MacroView

If you need help or have questions, we are always glad to help. Just email me.
See You Next Week
By Lance Roberts, CIO
Market & Sector Analysis
Analysis & Stock Screens Exclusively For RIAPro Members
S&P 500 Tear Sheet

Performance Analysis
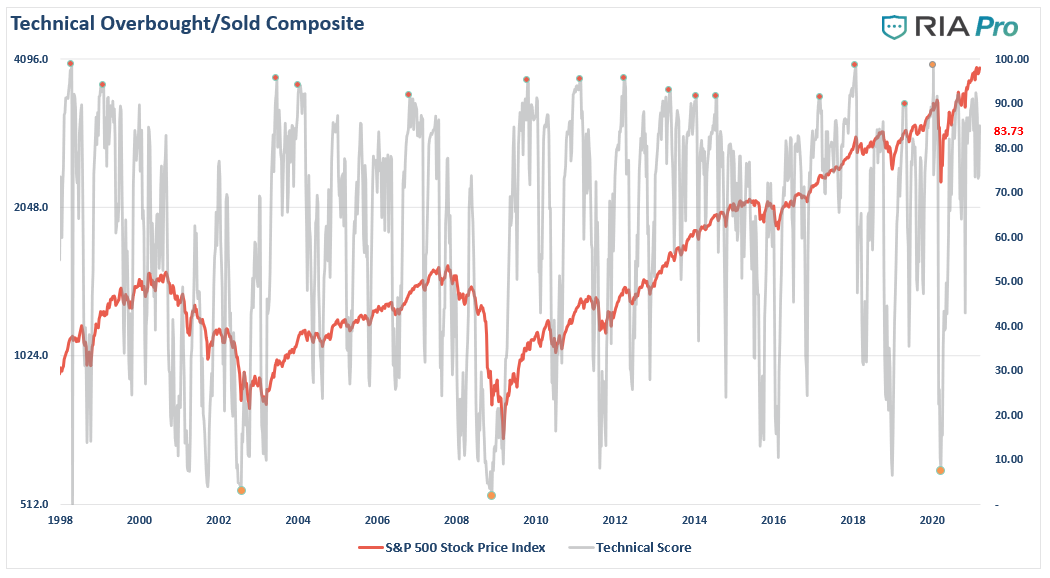
Technical Composite
The technical overbought/sold gauge comprises several price indicators (RSI, Williams %R, etc.), measured using “weekly” closing price data. Readings above “80” are considered overbought, and below “20” is oversold. The current reading is 85.02 out of a possible 100.
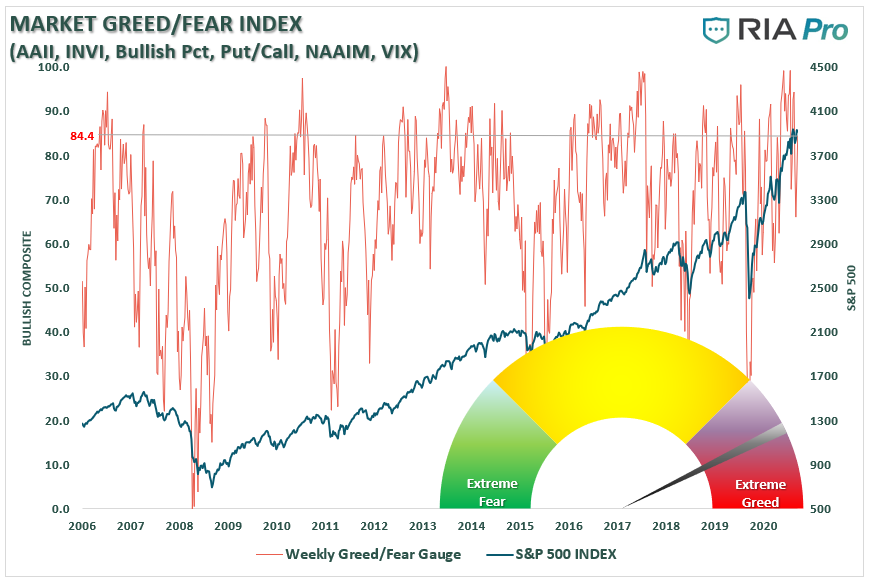
Portfolio Positioning “Fear / Greed” Gauge
The “Fear/Greed” gauge is how individual and professional investors are “positioning” themselves in the market based on their equity exposure. From a contrarian position, the higher the allocation to equities, to more likely the market is closer to a correction than not. The gauge uses weekly closing data.
NOTE: The Fear/Greed Index measures risk from 0-100. It is a rarity that it reaches levels above 90. The current reading is 84.4 out of a possible 100.
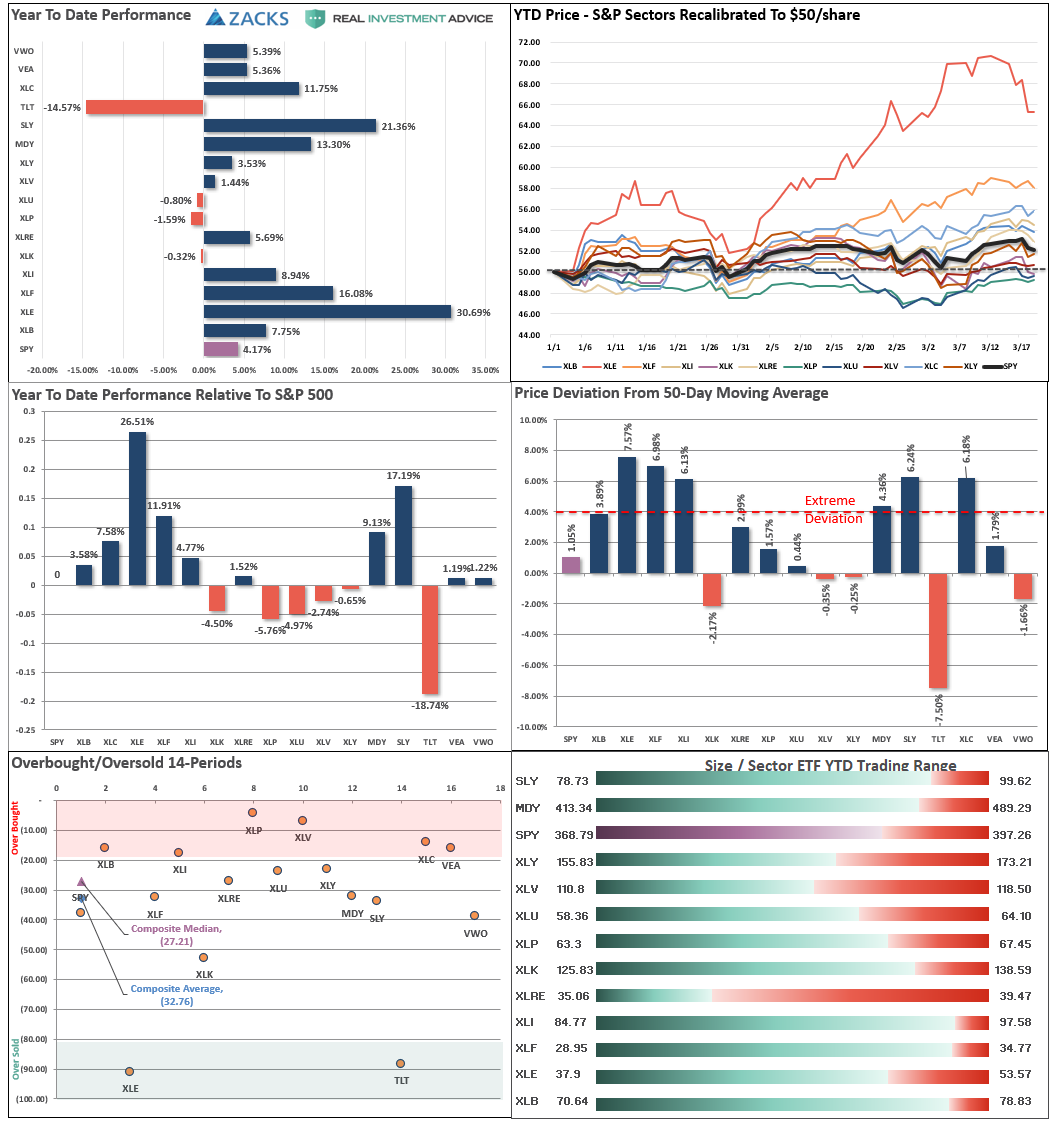
Sector Model Analysis & Risk Ranges
How To Read.
- The table compares each sector and market to the S&P 500 index on relative performance.
- The “MA XVER” is determined by whether the short-term weekly moving average crosses positively or negatively with the long-term weekly moving average.
- The risk range is a function of the month-end closing price and the “beta” of the sector or market.
- The table shows the price deviation above and below the weekly moving averages.

Weekly Stock Screens
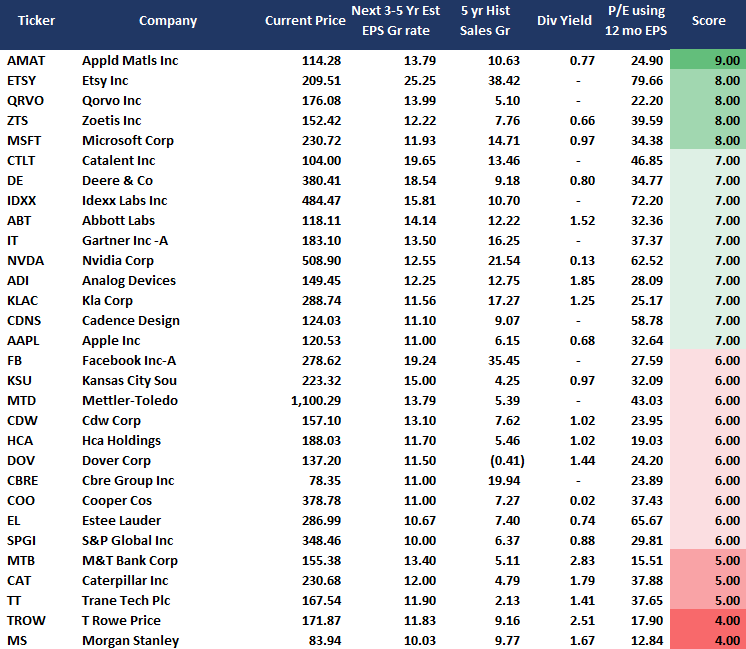
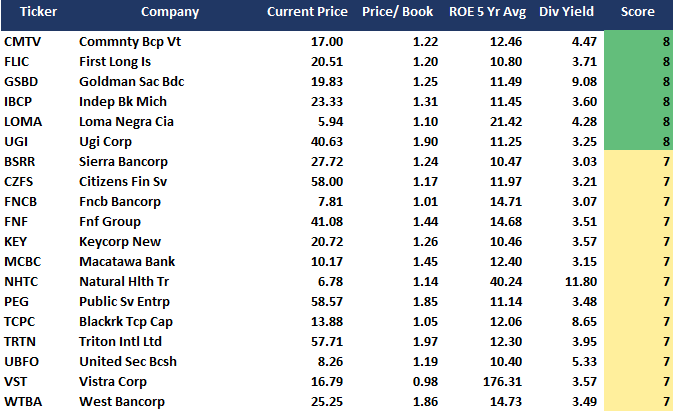
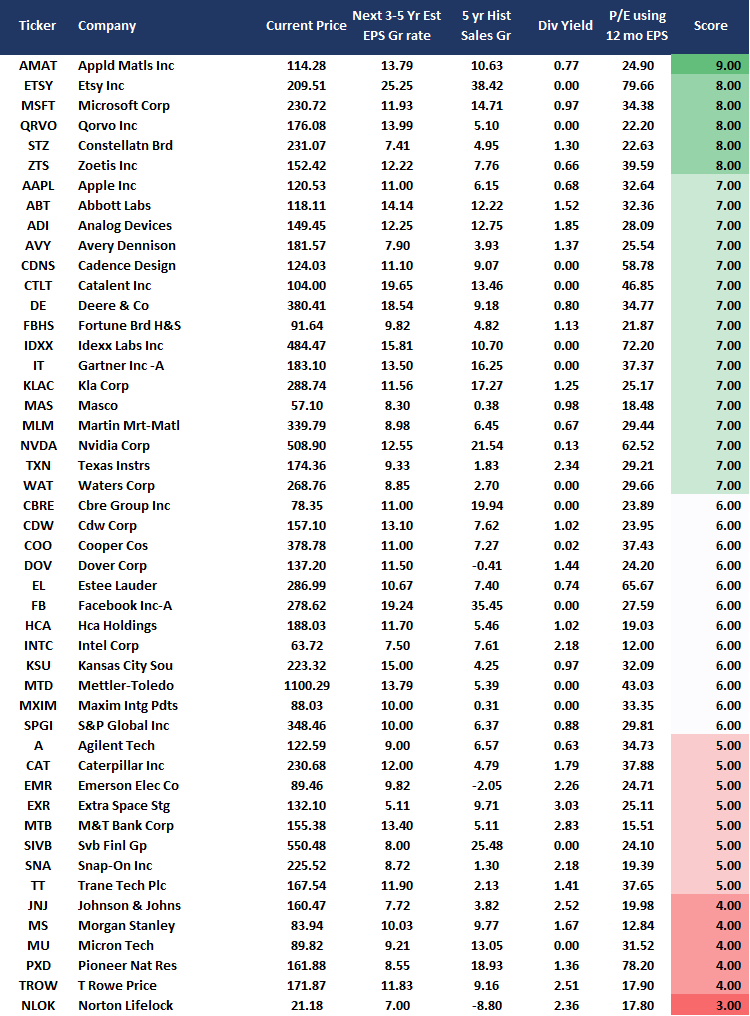
Currently, there are four different stock screens for you to review. The first is S&P 500 based companies with a “Growth” focus, the second is a “Value” screen on the entire universe of stocks, and the last are stocks that are “Technically” strong and breaking above their respective 50-dma.
We have provided the yield of each security and a Piotroski Score ranking to help you find fundamentally strong companies on each screen. (For more on the Piotroski Score – read this report.)
S&P 500 Growth Screen
Low P/B, High-Value Score, High Dividend Screen
NEW! Fundamental Growth Screen
Aggressive Growth Strategy

Portfolio / Client Update
As discussed over the past two weeks, the market “indigestion” continues even while indicators remain on “buy signals.” However, the rotation between sectors and markets has been vicious, making managing risk exceedingly tricky.
However, as noted last week:
“Our longer-term indicators are still negative which could apply some downside pressure and limit upside.”
Such did remain the case this week as markets struggled to hold ground. The risk/reward balances in some market areas are improving, and we are looking for opportunities accordingly. We are continuing to use this rally to rebalance holdings and create a barbell approach in portfolios between “value” and “growth.”
Furthermore, with yields having reached our target “buy” zone, there is a decent “risk/reward” to add some additional exposures back to portfolios to further hedge equity risk. We aren’t entirely ready to commit to that trade, but we are watching for the right opportunity.
As always, we continue watching our indicators closely. However, support at the 50-dma held, and markets recovered back to all-time highs. Such negates downside risk in the short-term.
We continue to look for opportunities to expand our portfolio as needed.
Portfolio Changes
During the past week, we made minor changes to portfolios. We post all trades in real-time at RIAPRO.NET.
** Equity / ETF Portfolio – Trade Update ***
“After a nice run-up in the banks/financials, we are taking some profits.” – 03/16/21
- Equity model- reduce GS and JPM from 2% to 1.5%
- Sector model- reduce XLF from 4% to 3%
These changes follow up on our actions last Monday, reducing our exposure to “energy,” which has been under considerable pressure this past week.
“We are using the early morning rally to rebalance portfolios once again as the “energy” trade has gotten way ahead of itself. We also got stopped out of two positions in the Dynamic Model which we are raising some cash to add back into current holdings on the upcoming money flow buy signal.” – 03/08/21
Equity Model
- Reducing all energy holdings back to the model weight of 1% each. – MRO, KMI, XOM, FANG
ETF Model
- Reduce XLE back to portfolio model weight of 3% – taking profits.
- Reduce XLC back to portfolio model weight of 5% – taking profits.
As always, our short-term concern remains the protection of your portfolio. We have now shifted our focus from the election back to the economic recovery and where we go from here.
Lance Roberts
CIO
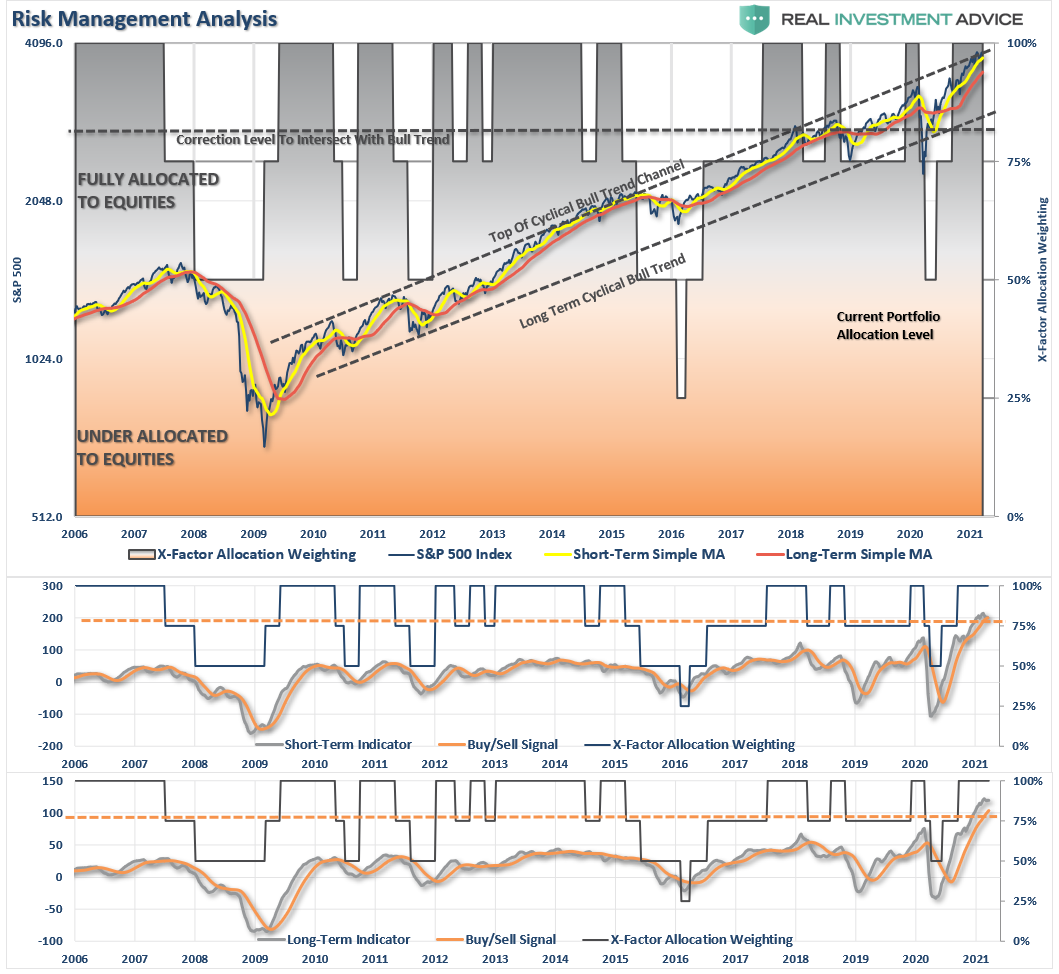
THE REAL 401k PLAN MANAGER
A Conservative Strategy For Long-Term Investors

If you need help after reading the alert, do not hesitate to contact me.

Model performance is a two-asset model of stocks and bonds relative to the weighting changes made each week in the newsletter. Such is strictly for informational and educational purposes only, and one should not rely on it for any reason. Past performance is not a guarantee of future results. Use at your own risk and peril.

401k Plan Manager Live Model
As an RIA PRO subscriber (You get your first 30-days free), you can access our live 401k plan manager.
Compare your current 401k allocation to our recommendation for your company-specific plan and our 401k model allocation.
You can also track performance, estimate future values based on your savings and expected returns, and dig down into your sector and market allocations.
If you would like to offer our service to your employees at a deeply discounted corporate rate, please contact me.


Lance Roberts is a Chief Portfolio Strategist/Economist for RIA Advisors. He is also the host of “The Lance Roberts Podcast” and Chief Editor of the “Real Investment Advice” website and author of “Real Investment Daily” blog and “Real Investment Report“. Follow Lance on Facebook, Twitter, Linked-In and YouTube
Customer Relationship Summary (Form CRS)
Also Read


