


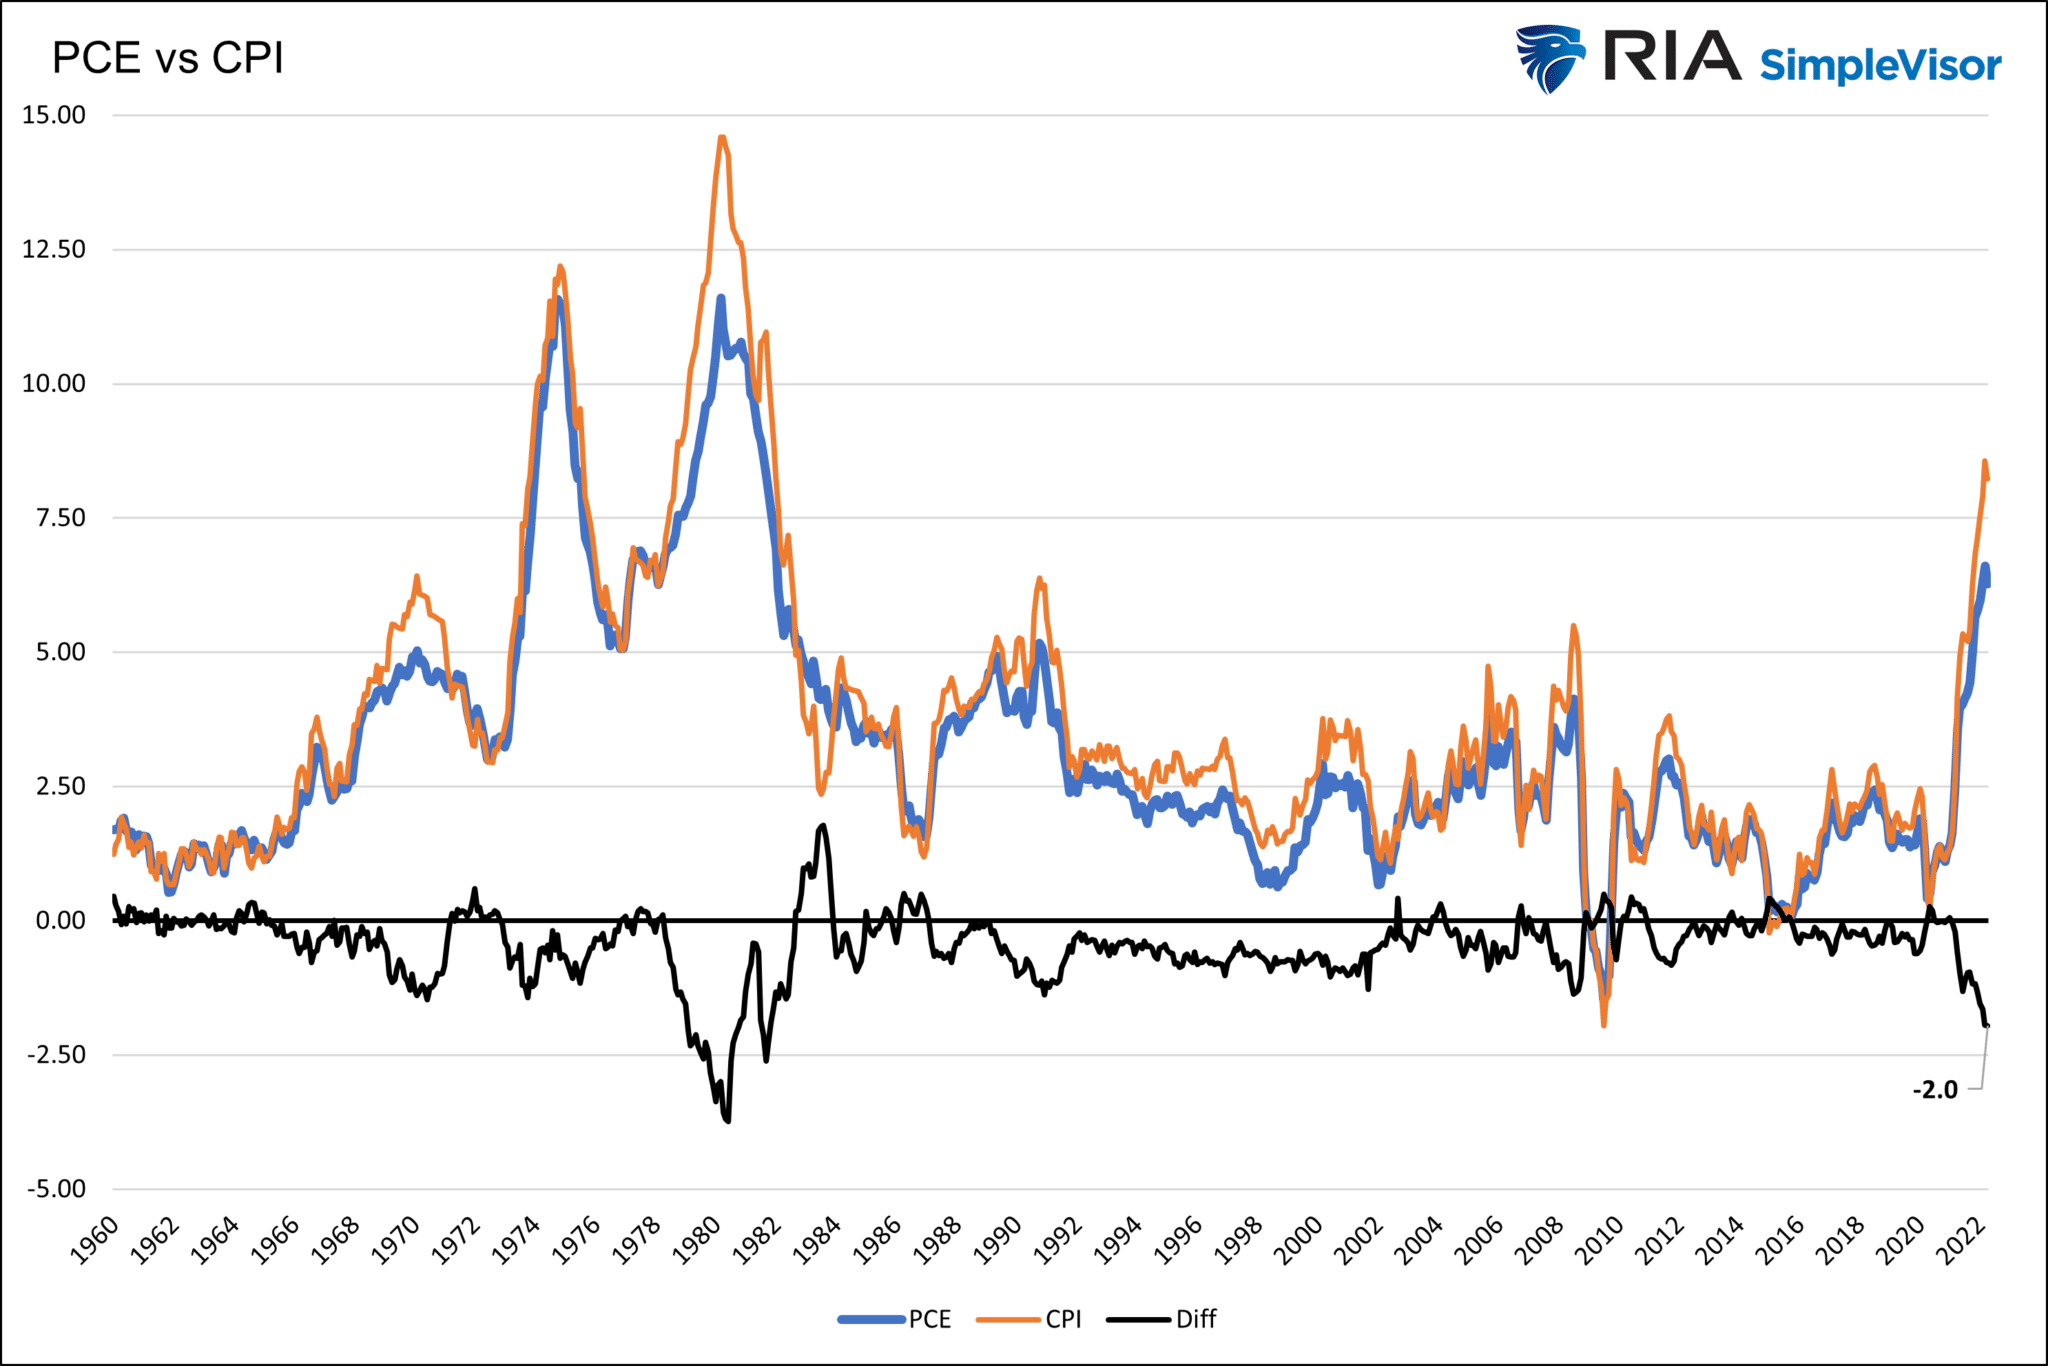
Like CPI, which was released two weeks ago, monthly PCE inflation was much lower than in March. The April PCE price index rose .2%, equating to a 2.4% annualized rate. That compares to +.9% (10.8%) in March. Year-over-year, PCE prices fell from 6.6% to 6.3%. While the markets tend to focus on CPI as its inflation indicator, the Fed prefers PCE. As the graph below shows, PCE and CPI correlate well.
However, CPI tends to overshoot at peaks. Currently, the annual CPI is 2% higher than PCE, as shown with the black line. The CPI/PCE gap is the largest difference between the two gauges since inflation ran in the double digits over 40 years ago. It’s too early to say if either index has peaked for the cycle, but the recent data provides hope.

What To Watch Today
Economy
- 9:00 a.m. ET: FHFA House Pricing Index, month-over-month, March (2.0% expected, 2.1% prior)
- 9:00 a.m. ET: House Price Purchasing Index, quarter-over-quarter, Q1 (3.3% prior)
- 9:00 a.m. ET: Case-Shiller 20-City Composite, month-over-month, March (1.90% expected, 2.39% prior)
- 9:00 a.m. ET: Case-Shiller 20-City Composite, year-over-year, March (19.85% expected, 20.20% prior)
- 9:00 a.m. ET: Case-Shiller U.S. National Home Price Index, year-over-year, March (19.80% prior)
- 9:45 a.m. ET: MNI Chicago PMI, May (55.5 expected, 56.4 prior)
- 10:00 a.m. ET: Conference Board Consumer Confidence, May (103.5 expected, 107.4 prior)
- 10:00 a.m. ET: Conference Board Present Situation, May (152.6 prior)
- 10:00 a.m. ET: Conference Board Expectations, May (77.2 prior)
- 10:30 a.m. ET: Dallas Federal Reserve Manufacturing Activity, May (1.5 expected, 1.1 prior)
Earnings
Pre-market
- Kirkland’s (KIRK) to report an adjusted loss of $0.33 on revenue of $105 million
Post-market
- HP (HPQ) to report adjusted earnings of $1.05 on revenue of $16.14 billion
- Salesforce.com (CRM) to report adjusted earnings of $0.95 on revenue of $7.38 billion
- Victoria’s Secret (VSCO)to report adjusted earnings of $0.84 on revenue of $1.48 billion
- Ambarella (AMBA) to report adjusted earnings of $0.37 on revenue of $90.02 million
Market Trading Update – Sell The Rally?
Over the last few weeks, we have been a bit of a broken record suggesting a counter-trend rally was likely. However, that rally remained very elusive. Finally, a rally took hold this week, as investors found reasons to be bullish pushing the market above the 20-dma and triggering a fairly strong “buy” signal.
As John Murphy noted on Friday:
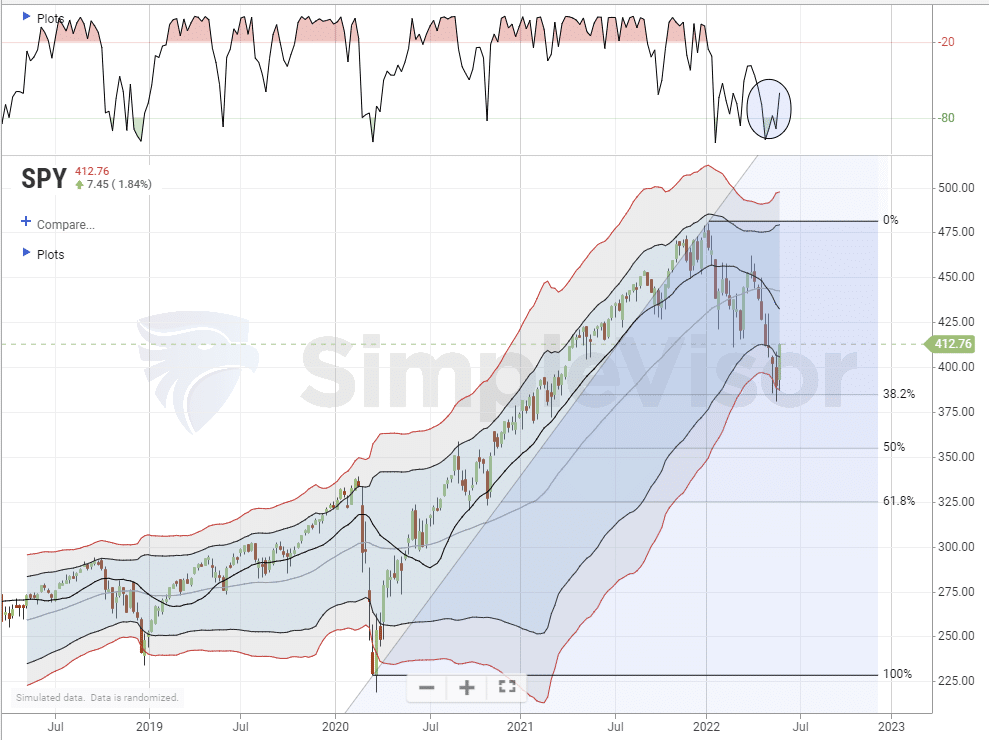
“Stocks are having their best week in two months which suggests that a short-term bottom may be in place. The weekly bars show the S&P 500 bouncing off its 38% Fibonacci retracement line measured from its 2020 bottom to this year’s top. That’s not usual because those retracement lines often provide some support. That’s especially true if the market has reached an oversold condition — which it has.”
Notably, as shown, the market was also 3-standard deviations below its 1-year moving average which further added support for a bounce.
As John continues:
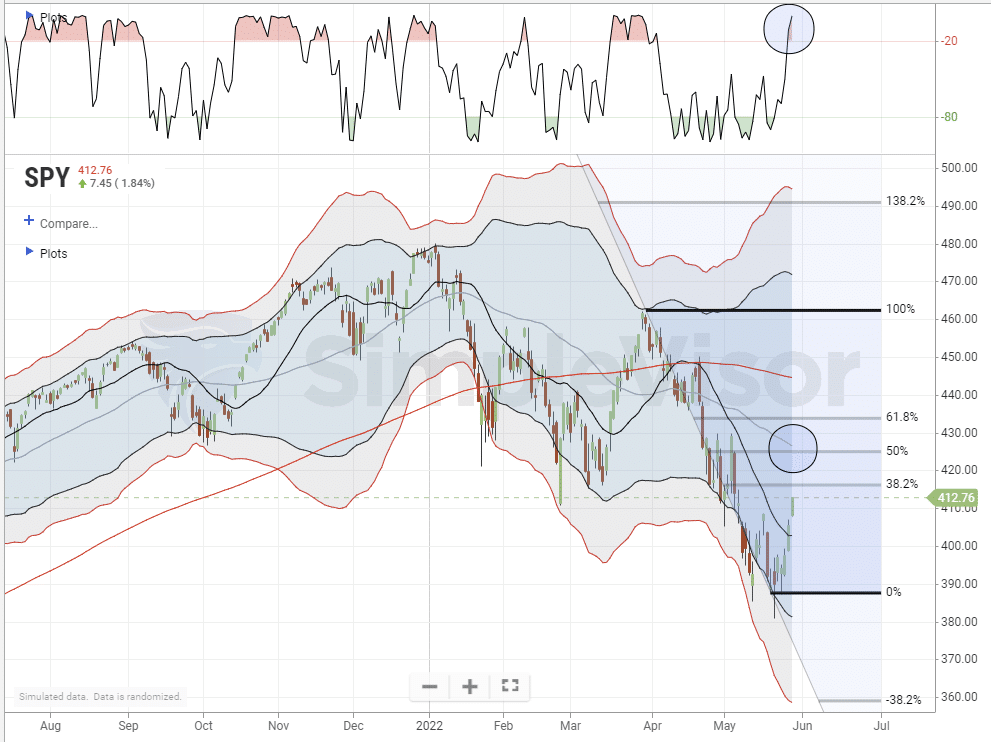
“The daily bars show the S&P 500 exceeding its mid-May peak to turn its short-term trend higher. Stocks, however, have a lot of overhead resistance barriers to deal with.
The grey horizontal lines measure Fibonacci retracement lines measured from their late March peak to their May bottom. Those three lines should now act as overhead resistance barriers. The SPX has already reached the lower line at 38%. More substantial resistance is likely at the two higher lines at 50% and 62%. Moving average lines should also act as overhead resistance. That’s especially true of the blue 50-day average which may be tested (blue circle).
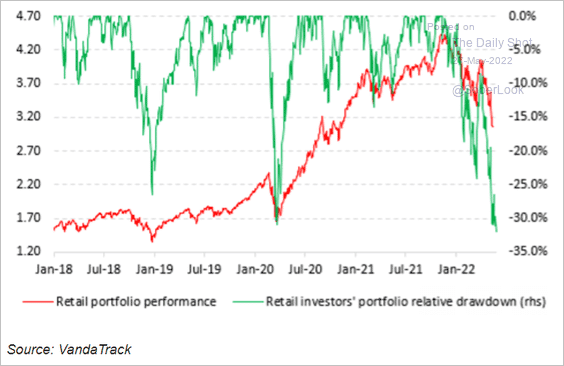
We agree with John’s analysis, which, at least for now suggests that rallies should be sold into, portfolios rebalanced, and cash levels raised. As we will discuss below, with the average investor down 30% this year, there are many “trapped longs” looking for an exit.
The Week Ahead
This week, our economic focus will be on the national ISM manufacturing index on Wednesday and the ADP and BLS employment reports.
As we have noted, many regional manufacturing indexes strongly correlate with economic activity. Given their results are near-realtime, the surveys are helpful in assessing current conditions. Many regional indexes have declined much more than expected in recent weeks. We wrote about three recent surveys in our article Snap Goes The Economic. To wit:
- The May New York Fed Empire State Manufacturing Survey fell sharply into economic contraction levels at -11.6. Last month the Empire index stood at +24.6.
- The Philadelphia Fed Manufacturing Index, like the Empire State Index, came in well short of expectations. The index is now 2.6, down from 17.6 and expectations of 16.5. As shown below, the index still signals manufacturing expansion, but just barely so. The index fell to its lowest level in two years.
- On May 24, 2022, the Richmond Fed Survey shrunk into contractionary economic territory at -9, versus a forecast of 10 and previous reading of 14.
The BLS employment report on Friday is expected to show a gain of 320k jobs, 100k fewer than last month, but it remains at almost twice the pre-pandemic rate.
Fed speakers will have their last chance to speak before the next Fed media blackout. The market will look for signs they may pause rate hikes after July. Without inflation dropping further or financial market instability, a Fed pivot seems unlikely.
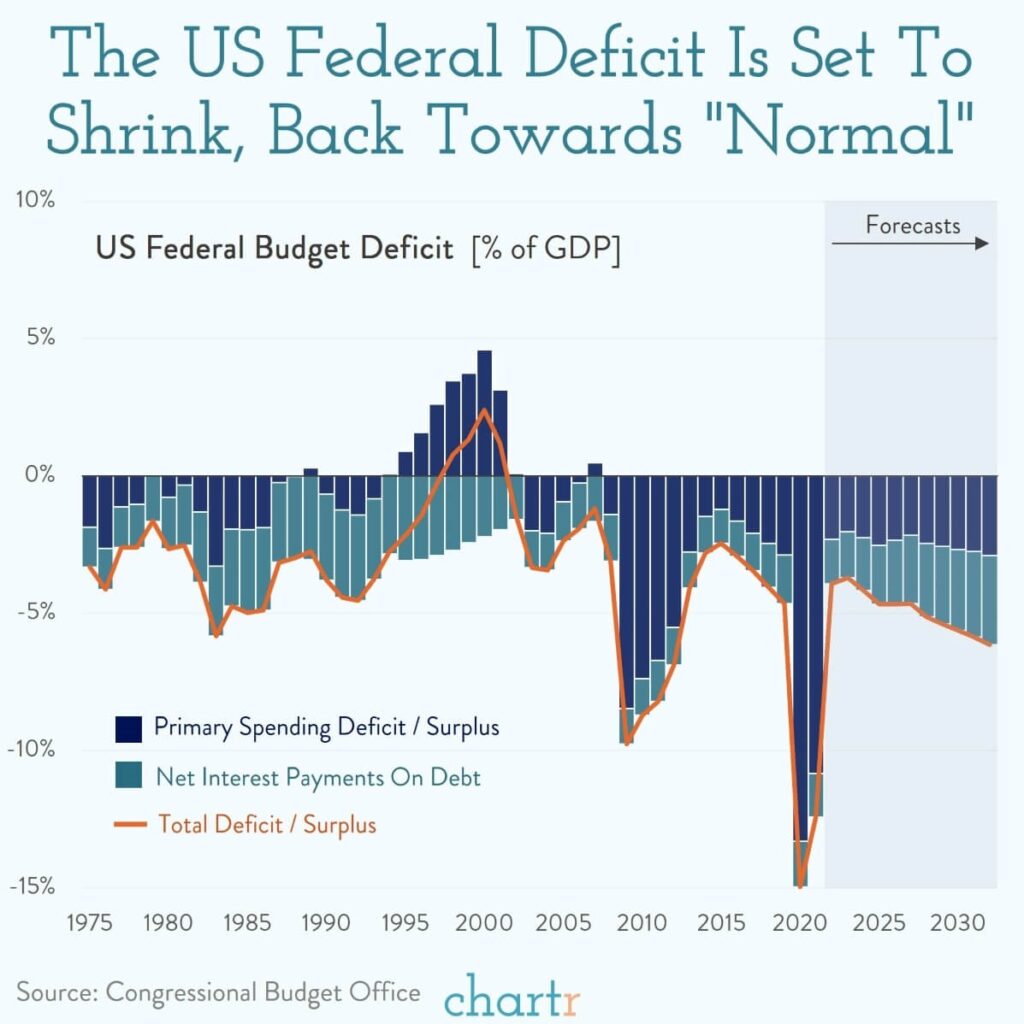
US Federal Deficit To Shrink Towards Normal – Still A Lot Though
“The US government is still “living beyond its means”, with the federal budget deficit expected to come in at $1 trillion for this year according to new forecasts from the CBO.
That’s a huge amount of money, but it is actually way down on the $3 trillion or so that the deficit has averaged over the last two years when government spending dramatically increased in response to the pandemic as multiple stimulus checks, tax credits, and other relief programs were introduced. As the chart above shows, those deficits were worth almost 13-15% of the entire value of the US economy.
Going forward the CBO forecasts that the US federal deficit is likely to steadily rise from around 4% of GDP this year to around 6% of GDP by 2032. Incredibly, less than half of that estimated deficit is actually from spending — the majority is actually just interest payments on the debt we already owe.” – Chartr
Not surprisingly that massive surge in liquidity is what fueled both the CPI and PCE measures of inflation.
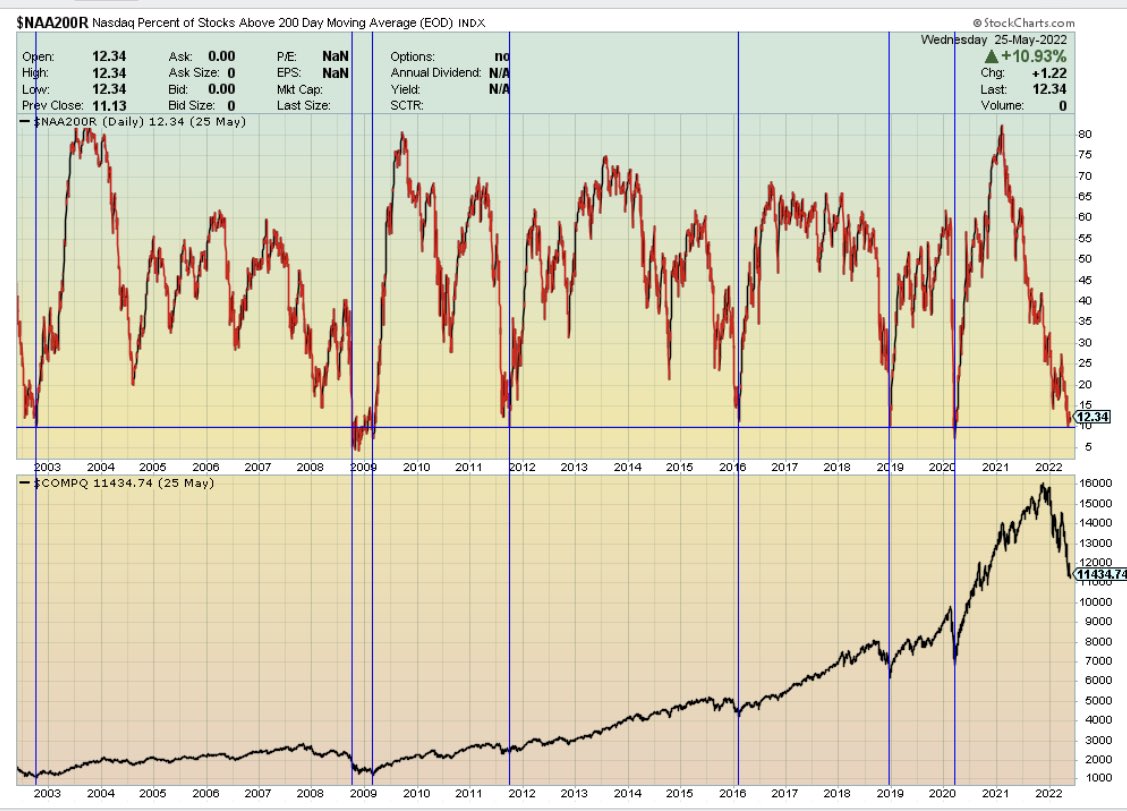
Bullish Signal From the NASDAQ
In the post-tech bubble era, when the percentage of Nasdaq stocks trading above their respective 200 dmas fell to current levels (12.3%) or less, the Nasdaq has been a buy. Unfortunately, the data only goes back to 2002. As such, we do not know if this current reading is a good buy signal. The indicator may have triggered false buy signals before the ultimate bottom in late 2002. It’s also worth noting that it pinpointed the market bottom about five months too early during the financial crisis.
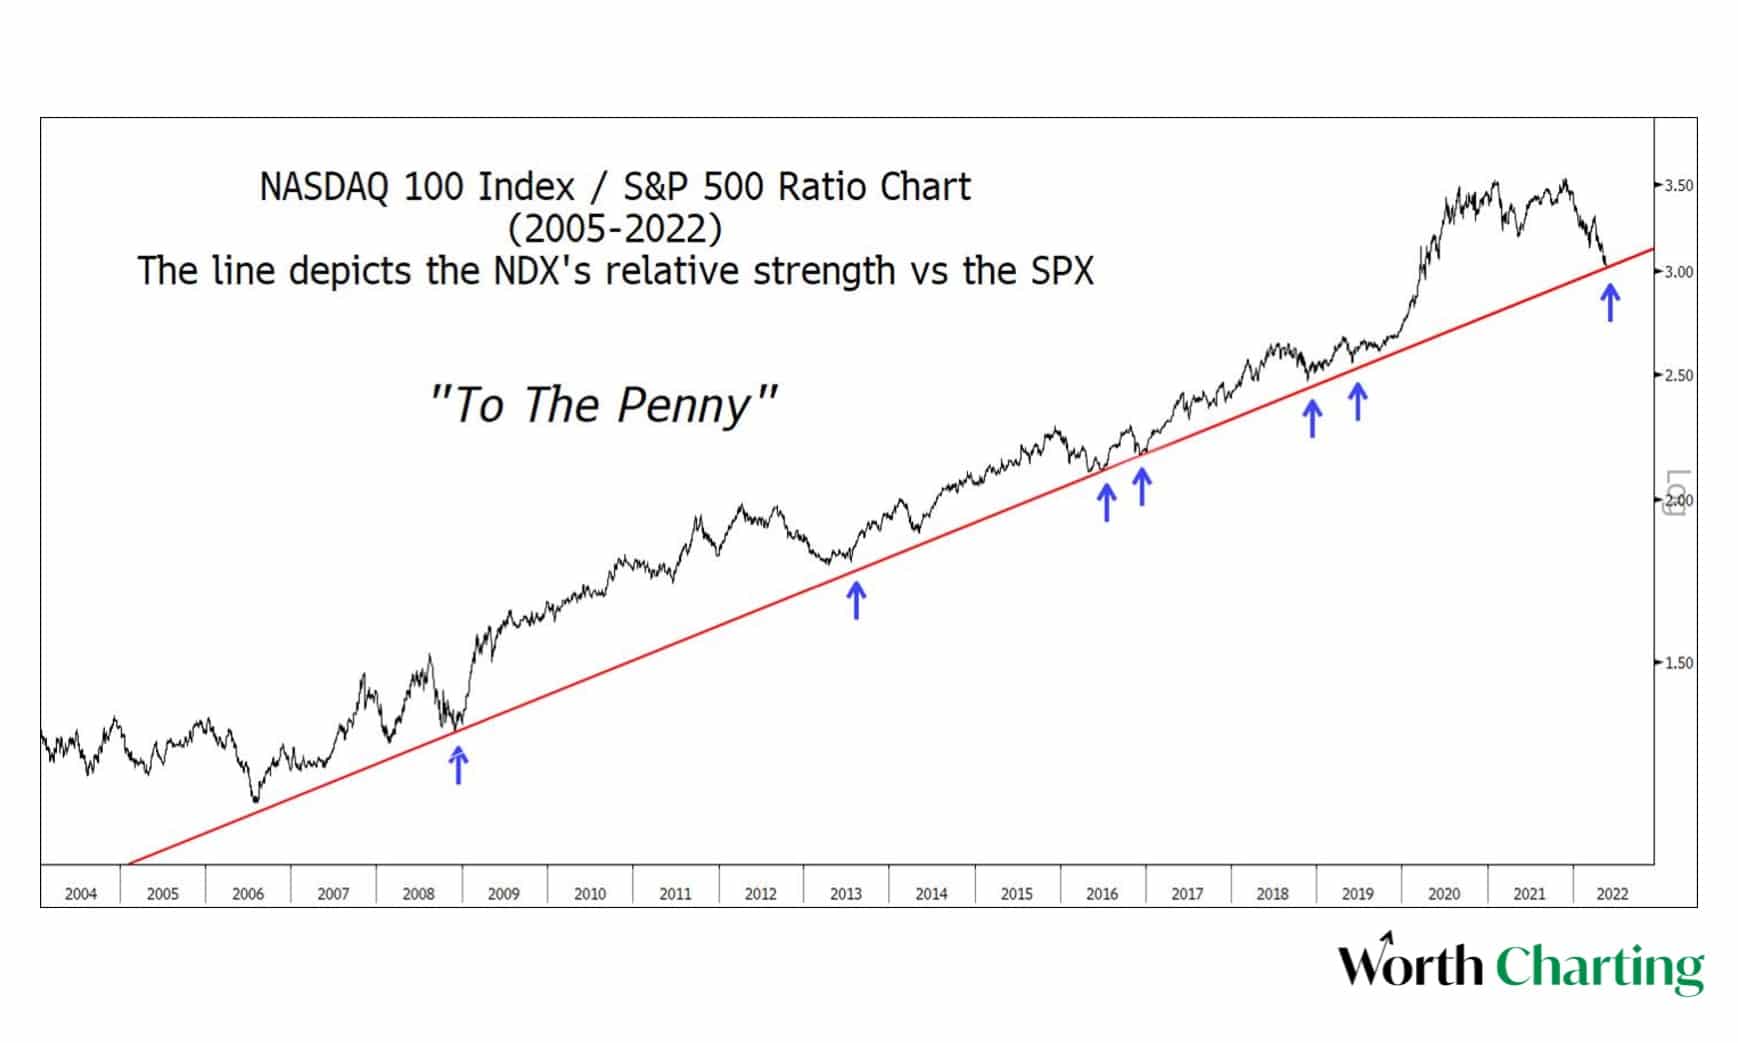
Market Support “to the Penny”
Carter Worth’s chart below compares the ratio of the Nasdaq 100 to the S&P 500. As he shows, the red line has proven to be reliable support over the last fifteen years, including the Financial Crisis. The author notes the ratio just hit the support line, “to the penny.” The underperformance of the Nasdaq and tech stocks, in general, has been glaring over the last few weeks. At support, it now appears as if the trend surge in the ratio from the pandemic has fully corrected. If so, the support line should provide support for the Nasdaq versus the broader market. A break of support will likely signal a deepening bear market.
Not shown on the graph below is the ratio during the tech bust of early 2000. From 1998 to 2000, the ratio rose exponentially from 1 to 3.5. The recent high in the ratio occurred a few months ago at a similar level as in 2000. The only difference is that the recent peak resulted from a gradual increase in the ratio over 15 years. The two year surge in the late ’90s was clearly indicative of a bubble.
Global Recession Coming Soon
We have been sharing the mounting evidence that a U.S. recession is possible this year. The graph below from Robin Brooks shows that the odds of a global recession are rising as export orders collapse. The lines represent the New Export Orders within each country’s PMI surveys. The world’s three largest exporters, China, Germany, and Japan, are witnessing new export orders fall rapidly, and in all three cases, the survey is below 50, signaling economic contraction. Export orders in the U.S. tend to be less volatile than in the countries shown below. They are elevated and remain in economic expansion, but they are starting to decline with the others.

Please subscribe to the daily commentary to receive these updates every morning before the opening bell.
If you found this blog useful, please send it to someone else, share it on social media, or contact us to set up a meeting.
Also Read


