


More signs of weakening economic growth coupled with rising Delta variant cases, oh and a 2% market decline, seems to be enough in the market’s infinite wisdom to call off the taper dogs. Judged by the market’s exuberant behavior heading into Jackson Hole, it is now believed by many investors Powell will pass on a September/October timeframe to begin tapering QE. Most equity markets are near or back to record highs and showing signs of strength again this morning. Sign up here to receive this daily commentary via email every morning.
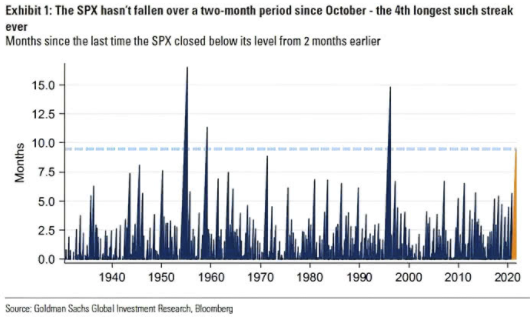
It’s The 4th Longest Stretch Ever
It’s been a really long time without a decent correction.
Technically Speaking – Pet Rocks & Other Signs Of A Rich Market
“Pet Rocks” first appeared in the mid-70s as a novelty item. Just recently, digital NFT’s of “pet rocks” sold for over $100,000. To wit:
“Rarely do they create waves for investing in something as dead as a rock. Well, they do now. A digital painting of a Grey-coloured rock, part of a pet project from 2017, has sold for an outrageously high price. Its non-fungible token (NFT) version was sold for ETH 33 — equivalent to $100,000 (roughly Rs 75 lakhs). These rocks are one of the first-ever NFT collectible projects on the Ethereum blockchain. Only 100 such “pet rocks” were created.”

What To Watch Today
Economy
- 10:00 a.m. ET: Richmond Fed Manufacturing Index, August (25 expected, 27 in July)
- 10:00 a.m. ET: New home sales, month-on-month, July (3.6% expected, -6.6% in June)
Earnings
Pre-market
- 6:30 a.m. ET: Advance Auto Parts (AAP) is expected to report adjusted earnings of $3.03 per share on revenue of $2.65 billion
- 7:00 a.m. ET: Best Buy (BBY) is expected to report adjusted earnings of $1.87 per share on revenue of $11.55 billion
Post-market
- 4:00 p.m. ET: Intuit (INTU) is expected to report adjusted earnings of $1.59 per share on revenue of $2.32 billion
Politics
- The U.S. House of Representatives convenes for a second day of debate on the $3.5 trillion budget blueprint and the bipartisan infrastructure deal. Monday wasn’t a smooth day for House Speaker Nancy Pelosi as she navigated a standoff between Democrats’ moderate and progressive wings.
- President Biden meets virtually with G7 leaders to discuss Afghanistan at 9:30 a.m. ET. The president will then deliver a speech on the ongoing evacuation efforts at noon ET.
- Kathy Hochul became the first female governor of New York at midnight. She replaces Andrew Cuomo, who resigned from the state’s top job over sexual harassment allegations.
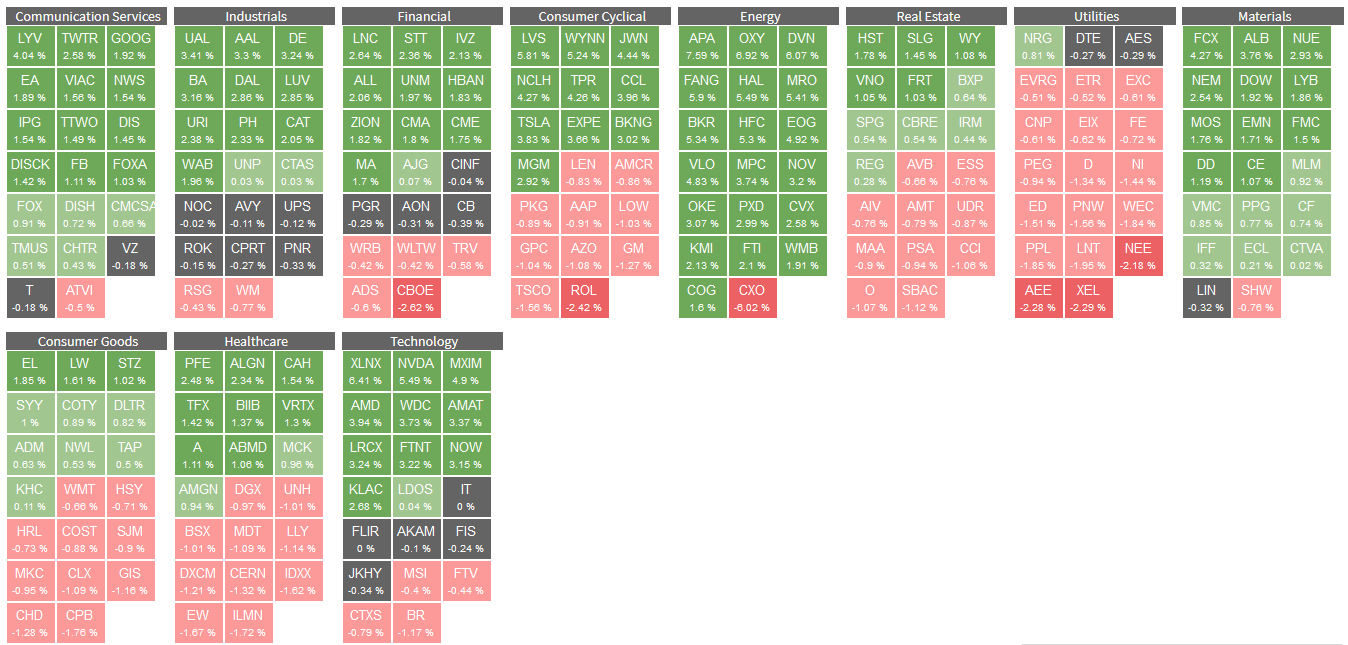
Heat Map
The heat map below, from the RIA Pro Dashboard, is a good way to monitor the breadth of the market. Despite the Nasdaq rising nearly 1.50% and the S&P .85%, the map shows there were a good number of stocks lower in the more conservative, lower beta sectors such as utilities, healthcare, consumer goods, real estate, and consumer cyclical sectors. Despite weakness in the aforementioned sectors bonds were flat on the day.
The August PMI Flash Composite Economic Survey fell to 55.4 from 59.9, an eight-month low. The bulk of the decline was attributable to the services industry. Many other nations and regions saw declines in their PMI reports. Australia was the most pronounced, falling from 56.9 to 51.7. The combination of weaker growth from China and Covid related lockdowns is weighing on their economy. Japan fell deeper into contraction (below 50) with a composite reading of 45.9 versus 48.8 in July. Europe held up well, only falling to 59.5 from 60.2.
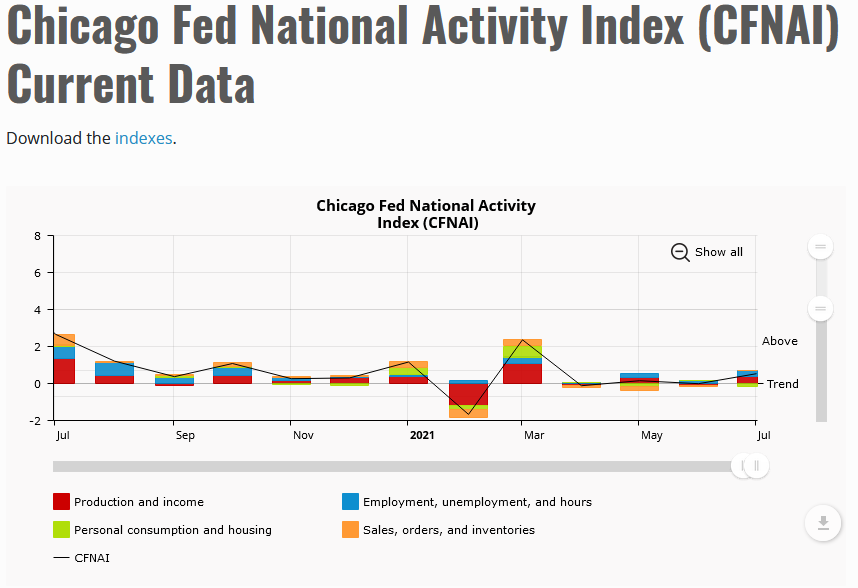
Unlike the PMI reading, the Chicago Fed’s National Activity Index rose to +.53 from +.09. As the graph below shows, it continues to oscillate around trend.
Investors Buy Market Dip

The big event this week is Chairman Powell’s speech at the Fed’s Jackson Hole conference on Friday at 10 am. Investors will be looking for any signs Powell is moving closer toward tapering in the coming months. It is possible he shares little, instead preferring to wait until the September 22 FOMC meeting. At that point, the Fed will have another round of employment and inflation data in hand.
On the economic calendar existing and new home sales will be released on Monday and Tuesday respectively. Durable Goods come out on Wednesday, followed by Personal Income and Spending on Friday. Also on Friday, the PCE price index for July will be released. PCE is the Fed’s preferred measure of inflation. In June PCE rose 0.5%. It is expected to rise 0.4% in July.
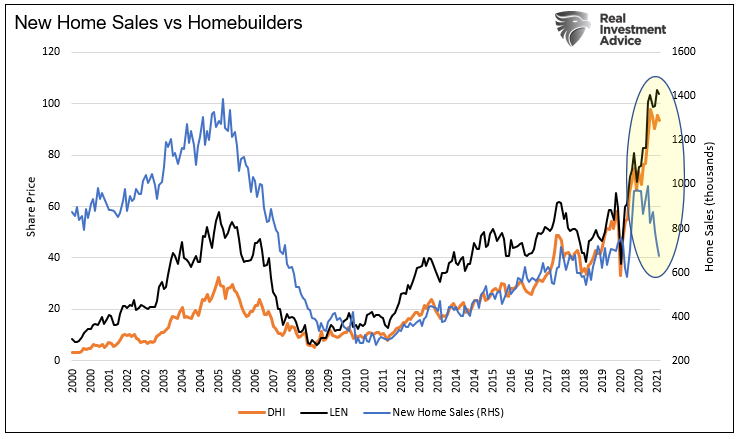
After rising rapidly in late 2020, new home sales are back to pre-pandemic levels as shown by the blue line in the graph below. Despite normalizing sales, shares of homebuilders D.R. Horton (DHI) and Lennar (LEN) are 61% and 59% respectively above pre-pandemic levels. This chart is just one of many examples where share prices are not reflective of underlying trends.
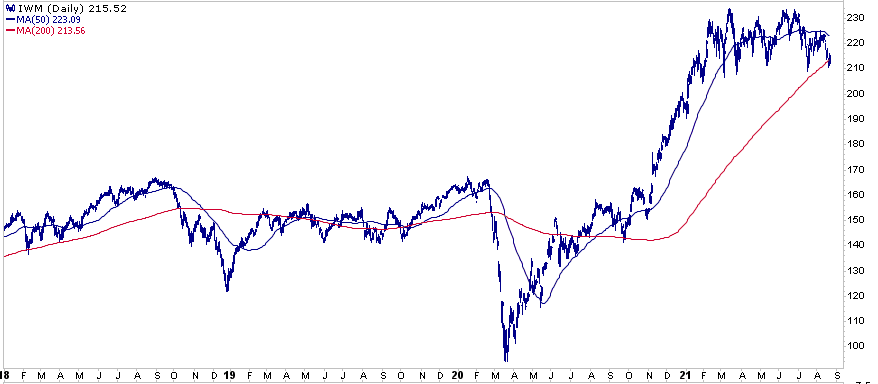
The graph below shows the small-cap- IWM (Russell 2000) index is now below its 200 dma for the first time since rising above it nearly a year ago. The S&P 500 is still 10% above its 200 dma, while the NASDAQ is nearly 15% above its. As we pointed out on numerous occasions, this is another warning that markets may be on the cusp of a down trade.
Also Read


