Market Stalls, Is The “Bear Market” Rally Over? – Full Report


- Market Stalls, Is The Bear Market Rally Over?
- MacroView: This Time Might Be Different
- Financial Planning Corner: Top Planning Questions Answered
- Sector & Market Analysis
- 401k Plan Manager
Follow Us On: Twitter, Facebook, Linked-In, Sound Cloud, Seeking Alpha
Catch Up On What You Missed Last Week

NOTE: During these tumultuous times, we are unlocking our full newsletter to help you navigate the markets safely. Make sure you subscribe to RIAPRO.NET (Free 30-Day Trial) if you want to keep receiving the full report after the storm passes.
Market Stalls, Is The Bear Market Rally Over?
Market rally stalls at resistance, is the “bear market rally over?”
That’s the question we have been discussing over the last few weeks. So far, most of it has played out exactly as expected by turning previous “selling panic” into a “buying rush,” and convincing a vast majority of investors the “bull market is back.”
I get it. The market has rallied 27% from its lows after falling by 35%. From sheer “panic” to unadulterated “exuberance” in four weeks. However, investors are still down 12% for the year.
The Revenant
As we discussed in “The Revenant,” this is what you should have expected:
“Bob Farrell, a legendary investor, is famous for his 10-Investment Rules to follow. Rule #8 states:
Bear markets have three stages – sharp down, reflexive rebound and a drawn-out fundamental downtrend
- Bear markets often START with a sharp and swift decline.
- After this decline, there is an oversold bounce that retraces a portion of that decline.
- The longer-term decline then continues, at a slower and more grinding pace, as the fundamentals deteriorate.
Dow Theory also suggests that bear markets consist of three down legs with reflexive rebounds in between.”

As would be expected, the “Phase 1” sell-off was brutal and set up the “reflexive bounce.”
“For many individuals, they will ‘feel like’ they are ‘safe.’ Such is how ‘bear market rallies’ lure investors back in just before they are mauled again in ‘Phase 3.’” – March 14th.
Note the date, which was well before the March 23rd lows.
A month later, and I am overwhelmed with emails telling me the “bull market is back.”
Maybe, it is.
But I tend to agree with Victor Adair of Polar Trading on this point:
“Massive monetary and fiscal stimulus in March and April will ‘counter’ the deflationary surge to some extent, but it’s not a one-for-one ‘offset.’ The deflationary impulse will continue and will be pervasive and enduring. While equity speculators have been BTD lately, the bond market, commodities, and FX have been skeptical.
I agree with folks who say that the Fed kept monetary policy way too easy for way too long. It encouraged way too much leverage everywhere. Now leverage is being punished, and the Fed is riding to the rescue. I guess that leverage keeps getting punished, and reduced, despite the Fed’s best efforts.
We’ve seen a bear market rally in the major stock indices since the March 23rd lows. However, the economic damage is underestimated at this point, and as it becomes more evident we will see a test of the lows.”
Short-Term Overbought
Regardless, in the short-term, the markets remain incredibly overbought and extended after the run from the lows. As noted last week:
“On a very short-term basis, the previous ‘deep oversold’ condition that provided the ‘fuel’ for the rally has been reversed. Also, all primary ‘overbought/sold’ indicators are now fully extended into overbought territory.”

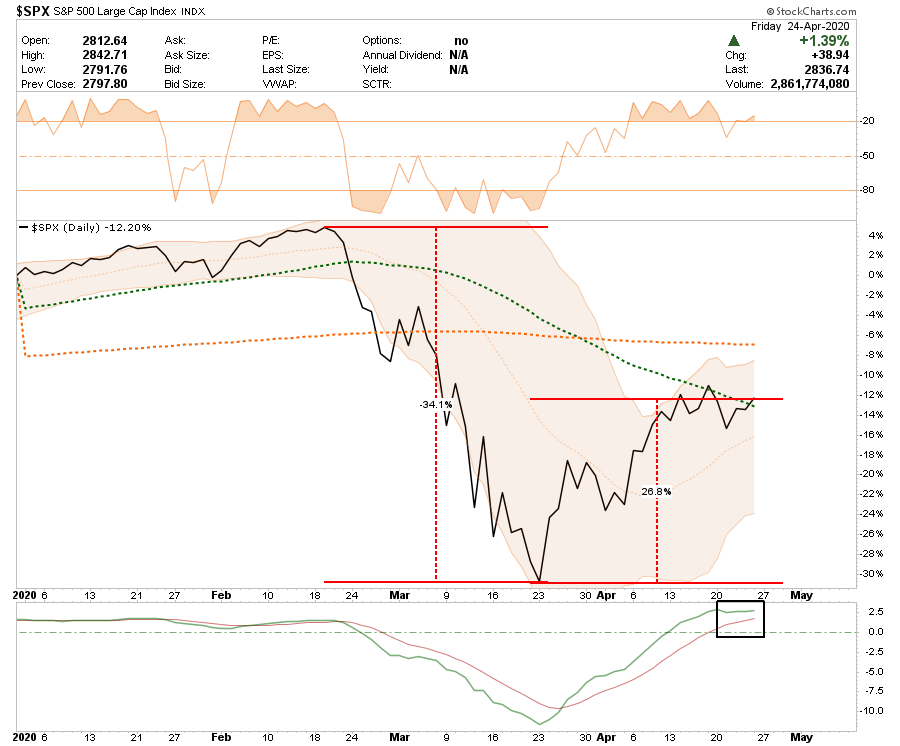
The rally has run into key downtrend resistance, and remains close to triggering a short-term “sell signal” from overbought levels.
If the markets can rally more on Monday and break above the downtrend, the 61.8% retracement level becomes a viable target. Above that resides the 200-day moving average. Both levels are going to provide formidable resistance to a move higher.
Such is particularly the case considering the avalanche of exceedingly negative data coming over the next several weeks from earnings to economics.

Speaking Of Earnings
On Tuesday, I did a deep dive into S&P earnings:
“More importantly, the chart below shows the comparison of the original and latest estimates for April. In our first analysis, earnings were to decline from Q4-2019 levels of $139.47 to $136.18 and $131.09, respectively, in Q1 and Q2 of 2020. That is a decline of -2.3% in Q1 and a total decline of -6% in Q2.
Those numbers are now revised for a decline of -4.4% in Q1, and a total decline of 10.2% in Q2.”
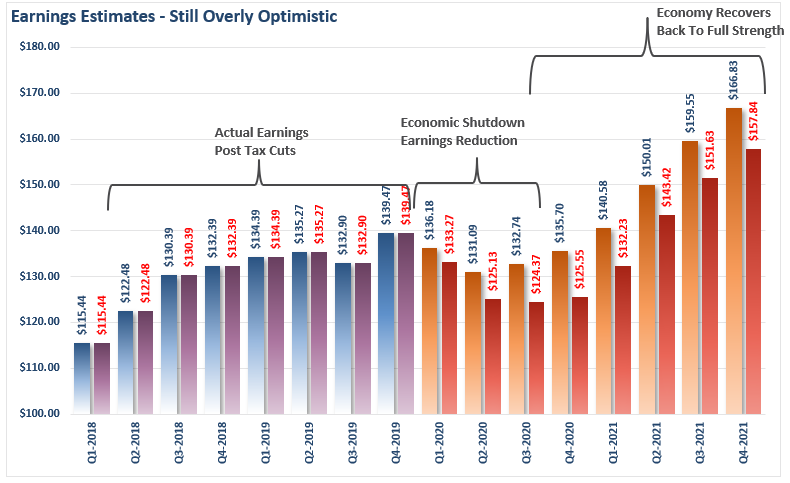
So, with the entire U.S. economy shut down, 15-20% unemployment, and -20% GDP, earnings are only expected to decline by 10%?
But if you are chasing the market currently, this is what you are “buying into.”

Ingredients For A Bull Market Still Missing
As I discussed with our RIAPro Subscribers (30-day Risk-Free Trial) last week, the ingredients for a bull market are still missing.
“Bear market rally: It’s a big bounce, indeed, but that is what it is. A rally in the context of a bear market that began on February 19th. The fact that we are coming off the best two weeks for the Dow (+15.2%) since 1938 (a huge recession within the Great Depression) just about tells you all you need to know.
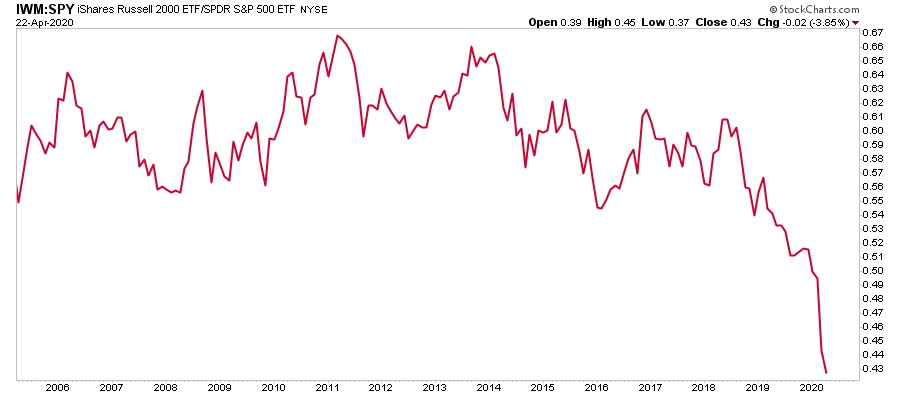
The market has certainly ‘ripped’ off the March lows, but there is still quite a bit of pain out there. The Russell 2000 index has only recouped one-third of its loss and is down 28% from the peak.” – David Rosenberg
The ratio of the Russell 2000 to the S&P 500 tells you all you need to know.
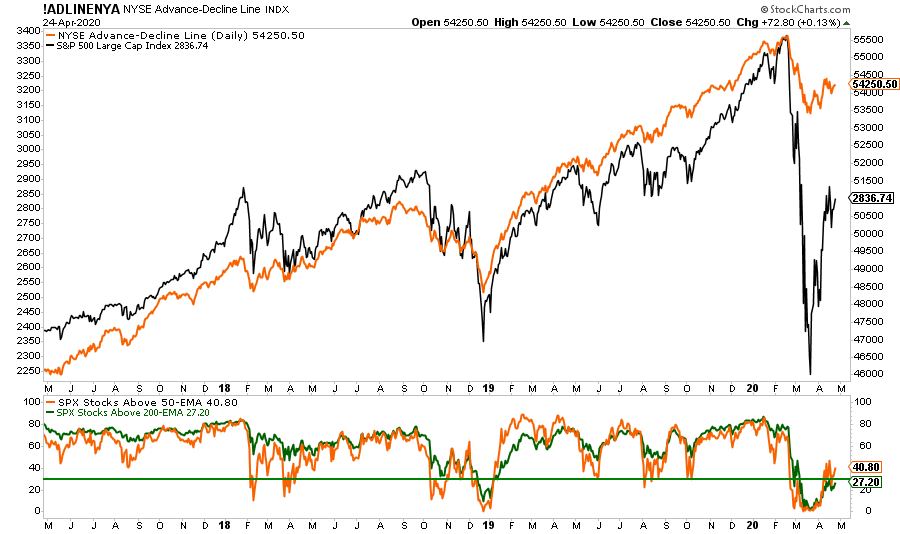
Also, the advance-decline line and the number of stocks trading below their 50- and 200-day moving averages are still incredibly weak.
As David concluded:
“The bear market is intact, even after the S&P 500 equal-weight index has staged a half-way comeback, it is down 21% from the February highs.
I recommend a read of the FT column titled Mind the Gap Between the Markets and the Real Economy. That’s the view from the stock market lens. A very bipolar market with several key segments still deeply injured. There is no durable rally you can count on without the banks participating, that much I do know. With small-caps being the true leading economic indicator, they remain entangled in a bear market; too many people are getting fooled by the mega-cap growth stocks (with a dominant 22% share of the market cap) carrying the S&P 500 on its shoulders.”

The Ranges Remain
What this all suggests is that “risk” still outweighs the potential “reward” of being aggressively invested in the markets currently.
It is worth remembering in January, and February, as the Fed was flooding the system with overnight liquidity via “repo operations,” we were recommending taking profits and reducing risks.
“When you sit down with your portfolio management team, and the first comment made is ‘this is nuts,’ it’s probably time to think about your overall portfolio risk. On Friday, that was how the investment committee both started and ended – ‘this is nuts.’ Such is why we took profits and reduced our risk.”
I remind you of this point as investors are chasing markets due to Fed liquidity, but as we saw in early March, the Fed’s “invisible hand” is not infallible.
The risk/reward ranges remain unchanged for the week as the market didn’t change much.
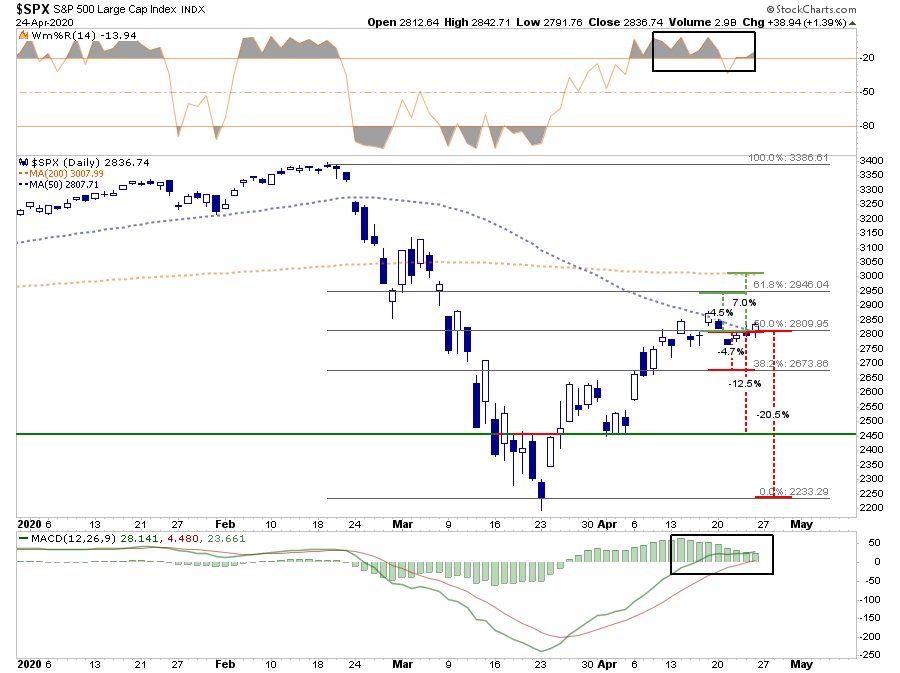
“Friday’s close brings the 61.8% retracement level AND the 200-dma into focus as the next resistance levels. The upside in the market remains limited to 4.5% to 7% currently. (This is certainly nothing to sneeze at, considering such would be regarded as a decent year’s worth of returns. That just shows how skewed things are currently.)
The downside risk ranges are a bit more disappointing.
- -4.7% to the previous 50% retracement level: risk/reward equally balanced.
- -12.5% to the previous higher low: risk/reward is mildly out of favor.
- -20.5% to the March 23rd low: risk/reward extremely out of favor.
From an optimistic view, a reopening of the economy, a virus vaccine, and an immediate return to low single-digit unemployment rates would greatly expand the bullish ranges for the market.
However, even a cursory review of the data suggests a more “realistic” view. The economic damage is going to be with us for a while. Until earnings estimates are revised substantially lower to reflect the ‘actual economy,’ I have to presume the relevant risks outweigh the current reward.”
We continue to remain long our reduced equity exposure and have been buying undervalued opportunities over the last few weeks. However, we are also balancing that equity exposure with offsetting hedges and a larger than average level of cash. We also have been increasing our duration in our bond portfolios as well as interest rates will continue to head toward ZERO this summer.
Just remember, when the market does bottom, there will be no one wanting to “buy.”
We aren’t there yet.

The MacroView
If you need help or have questions, we are always glad to help. Just email me.
See You Next Week
By Lance Roberts, CIO
Financial Planning Corner
12 Steps to a Financially Savvy & Secure Retirement
If you missed RIA’s most comprehensive retirement preparation webinar for pre & new retirees last week, we have got you covered. Topics include Social Security, Medicare, tax-friendly retirement income, and senior housing strategies.

Just CLICK THE LINK to register and watch “On Demand.”
If you have any questions afterward, don’t hesitate to email me.
by Danny Ratliff, CFP®
Market & Sector Analysis
Data Analysis Of The Market & Sectors For Traders
S&P 500 Tear Sheet
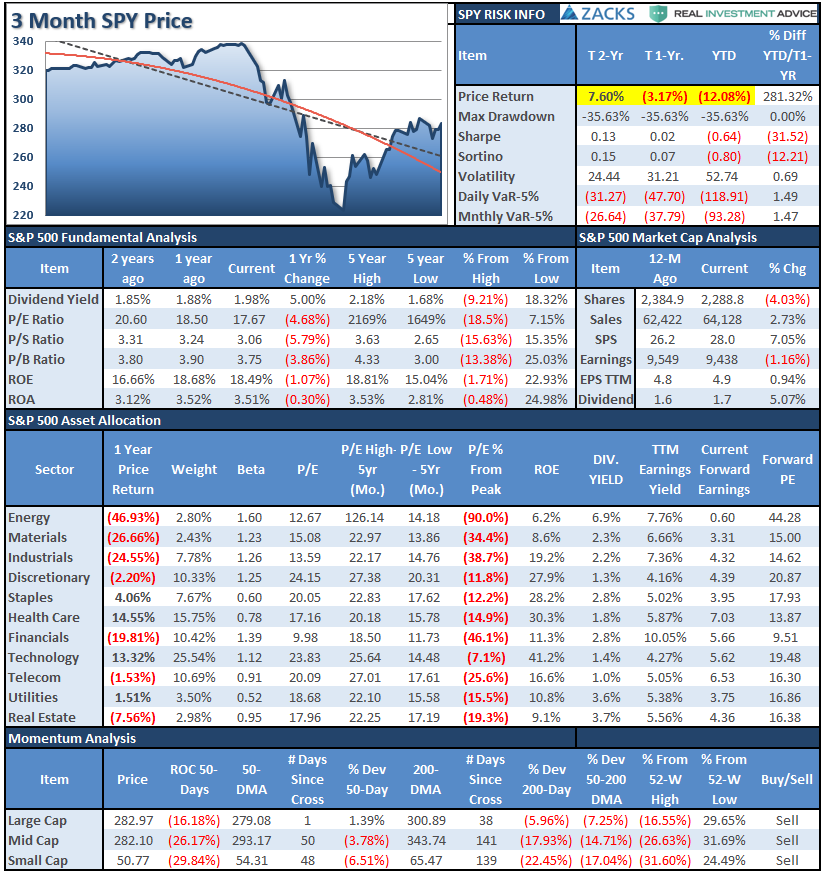
Performance Analysis

NOTE: I have rarely seen EVERY SECTOR overbought this much all at the same time. The market WILL CORRECT from these levels.
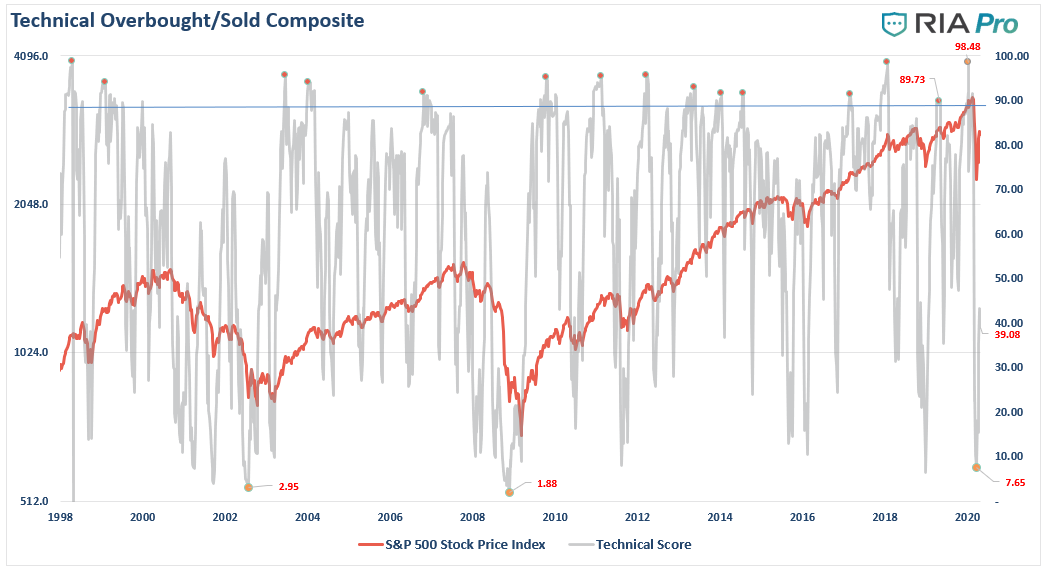
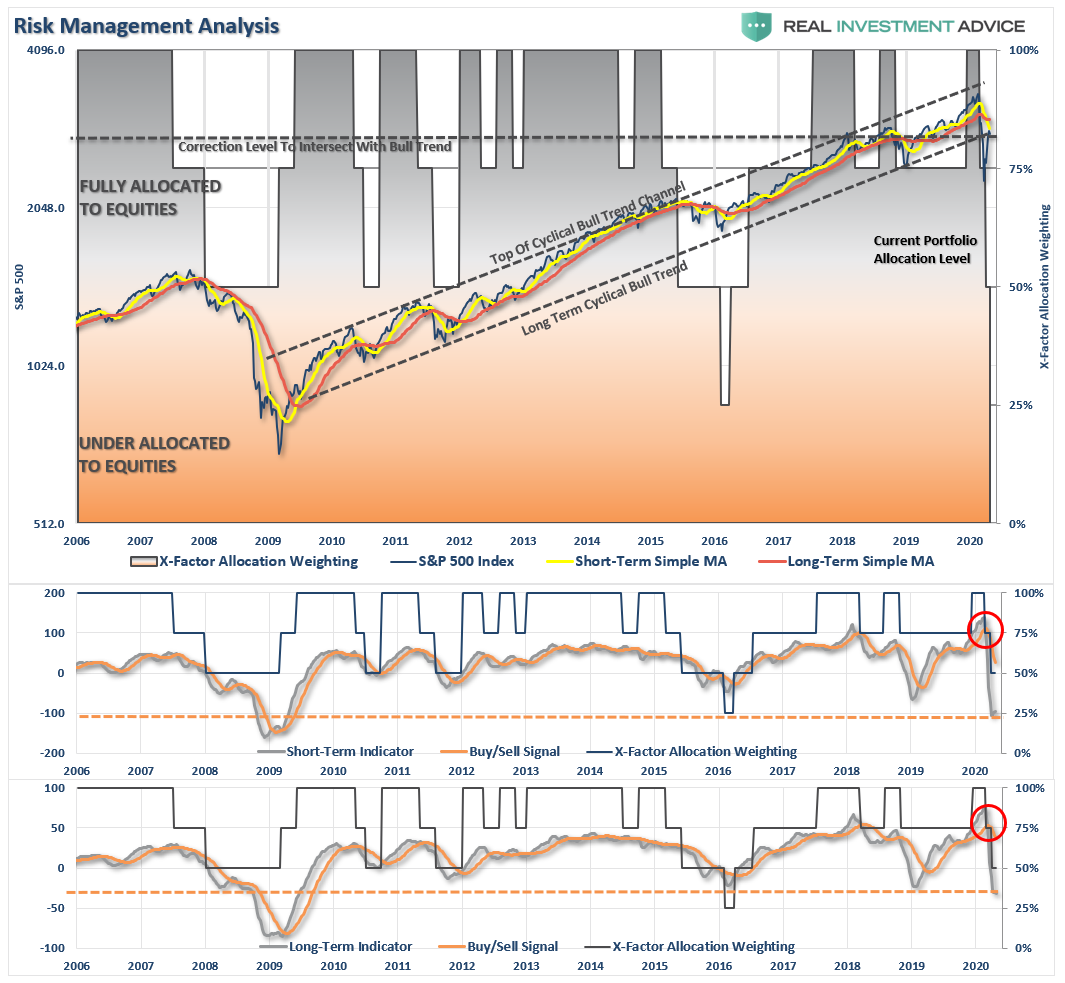
Technical Composite
Note: The technical gauge bounced from the lowest level since both the “Dot.com” and “Financial Crisis.” However, note the gauge bottoms BEFORE the market bottoms. In 2002, the market retested lows. In 2008, there was an additional 22% decline in early 2009.
ETF Model Relative Performance Analysis
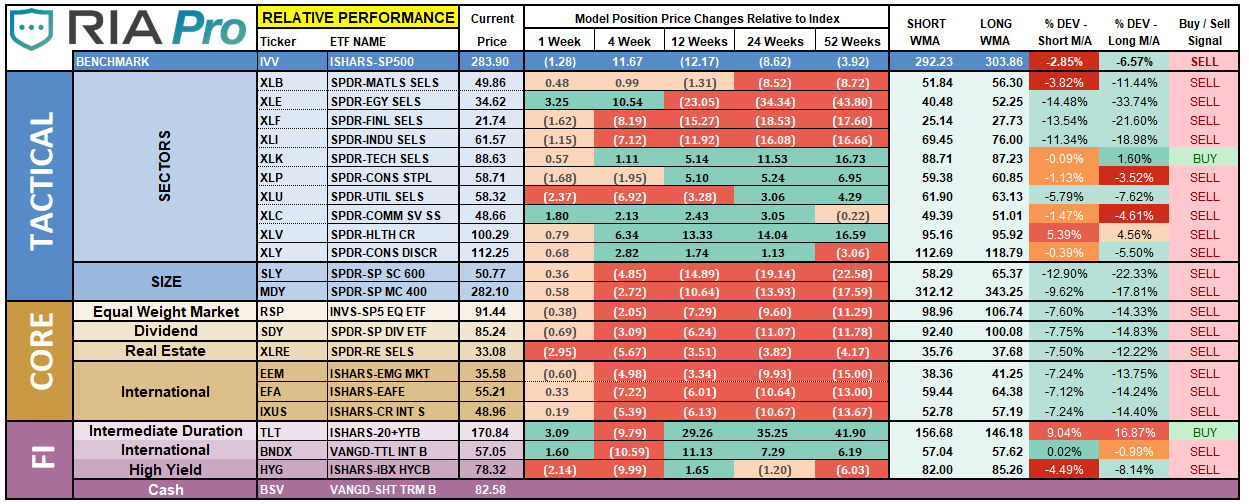
Sector & Market Analysis:
Be sure and catch our updates on Major Markets (Monday) and Major Sectors (Tuesday) with updated buy/stop/sell levels
Sector-by-Sector
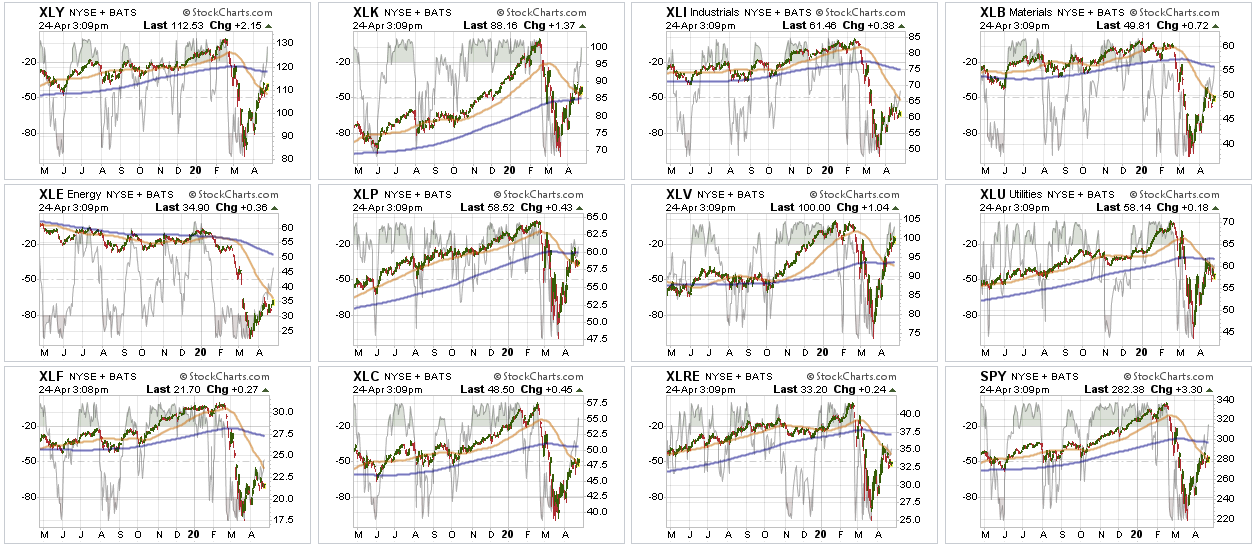
Improving – Discretionary (XLY), and Materials (XLB)
As noted last week, there is no rush to get into either Discretionary or Materials stocks until AFTER we get through earnings season. The economic shutdown is going to devastate the discretionary sector, focus on Staples for the time being. Early indications for earnings in the sector are terrible. These sectors are still lagging our primary holdings.
Current Positions: No Positions
Outperforming – Technology (XLK), Communications (XLC), Staples (XLP), Healthcare (XLV), Utilities (XLU), and Real Estate (XLRE)
A month ago, we shifted exposures in portfolios and added to our Technology and Communications sectors, bringing them up to weight. We remain long sectors that are currently outperforming the S&P 500 on a relative basis and have less “virus” exposure and added Utilities and Staples positions.
Everything is getting very overbought and extended in these sectors; we need a corrective pullback to add more to our holdings.
Current Positions: XLK, XLC, XLP, XLV, XLU
Weakening – None
No sectors in this quadrant.
Current Position: None
Lagging – Industrials (XLI), Financials (XLF), and Energy (XLE)
Financials continue to underperform the market. You can NOT have a lasting bull market rally without financials participating. As we have said previously, this sector, in particular, is THE most sensitive to Fed actions (XLF) and the shutdown of the economy (XLI).
We did start nibbling on exposure in the Energy sector this past week by adding some minimal positions which have been outperforming relative to the price of oil. It is WAY too early to be overly aggressive in the sector.
Current Position: 1/3rd Position XLE
Market By Market
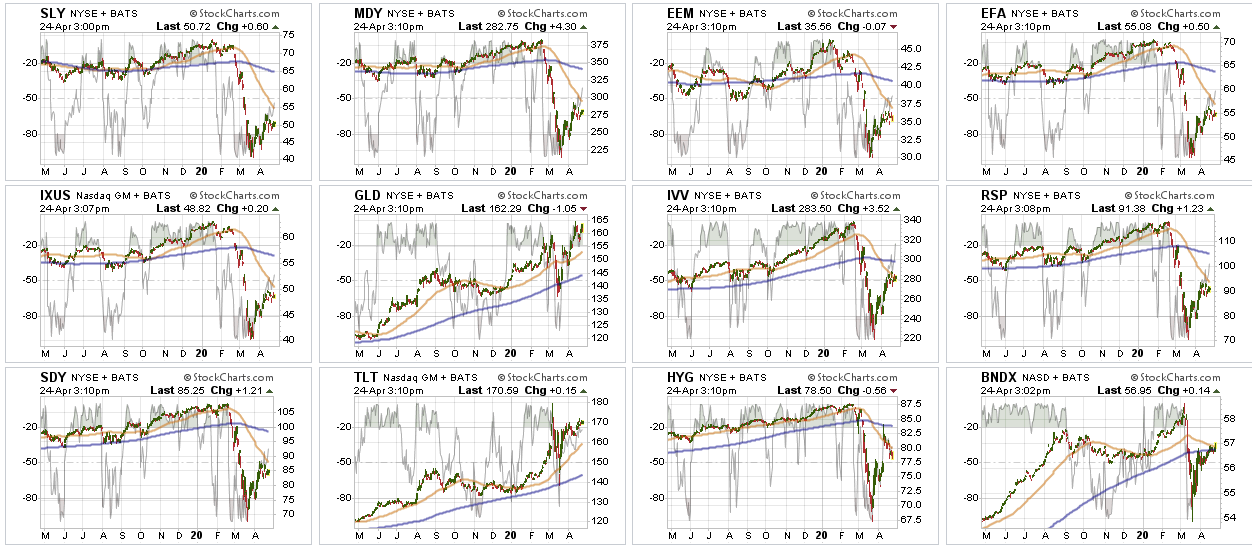
Small-Cap (SLY) and Mid Cap (MDY) – We sold all small-cap and mid-cap exposure earlier this year over concerns of the impact of the coronavirus. We remain out of these sectors for now, and there is no rush to add them anytime soon. Be patient, small, and mid-caps are lagging badly. You can not have a “bull market” without “small and mid-cap” stocks participating. Such is currently the case and suggests the current rally remains a “bear market” rally.
Current Position: None
Emerging, International (EEM) & Total International Markets (EFA)
Same as Small-cap and Mid-cap. Given the spread of the virus and the impact on the global supply chain.
Current Position: None
S&P 500 Index (Core Holding) – Given the overall uncertainty of the broad market, we previously closed out our long-term core holdings. We will re-add a core once we see a bottom in the market has formed.
Current Position: None
Gold (GLD) – We previously added additional exposure to both our GDX and IAU positions and are comfortable with our exposure currently. With the Fed going crazy with liquidity, this will be good for gold long-term, so we continue to add to our holdings on corrections.
We also added a position in the Dollar last week (UUP) as the U.S. dollar shortage continues to rage and is larger than the Fed can offset.
Current Position: 1/2 weight GDX, 2/3rd weight IAU, 1/2 weight UUP
Bonds (TLT) –
Bonds have rallied as the Fed has become THE “buyer” of bonds on both a “first” and “last” resort. Simply, “bonds will not be allowed to default,” as the Fed will guarantee payments to creditors. As we have been increasing our “equity” exposure in portfolios over the last few weeks, we added a position in TLT on Friday to increase our “risk” hedge in portfolios currently.
Current Positions: SHY, IEF, BIL, TLT
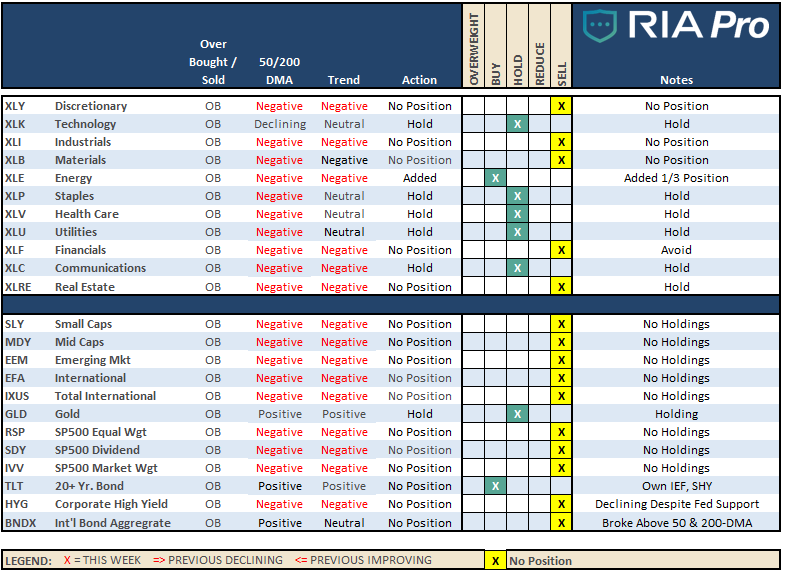
Sector / Market Recommendations
The table below shows thoughts on specific actions related to the current market environment.
(These are not recommendations or solicitations to take any action. Such is for informational purposes only related to market extremes and contrarian positioning within portfolios. Use at your own risk and peril.)
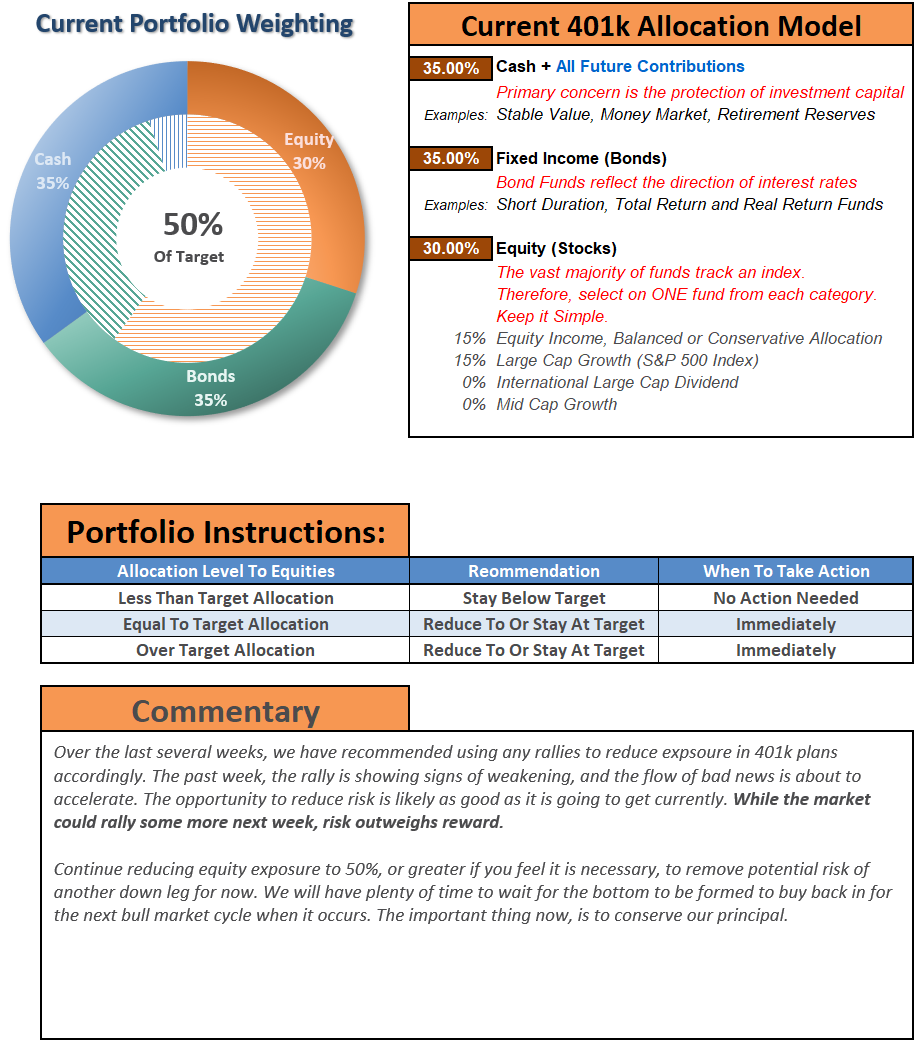
Portfolio / Client Update
We continue to look for opportunities where we can add exposure while still controlling overall risk. I encourage you to read last week’s missive in full if you are “getting all bullish” on the market, and think you want more exposure to equity risk.
This past week, the market struggled at the 50% retracement level but is holding the 50-dma (which is bullish short-term.) As discussed last week, there is indeed some short-term upside, but as we head into the summer months, the relative risk/reward ratio is not in our favor.
Furthermore, earnings and economic data have been horrific. While the markets do not seem to care at the moment, in hopes that there will be a rapid “V-shaped” recovery in the market, this data will eventually matter. It is not a question of “if” just a matter of “when.”
While investors are scrambling to chase markets currently, they are buying stocks with absolutely no visibility into earnings or outlooks. This type of investing tends to turn out badly. It is also important to note that participation is incredibly weak, and volume remains very low. These aren’t signs of recovering bull market.
We did add some exposure.
On Thursday, we added some small energy exposures to portfolios. (XOM, CVX in the Equity Model and XLE in the ETF model.) As we noted at the time:
“We added positions in Exxon (XOM), Chevron (CVX), and the SPDR Energy ETF (XLE) to our portfolios. We believed the companies offered significant value before the crisis and offer even more today despite the sell-off in oil.
Based on our discounted cash flow model for XOM and CVX, we think that both stocks are about 25% undervalued. The model assumes very conservative earnings projections for the next three years and a low earnings growth rate after that.
In addition to trading at a good discount, we think their strong balance sheets put these companies in a prime position to purchase sharply discounted energy assets in the months ahead. These stocks and the sector will be volatile for a while, but we intend to add to these positions in the future and potentially hold them for a long time.”
On Friday, we added a position of TLT (20-year Treasury Bond ETF) to portfolios.
“As we continue to add some equity exposure in areas that we like or are undervalued, we are hedging that risk accordingly.
Previously, we reduced our bond portfolio to align with our reduced equity exposure, however, over the last few of weeks, we have been adding positions in CLX, MRK, CAG, XLE, XOM, and CVX, along with increasing exposures in our Staples (XLP), Healthcare (XLV) and Communications (XLC).
Today, we are increasing our bond exposure a “smidge” to compensate for the risk of increased equity exposure by adding a 5% weight of TLT (iShares 20-Year Treasury Bond) to portfolios. Such will increase our “duration,” so if the market declines, the pickup in yield will hedge equity risk to some degree.”
Our process is still to participate in markets while preserving capital through risk management strategies.
We will continue to trade opportunistically, but as noted last week, ultimately we WILL MISS the bottom. We are going to wait to see “the bottom” has been put in; then, we will aggressively add exposure. At such a point, risk and reward will be clearly in our favor.
We continue to remain very defensive and are in an excellent position with plenty of cash, reduced bond holdings, and minimal equity exposure in companies we want to own for the next 10-years. Just remain patient with us as we await the right opportunity to build holdings with both stable values, and higher yields.
Please don’t hesitate to contact us if you have any questions or concerns.
Lance Roberts
CIO
THE REAL 401k PLAN MANAGER
A Conservative Strategy For Long-Term Investors
If you need help after reading the alert; do not hesitate to contact me
Model performance is a two-asset model of stocks and bonds relative to the weighting changes made each week in the newsletter. Such is strictly for informational and educational purposes only and should not be relied on for any reason. Past performance is not a guarantee of future results. Use at your own risk and peril.

401k Plan Manager Live Model
As an RIA PRO subscriber (You get your first 30-days free) you have access to our live 401k plan manager.
Compare your current 401k allocation, to our recommendation for your company specific plan as well as our on 401k model allocation.
You can also track performance, estimate future values based your savings and expected returns, and dig down into your sector and market allocations.
If you would like to offer our service to your employees at a deeply discounted corporate rate, please contact me.


