


HOW TO READ THE MAJOR MARKET BUY-SELL REVIEW 10-12-20
There are three primary components to each Major Market Buy/Sell chart in this RIAPro review:
- The price chart is in orange
- The Over Bought/Over Sold indicator is in gray
- The Buy / Sell indicator is in blue.
When the gray indicator is at the TOP of the chart, there is typically more risk and less reward available at the current time. In other words, the best time to BUY is when the short-term condition is over-sold. Likewise, when the buy/sell indicator is above the ZERO line, investments tend to work better.
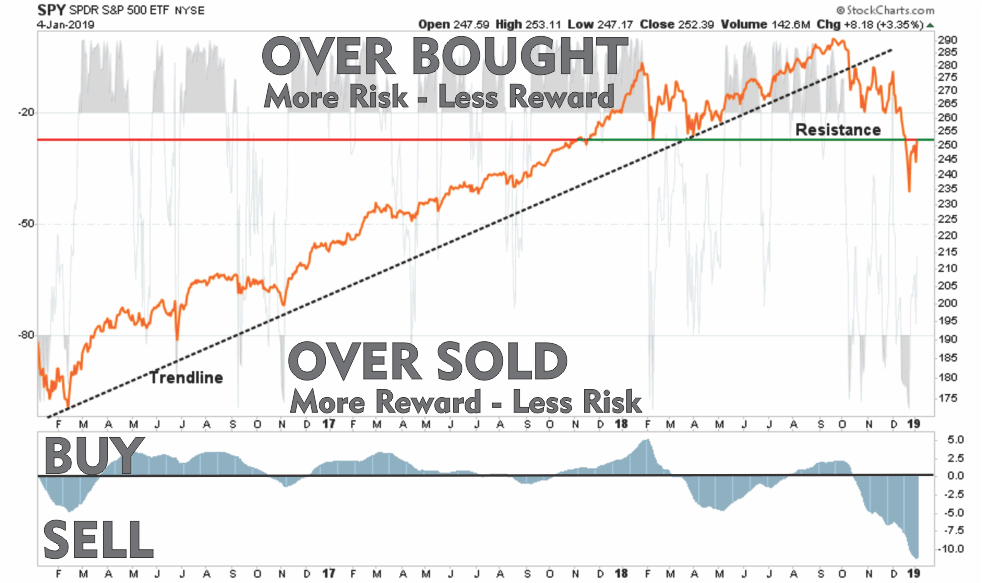
With this basic tutorial, let’s review the major markets.
Major Market Buy/Sell Review 10-12-20
S&P 500 Index
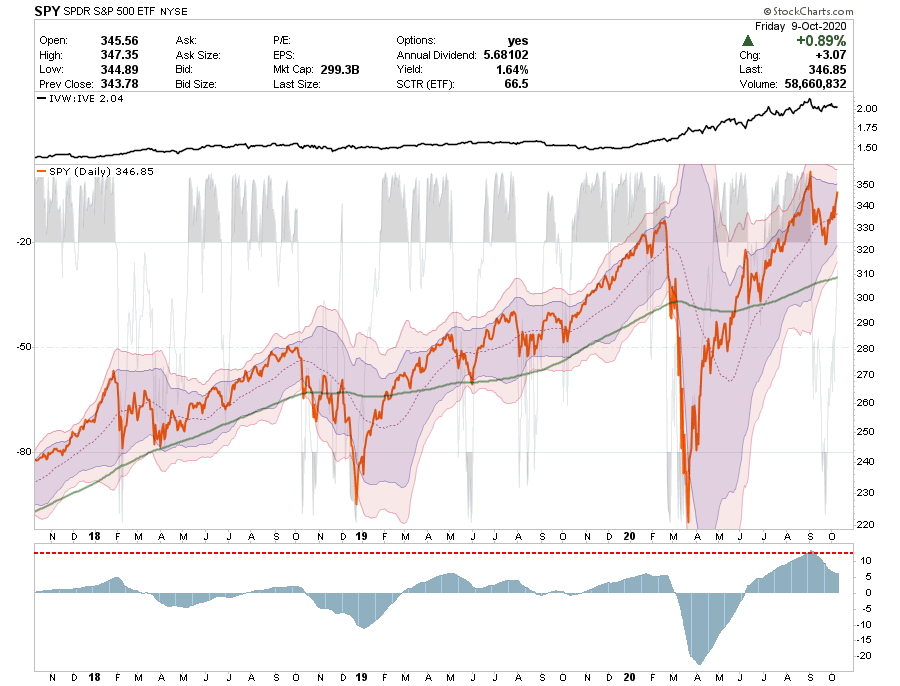
- The oversold condition that existed last week has now been reversed. While some extreme extensions have been reduced, the market is likely to run into some decent resistance at the previous highs.
- As noted previously, the break back above the 50-dma provided the bulls some support to take on additional equity risk. There is currently about 3% to all-time highs, so remain long for now.
- Short-Term Positioning: Bullish
- Last Week: No holdings.
- This Week: Removed short-hedge last Monday at the open.
- Stop-loss set at $310 for trading positions.
- Long-Term Positioning: Bullish
Dow Jones Industrial Average
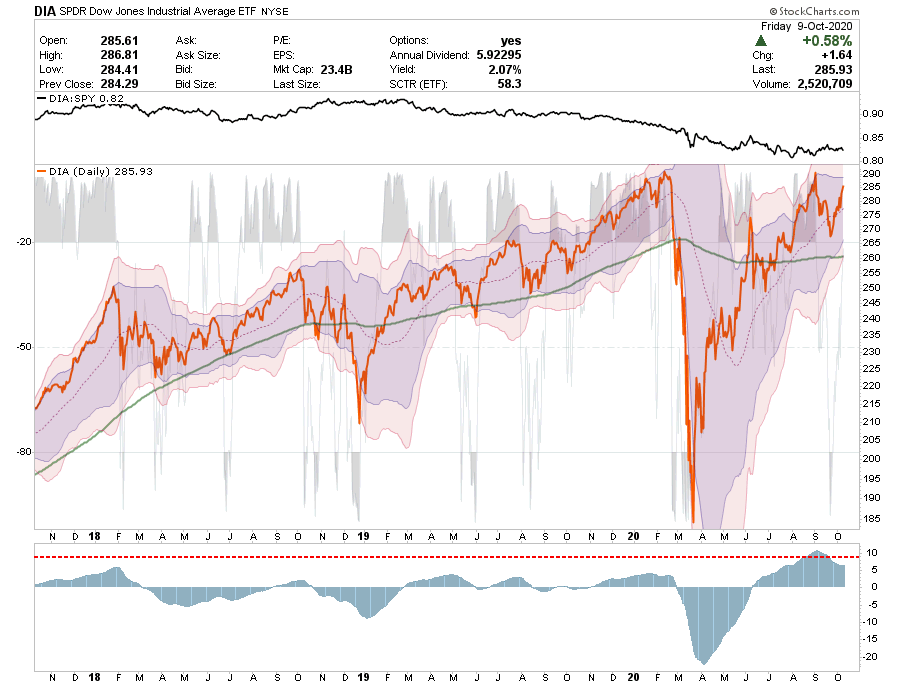
- The tradeable rally in the Dow we suggested previously has worked well.
- Maintain long positions for now, but take some profits near all-time highs.
- Short-Term Positioning: Bullish
- Last Week: No position.
- This Week: No position.
- Stop-loss moved up to $260
- Long-Term Positioning: Bullish
Nasdaq Composite
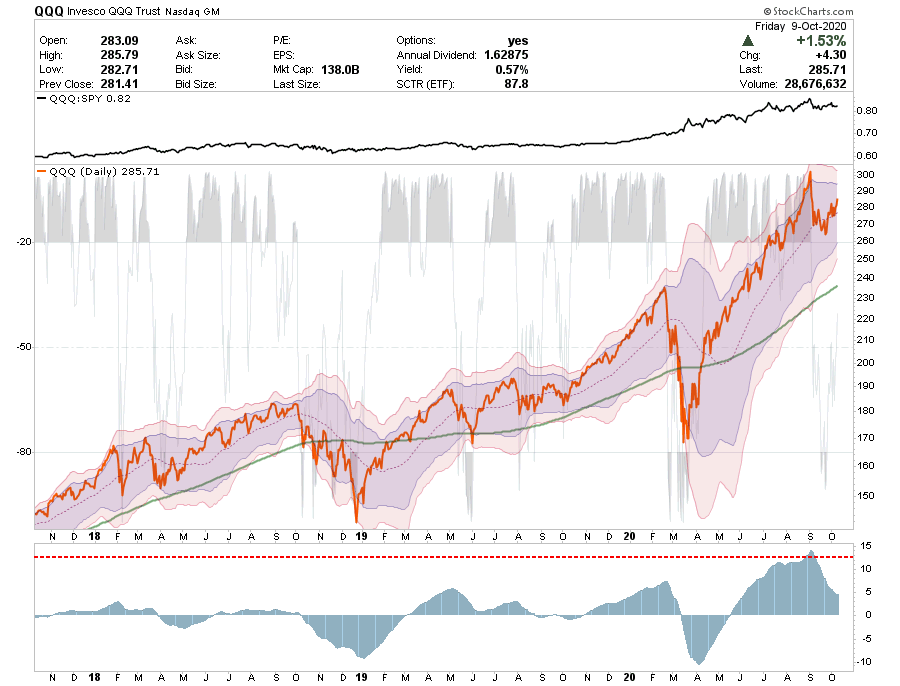
- The Nasdaq has been lagging performance this past week as other market sectors have been playing a bit of catch up.
- This is actually good news as the extreme overbought condition has been reversed. If the next market correction holds support, such will likely provide a good opportunity to add exposure aggressively.
- There is still a tradeable opportunity in Technology stocks, just honor stop losses.
- Short-Term Positioning: Bullish
- Last Week: No changes this week.
- This Week: Taking profits.
- Stop-loss moved up to $240
- Long-Term Positioning: Bullish
S&P 600 Index (Small-Cap)
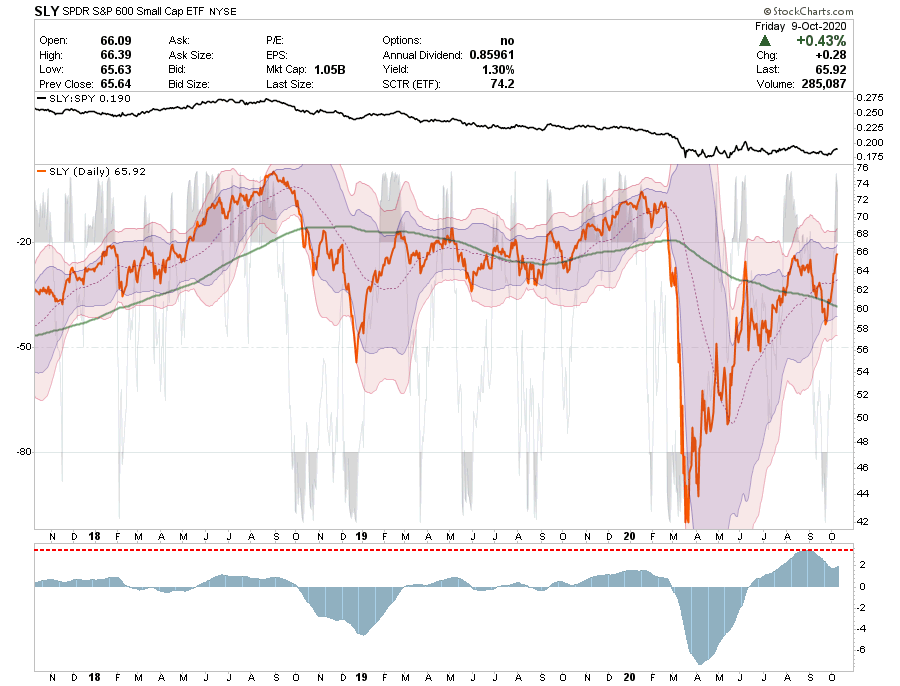
- As noted last week, “With the 50-dma crossed above the 200-dma, there is support for a further rally in small-caps.” That rally came to pass, and now small-caps have again become very deviated from their long-term mean.
- Risk is to the downside currently, but there is a chase to gain exposure to lagging sectors by investors right now.
- It is still suggested to use the current rally to rebalance positions until the downtrend is reversed.
- Short-Term Positioning: Bullish
- Last Week: No positions
- This Week: No positions.
- Stop-loss violated.
- Long-Term Positioning: Bearish
S&P 400 Index (Mid-Cap)
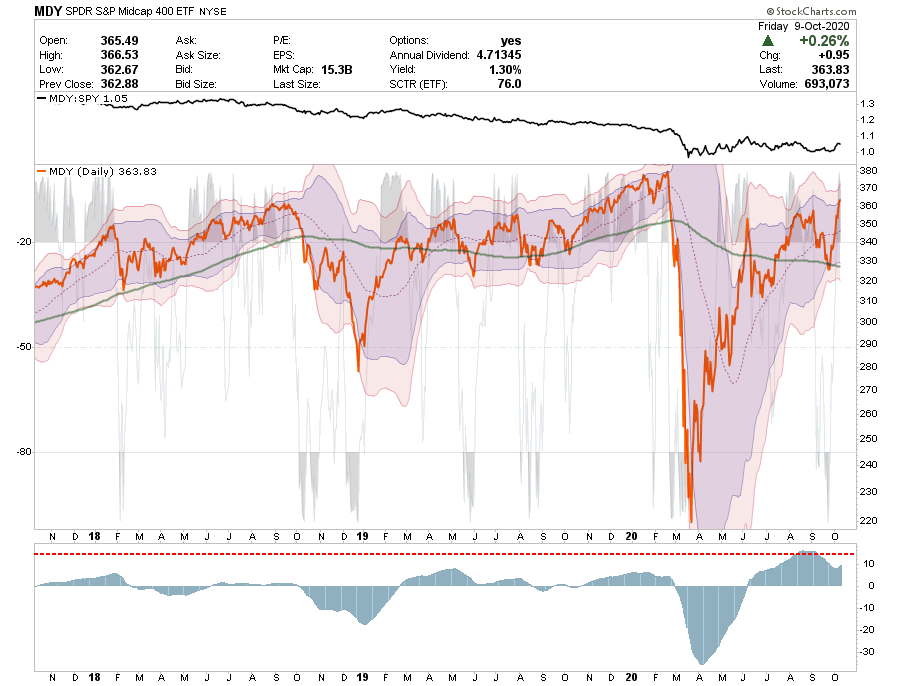
- MDY performed better than SLY last week, but it is extremely extended from its long-term mean like SLY.
- The tradeable opportunity in Mid-caps we discussed previously is likely over for now. Keep stops tight at the 50-dma for now. Look for pullbacks to support to add exposure.
- The $330 stop-loss remains intact, but just barely.
- Short-Term Positioning: Bullish
- Last Week: No holding
- This Week: No holding
- Stop Loss is set at $330
- Long-Term Positioning: Bullish
Emerging Markets
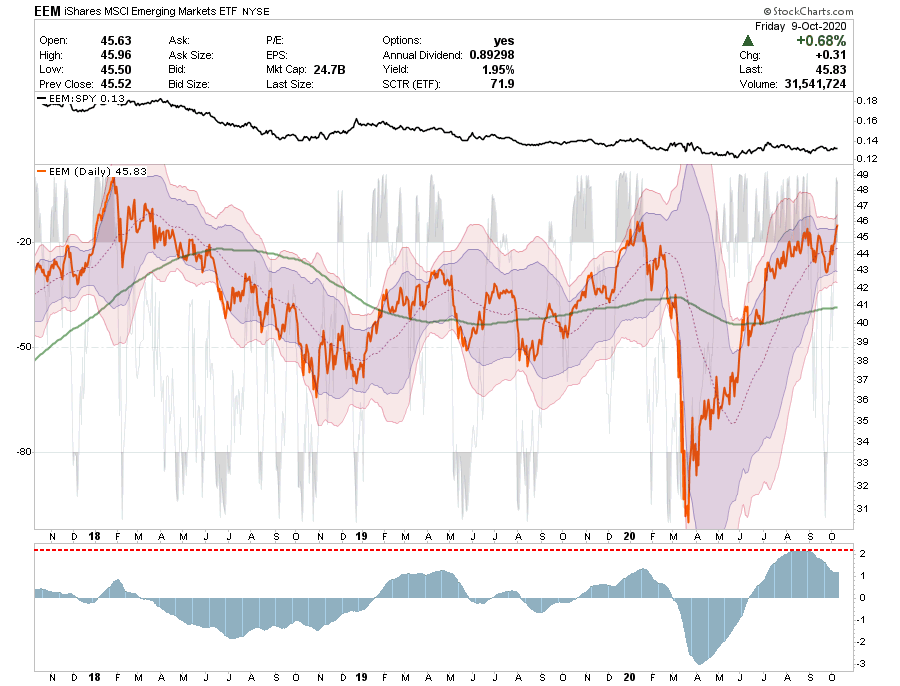
- Emerging markets had performed better on a relative basis during the correction. Still, now they are pushing back into 3-standard deviation territory, which has previously been a good opportunity to take profits.
- EEM is no longer oversold, so use this rally to reduce risk temporarily.
- Short-Term Positioning: Bullish
- Last Week: No position
- This Week: No position.
- Stop-loss moved to $42 for trading positions.
- Long-Term Positioning: Bullish
International Markets
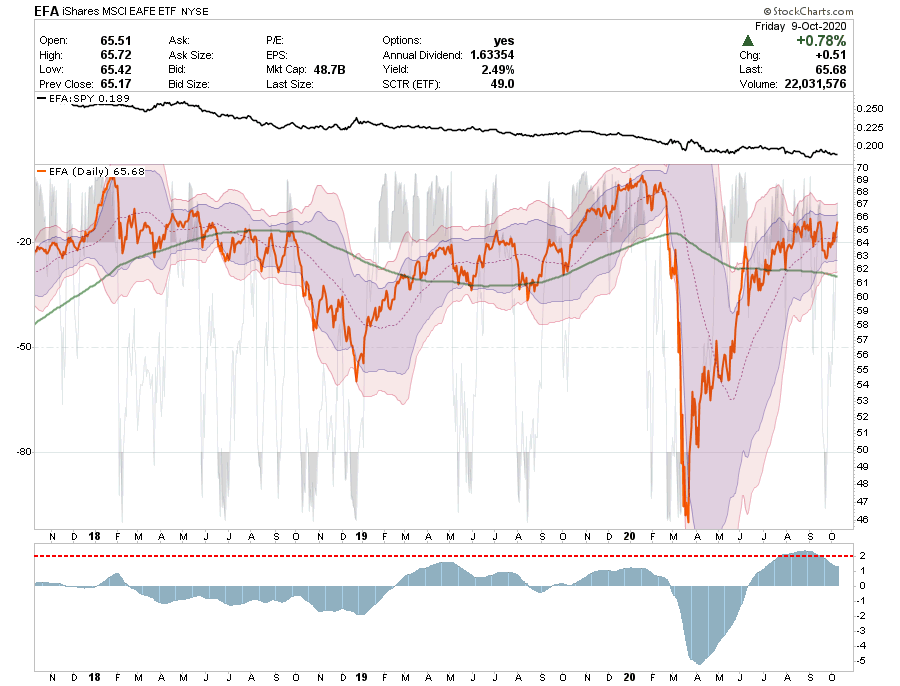
- International markets performed worse than emerging markets last week, but are not as grossly extended either.
- Maintain stops and use the rally to reduce risk.
- Short-Term Positioning: Bullish
- Last Week: No position.
- This Week: No position.
- Stop-loss set at $62
- Long-Term Positioning: Bullish
West Texas Intermediate Crude (Oil)
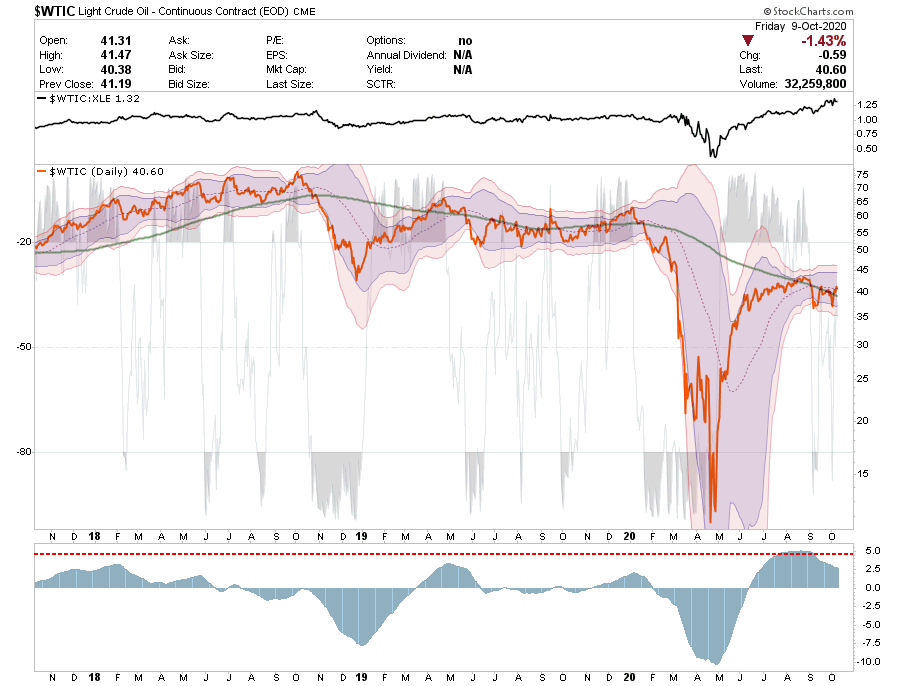
- The rally in oil occurred and finally broke above the 200-dma. The worst may be over for now in oil if prices can hold above these levels.
- Short-Term Positioning: Bearish
- Last Week: Hold positions
- This Week: Hold positions
- Stop for trading positions at $32.50
- Long-Term Positioning: Bearish
Gold
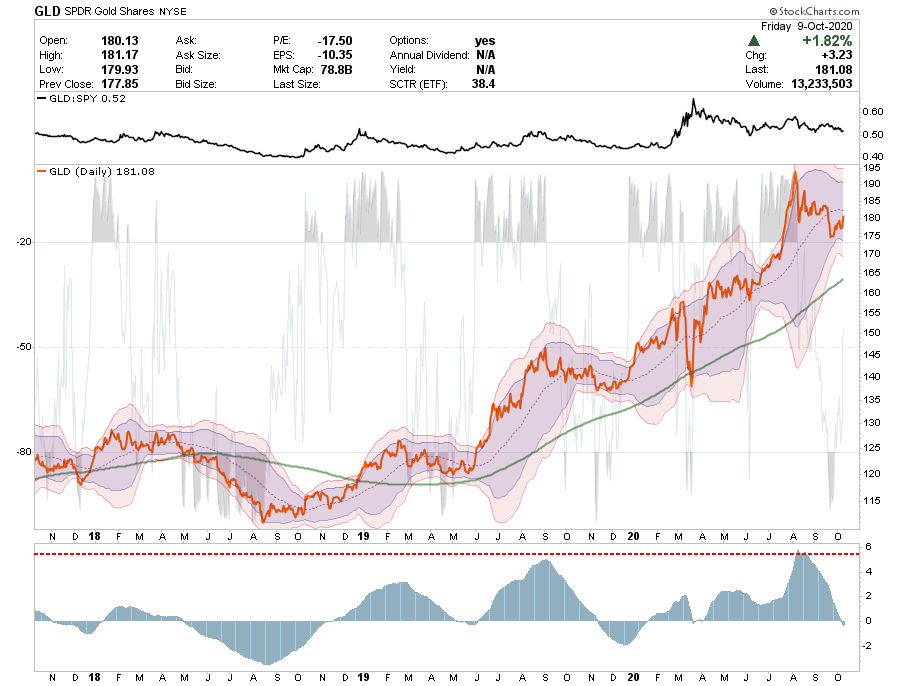
- After previously adding to our positions in GDX and IAU, we continue to hold our positions.
- The sector is currently on a sell-signal and is not extremely oversold. However, further consolidation may provide a perfect entry point to add further exposure.
- Stops are reset at $165.
- We believe downside risk is relatively limited, but as always, maintain stops.
- Short-Term Positioning: Bullish
- Last week: Added 1% to GDX and IAU
- This week: No changes this week.
- Stop-loss adjusted to $165
- Long-Term Positioning: Bullish
Bonds (Inverse Of Interest Rates)
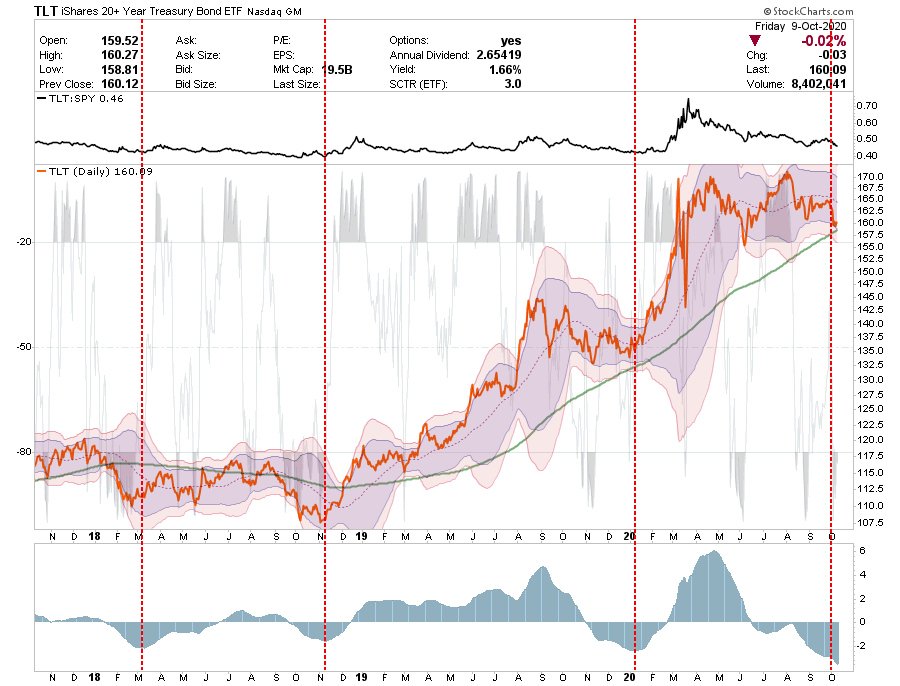
- Bonds continued to hold up last week and is continuing its consolidation process.
- There is still upside potential in bonds from the current oversold condition.
- Furthermore, the “sell signal” is now at levels that have typically preceded more massive rallies in bonds.
- Investors can still add to Treasuries at current levels.
- Short-Term Positioning: Neutral
- Last Week: Hold positions.
- This Week: Sold AGG and added a 5% position in PFF.
- Stop-loss moved up to $157.50
- Long-Term Positioning: Bullish
U.S. Dollar
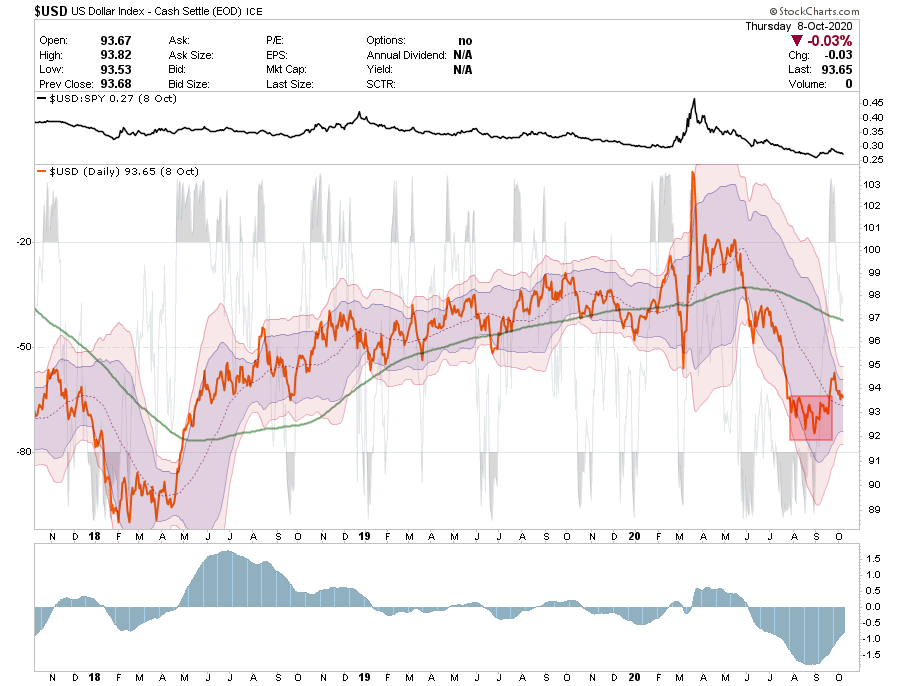
- The dollar rally stumbled this past week and is testing the 50-dma.
- We still suspect that we could see a further rally in the next couple of weeks with the large short-position. Watch for the buy signal in the lower panel of the chart for a signal to go long the $USD.
- Subsequently, a dollar rally will devalue international and emerging market holdings, so act accordingly.
- Use weakness to add to positions that hold the 50-dma.
- Stop-loss adjusted to $92.


Lance Roberts is a Chief Portfolio Strategist/Economist for RIA Advisors. He is also the host of “The Lance Roberts Podcast” and Chief Editor of the “Real Investment Advice” website and author of “Real Investment Daily” blog and “Real Investment Report“. Follow Lance on Facebook, Twitter, Linked-In and YouTube
Customer Relationship Summary (Form CRS)
Also Read


