


HOW TO READ THE MAJOR MARKET BUY-SELL REVIEW 10-05-20
There are three primary components to each Major Market Buy/Sell chart in this RIAPro review:
- The price chart is in orange
- The Over Bought/Over Sold indicator is in gray
- The Buy / Sell indicator is in blue.
When the gray indicator is at the TOP of the chart, there is typically more risk and less reward available at the current time. In other words, the best time to BUY is when the short-term condition is over-sold. Likewise, when the buy/sell indicator is above the ZERO line, investments tend to work better.
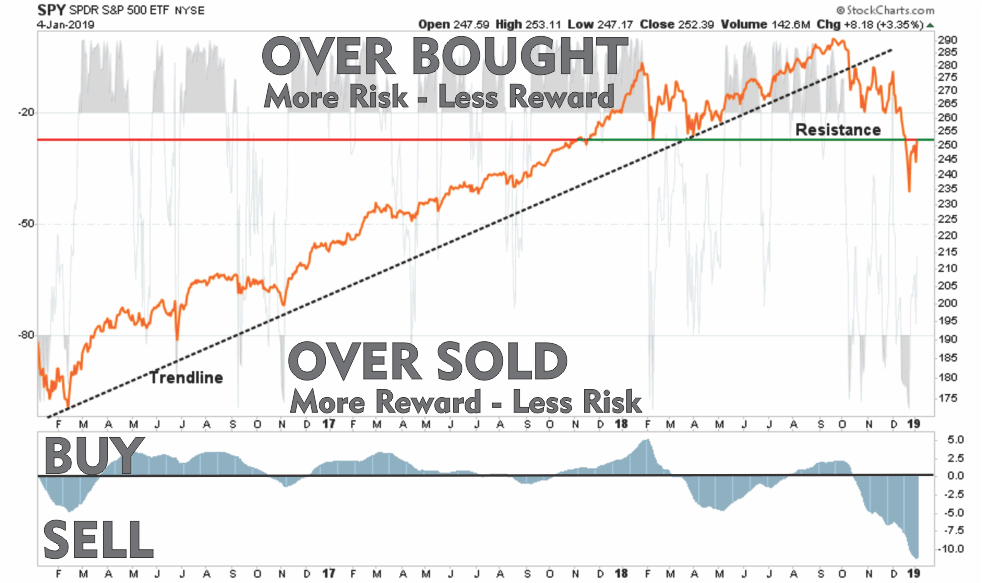
With this basic tutorial, let’s review the major markets.
Major Market Buy/Sell Review 10-05-20
S&P 500 Index
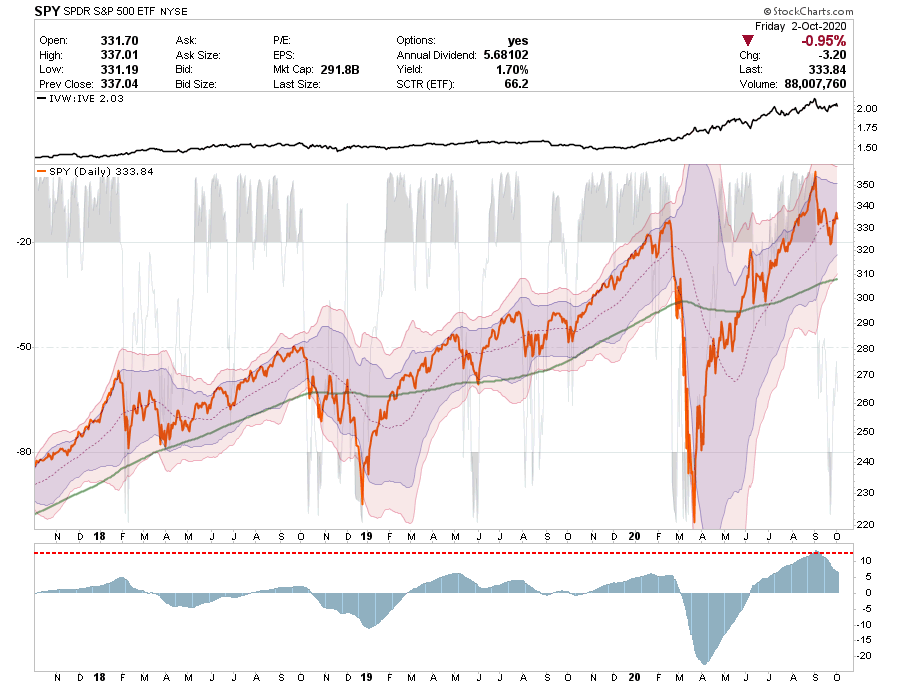
- As noted last week: “The market is now oversold short-term, so look for a tradable rally next week.”
- The markets did manage to rally this week but ran into trouble on Friday with Trump’s announcement of the COVID infection.
- The break back below the 50-dma does provide a short-term negative, so we added a short-S&P 500 hedge to our portfolio to offset the increases in equity risk made earlier this week.
- Short-Term Positioning: Bullish
- Last Week: No holdings.
- This Week: Added 2% SDS – 2x Short-S&P 500 Index
- Stop-loss set at $310 for trading positions.
- Long-Term Positioning: Bullish
Dow Jones Industrial Average
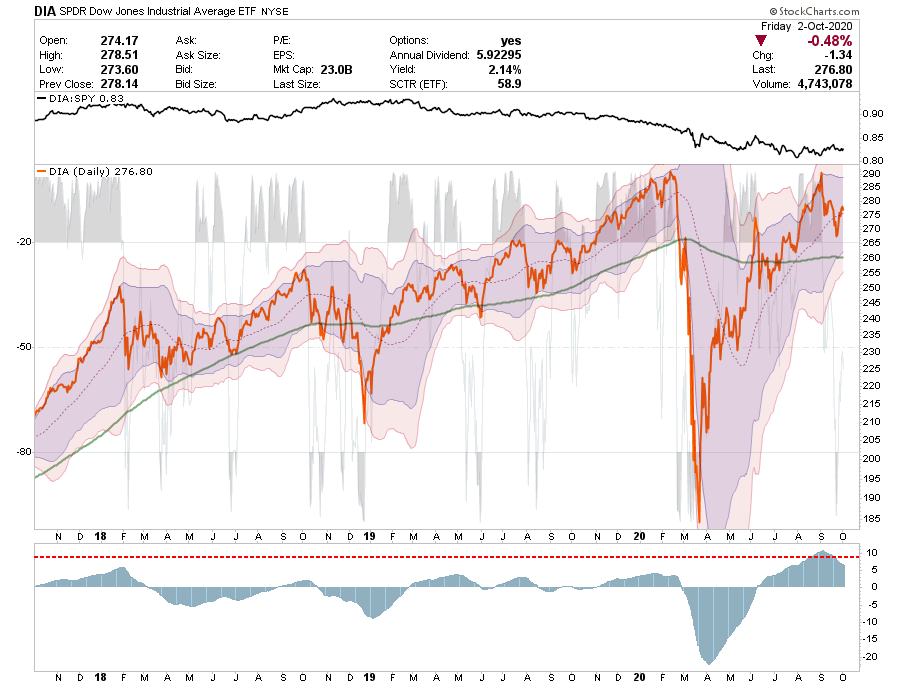
- We also suggested that with the Dow oversold, a tradeable rally is likely.
- Like the S&P it struggling with the 50-dma, so this is still a market to sell into for now until resistance is taken out.
- Short-Term Positioning: Bearish
- Last Week: No position.
- This Week: No position.
- Stop-loss moved up to $260
- Long-Term Positioning: Bullish
Nasdaq Composite
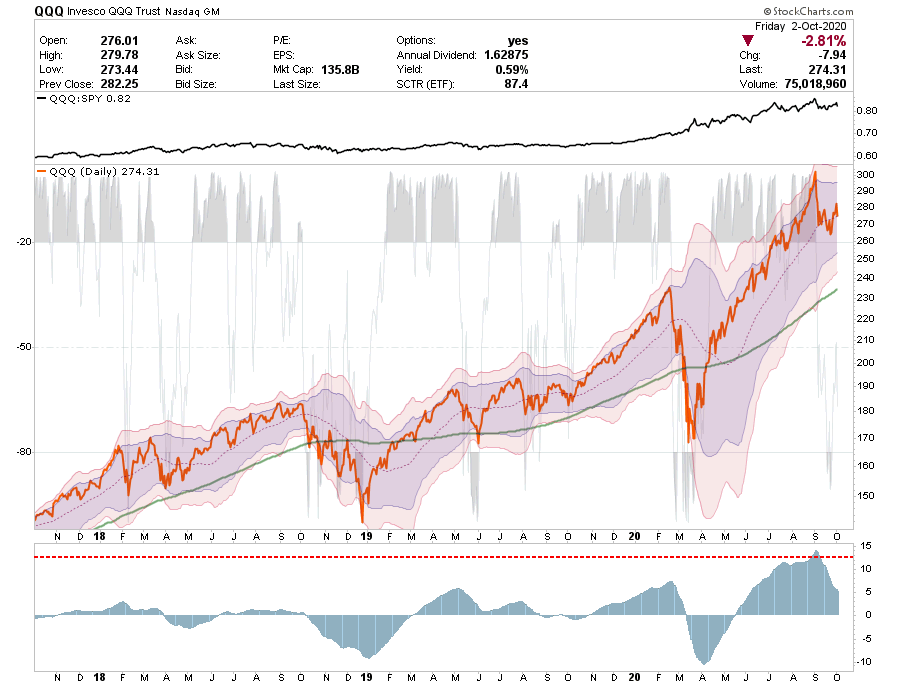
- As noted last week: “The Nasdaq failed to get above the 50-dma, if it fails at that level, we are likely going to see additional weakness.”
- Despite the rally this past week, it did perform weaker than other markets on Friday.
- There is still a tradeable opportunity in Technology stocks, just honor stop losses.
- Short-Term Positioning: Bearish.
- Last Week: No changes this week.
- This Week: Taking profits.
- Stop-loss moved up to $240
- Long-Term Positioning: Bullish
S&P 600 Index (Small-Cap)

- The rally in small caps reclaimed the 200-dma this past week but failed to climb above the 50-dma.
- With the 50-dma crossed above the 200-dma there is support for a further rally in small-caps.
- Risk is to the downside currently, as previous stops were violated,
- It is still suggested to use the current rally to rebalance positions until the downtrend is reversed.
- Short-Term Positioning: Bearish – Market Risk Is High
- Last Week: No positions
- This Week: No positions.
- Stop-loss violated.
- Long-Term Positioning: Bearish
S&P 400 Index (Mid-Cap)
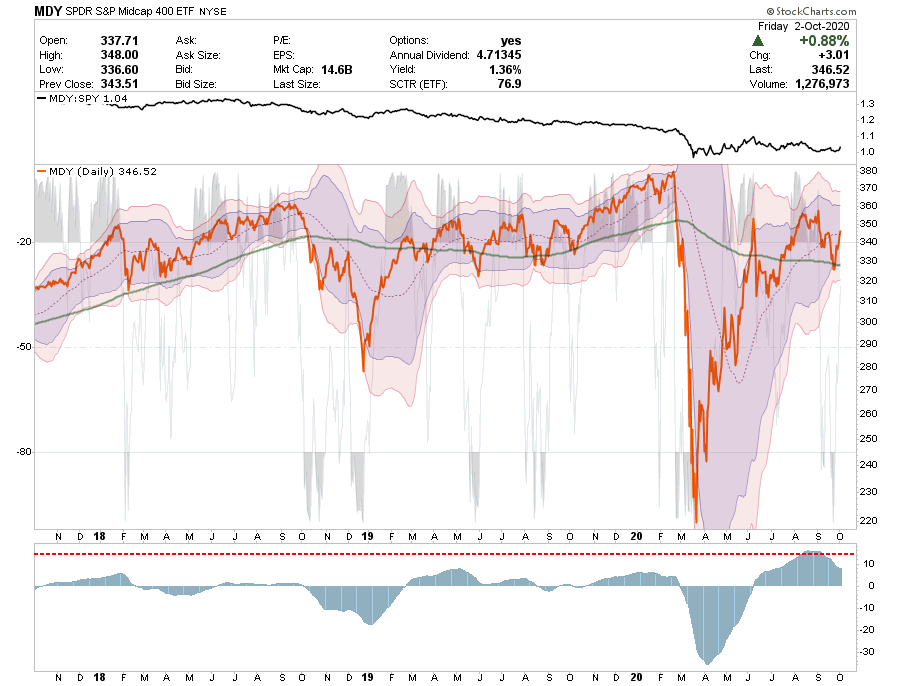
- MDY performed better than SLY last week.
- MDY successfully tested its 200-dma and held.
- There is a tradeable opportunity in Mid-caps for now. Keep stops tight at the 200-dma.
- The $330 stop-loss remains intact, but just barely.
- Short-Term Positioning: Bearish
- Last Week: No holding
- This Week: No holding
- Stop Loss is set at $330
- Long-Term Positioning: Bearish
Emerging Markets
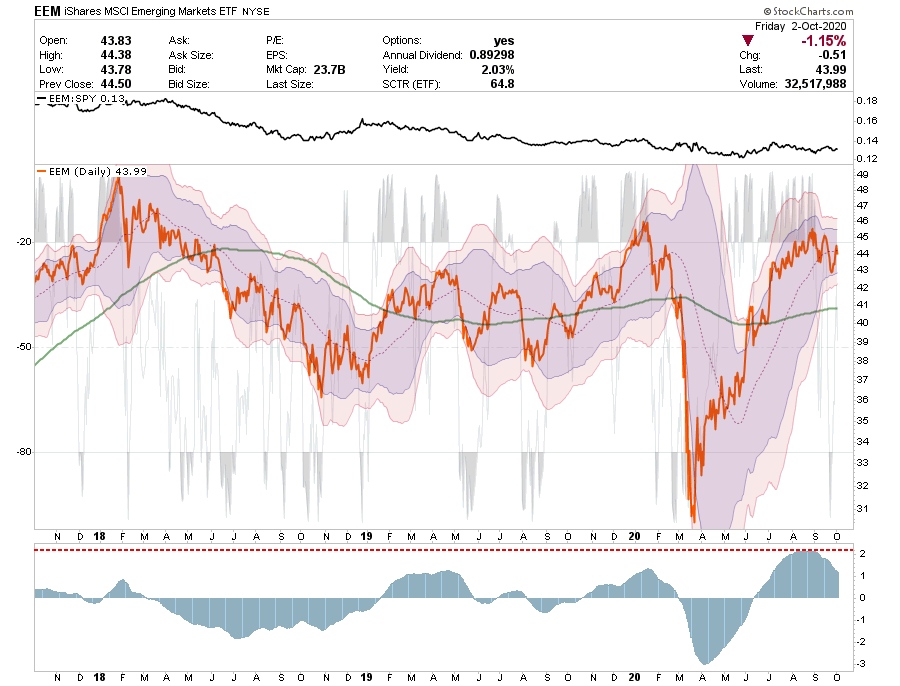
- Emerging markets had performed better on a relative basis during the correction, but failed at the 50-dma this past week.
- EEM is no longer oversold, so use this rally to reduce risk temporarily until the downtrend is reversed.
- Short-Term Positioning: Bullish
- Last Week: No position
- This Week: No position.
- Stop-loss moved to $42 for trading positions.
- Long-Term Positioning: Bearish
International Markets
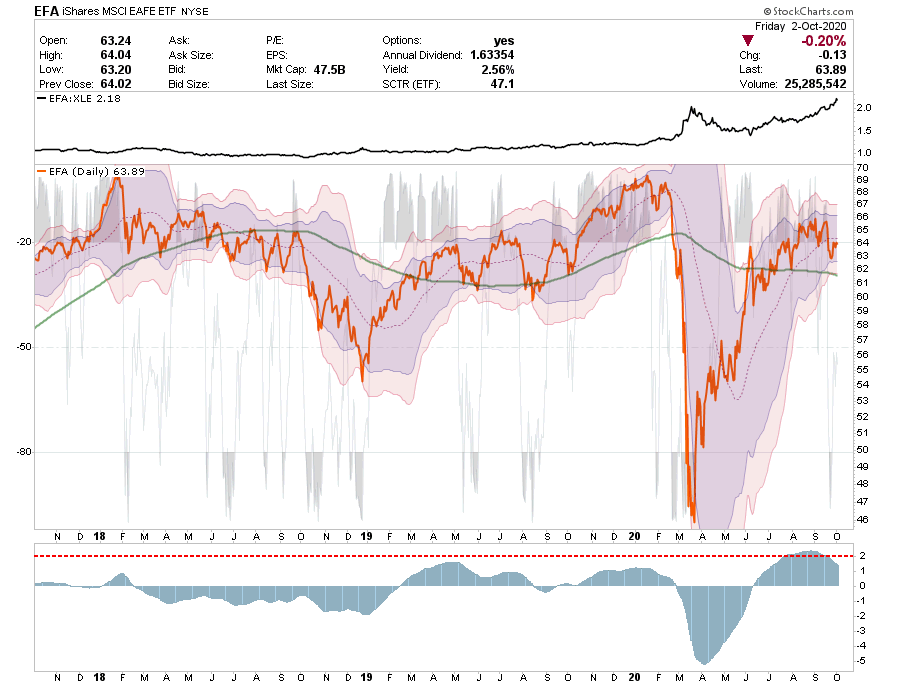
- International markets performed worse than emerging markets last week, and also failed resistance at the 50-dma.
- Maintain stops and use the rally to reduce risk.
- Short-Term Positioning: Bearish
- Last Week: No position.
- This Week: No position.
- Stop-loss set at $62
- Long-Term Positioning: Bearish
West Texas Intermediate Crude (Oil)
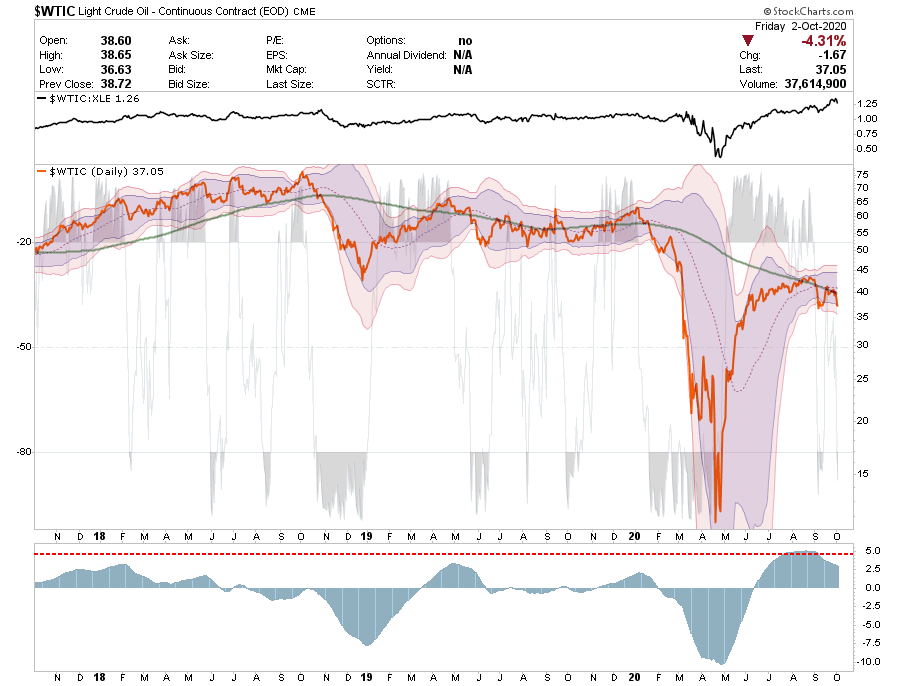
- The rally in oil occurred but did little to help the energy sector. Energy stocks remain under tremendous pressure currently.
- Oil tested and failed resistance at the 200-dma. It needs to clear that if energy is going to get a lift.
- Short-Term Positioning: Bearish
- Last Week: Hold positions
- This Week: Hold positions
- Stop for trading positions at $32.50
- Long-Term Positioning: Bearish
Gold
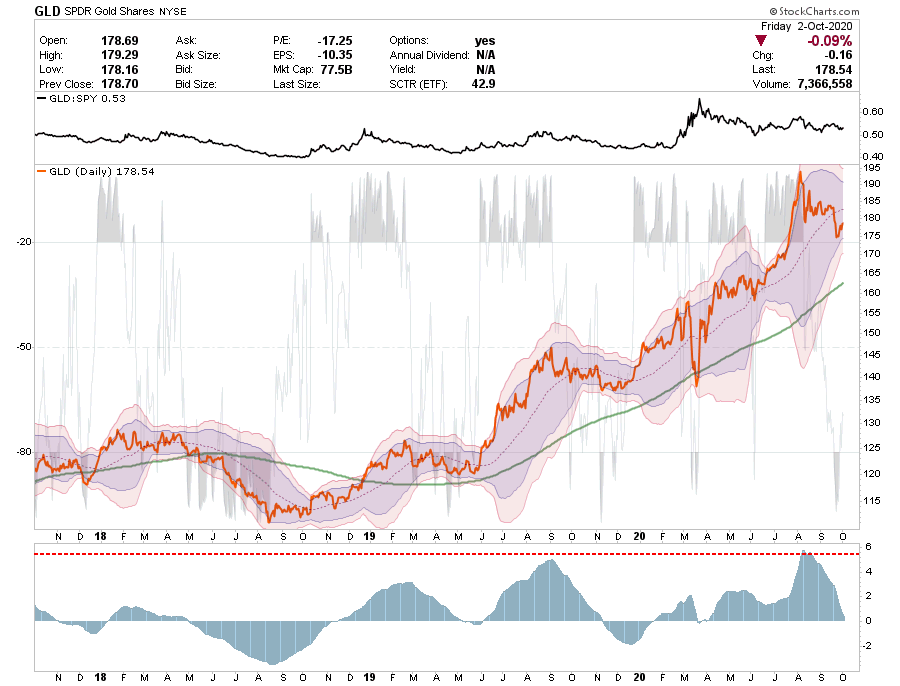
- We remain long in our current position in IAU and GDX.
- As noted previously, we were looking to increase our exposure when gold got oversold or the dollar rally appears to be over.
- Both of those things occurred this past week, so we increased our holdings slightly.
- Stops are reset at $165.
- We believe downside risk is relatively limited, but as always, maintain stops.
- Short-Term Positioning: Bullish
- Last week: Hold positions.
- This week: Added 1% to GDX and IAU.
- Stop-loss adjusted to $165
- Long-Term Positioning: Bullish
Bonds (Inverse Of Interest Rates)
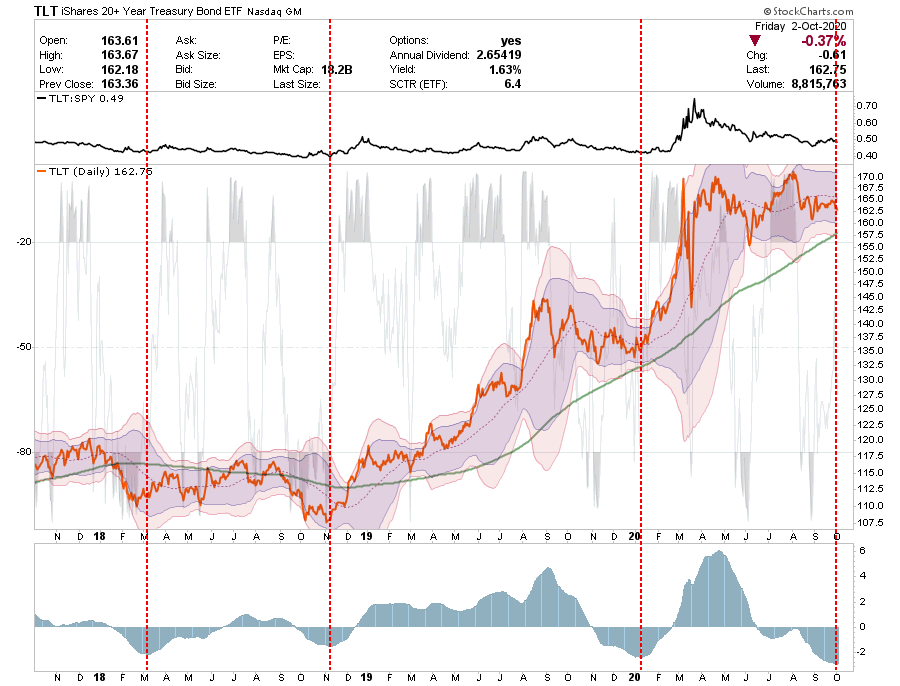
- Bonds continued to hold up last week and is continuing its consolidation process.
- There is still upside potential in bonds from the current oversold condition.
- Furthermore, the “sell signal” is now at levels that have typically preceded more massive rallies in bonds.
- Investors can still add to Treasuries at current levels.
- Short-Term Positioning: Neutral
- Last Week: We sold 50% of AGG, added a position in IEF, and added to MBB.
- This Week: Hold positions.
- Stop-loss moved up to $157.50
- Long-Term Positioning: Bullish
U.S. Dollar

- The dollar rally stumbled on Friday with President Trump’s COVID announcement.
- However, it is likely with the dollar now above resistance at the 50-dma, we could see a further rally in the next couple of weeks.
- Traders can add positions to hedge portfolios, but there is not likely a colossal move available currently given the current market dynamics. However, there is a record number of dollar short positions. If they are forced to cover in an urgent manner, we might see a brief but sharp surge higher.
- That rally has started. However, the dollar is overbought short-term. Use weakness to add to positions that hold the 50-dma.
- Stop-loss adjusted to $92.


Lance Roberts is a Chief Portfolio Strategist/Economist for RIA Advisors. He is also the host of “The Lance Roberts Podcast” and Chief Editor of the “Real Investment Advice” website and author of “Real Investment Daily” blog and “Real Investment Report“. Follow Lance on Facebook, Twitter, Linked-In and YouTube
Customer Relationship Summary (Form CRS)
Also Read


