


Each week we produce a chart book of the major financial markets to review whether the markets, as a whole, warrant higher levels of equity risk in portfolios or not. Stocks, as a whole, tend to rise and fall with the overall market. Therefore, if we get the short-term trend of the market right, our portfolios should perform respectively.
HOW TO READ THE CHARTS
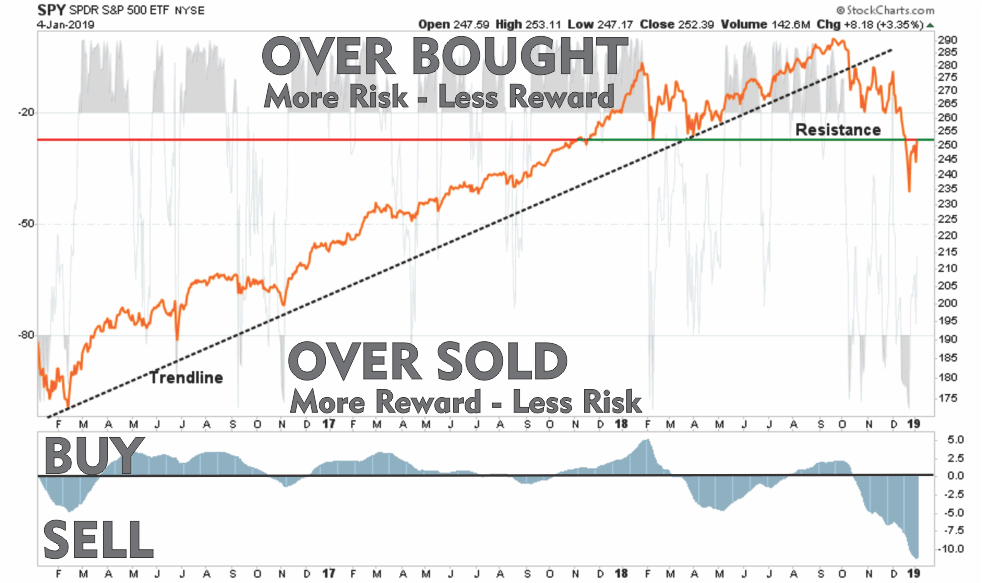
There are three primary components to each chart:
- The price chart is in orange
- The Over Bought/Over Sold indicator is in gray
- The Buy / Sell indicator is in blue.
When the gray indicator is at the TOP of the chart, there is typically more risk and less reward available at the current time. In other words, the best time to BUY is when the short-term condition is over-sold. Likewise when the buy/sell indicator is above the ZERO line investments have a tendency of working better than when below the zero line.
With this basic tutorial let’s review the major markets.
S&P 500 Index
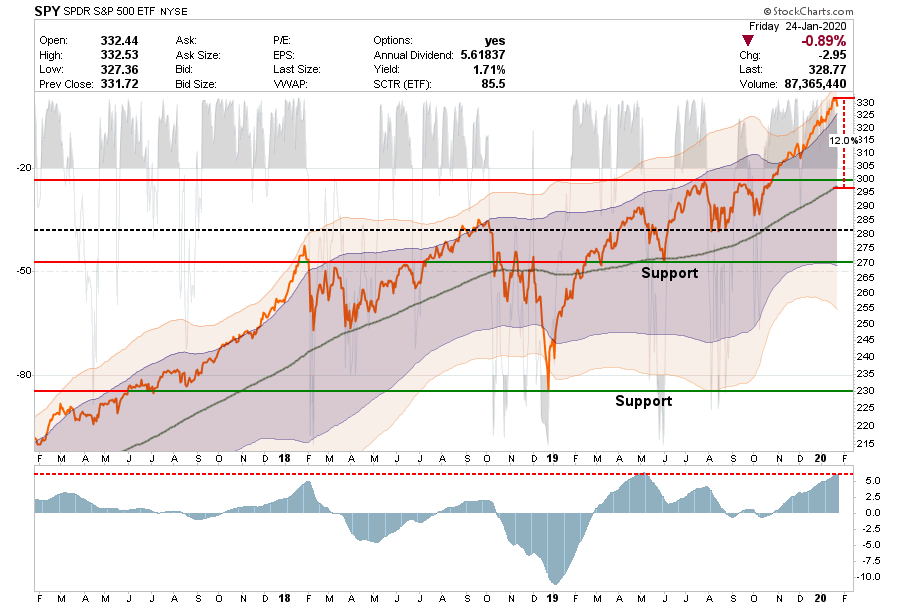
- As noted last week: “With the market now trading 12% above its 200-dma, and well into 3-standard deviations of the mean, a correction is coming.” That correction started on Friday.
- Even with the sell-off on Friday, it barely registered in terms of reducing the overbought or extended levels of the market. There is likely a bit more correction to come to buy into.
- As noted we took profits in both the ETF and Equity Model (See Portfolio Commentary). We will likely have a much better entry point in the next couple of months to buy into.
- Short-Term Positioning: Neutral Due To Extension
- Last Week: Hold position
- This Week: Take profits and rebalance to target weights.
- Stop-loss moved up to $300
- Long-Term Positioning: Neutral due to valuations
Dow Jones Industrial Average
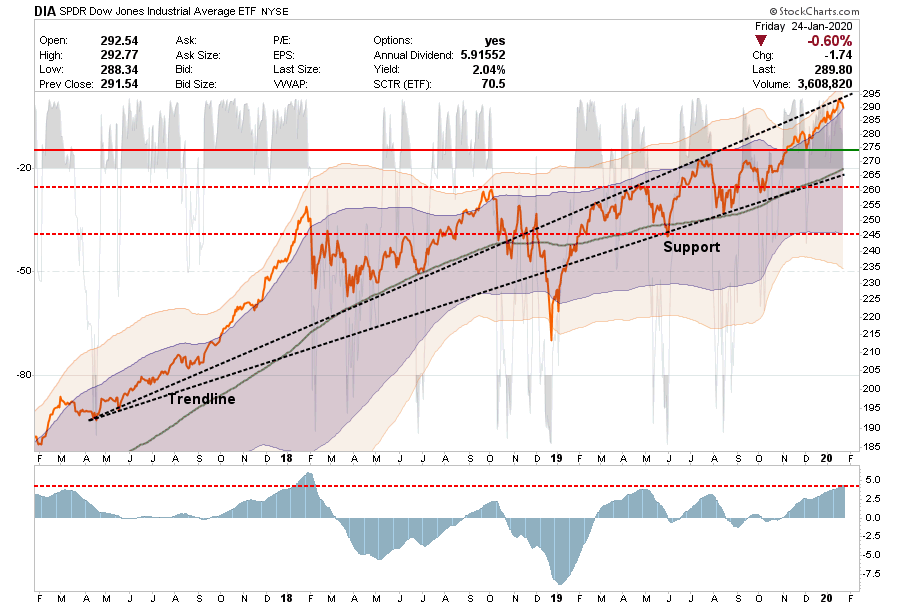
- As goes the S&P 500, goes the DIA, especially when MSFT & AAPL are the two top holdings and drivers of the advances in both markets. (We reduced both of those holdings last week.)
- Like SPY, the sell-off on Friday barely registered on the chart. The “buy” signal remains extremely extended along with a very overbought condition.
- Take profits, but as with SPY, wait for a correction before adding further exposure.
- Short-Term Positioning: Neutral due to extensions
- Last Week: Hold current positions
- This Week: Take profits and rebalance risk.
- Stop-loss moved up to $275
- Long-Term Positioning: Neutral
Nasdaq Composite
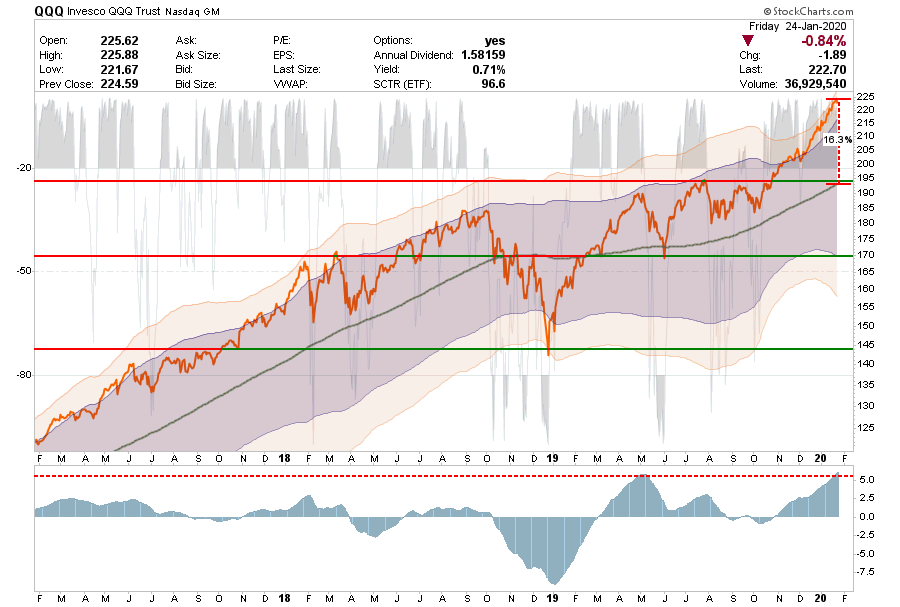
- Again, like SPY, the sell-off on Friday barely registered. Nasdaq remains “extremely” extended currently. As noted last week, “With QQQ now pushing towards a 4-standard deviation event. A correction is inevitable, it is just a function of time now.”
- The Nasdaq “buy signal” is also back to extremely overbought levels so look for a correction to add exposure.
- Short-Term Positioning: Neutral due to extensions.
- Last Week: Hold position
- This Week: Take profits and rebalance risks.
- Stop-loss moved up to $195
- Long-Term Positioning: Neutral due to valuations
S&P 600 Index (Small-Cap)
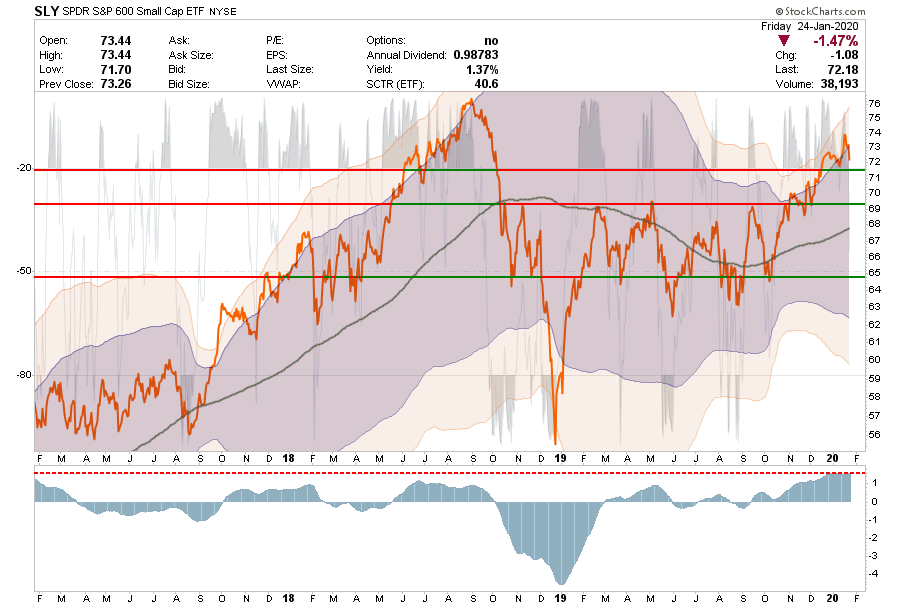
- Small caps corrected more than the major markets, but they also haven’t moved as much.
- The buy signal remains extremely extended, and the index overbought, so there is likely more correction to come.
- Th correction needs to hold the current support level while it works off the overextended buy signal. A failure here and the previous breakout levels will be the next important support and our stop level.
- Short-Term Positioning: Neutral due to extensions.
- Last Week: Hold positions
- This Week: Hold positions
- Stop loss moved up to $69
- Long-Term Positioning: Neutral
S&P 400 Index (Mid-Cap)
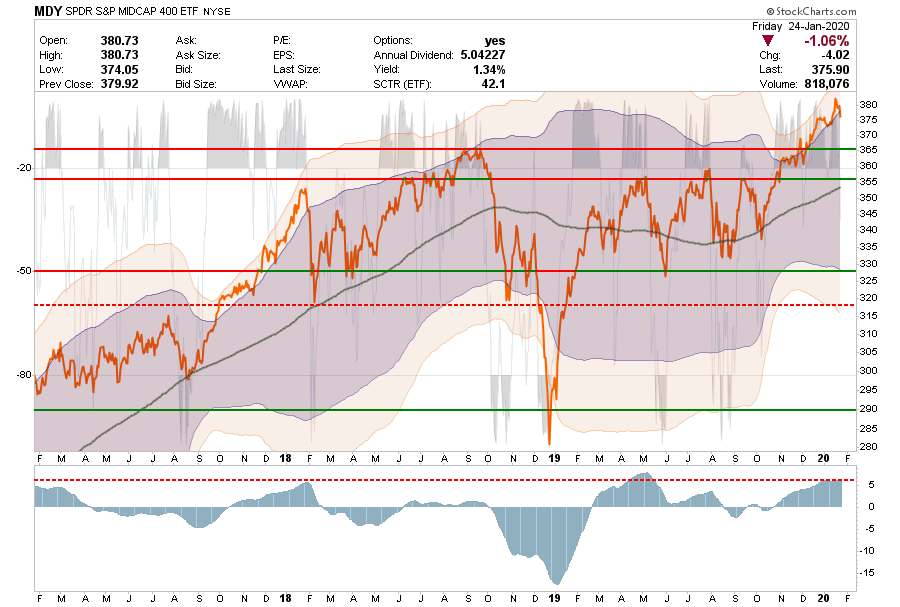
- Like SLY, MDY also started to correct this past week.
- MDY remains extremely extended and deviated above the 200-dma, so more corrective action is likely. Look for a reversal of the overbought condition to add to the index.
- The previous breakout level needs to hold while the overbought condition is reversed.
- Short-Term Positioning: Neutral due to extensions.
- Last Week: No holding
- This Week: No holding
- Long-Term Positioning: Bullish
Emerging Markets
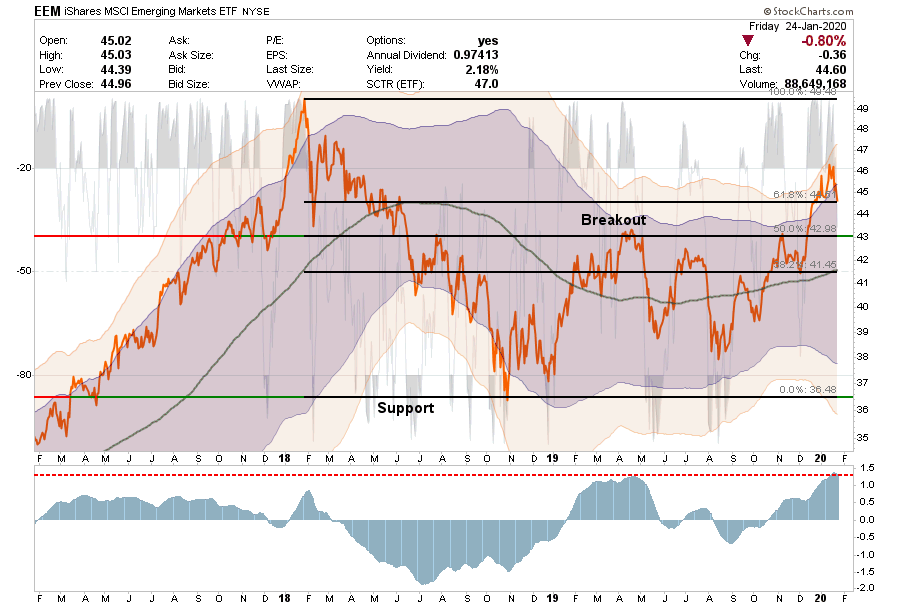
- EEM is just like every other market.
- As noted last week, with the “buy signal” extremely extended, a correction is coming so be patient to add exposure assuming stop levels are not violated. That correction started on Friday.
- Initial support is being tested and the market remains extremely overbought so be patient.
- The Dollar (Last chart) is the key to our international positioning. The dollar looks to have confirmed a break lower, but has been strengthening as of late which is a negative for Oil and International Markets.
- Short-Term Positioning: Neutral
- Last Week: Hold positions
- This Week: Hold positions
- Stop-loss set at $43
- Long-Term Positioning: Neutral
International Markets
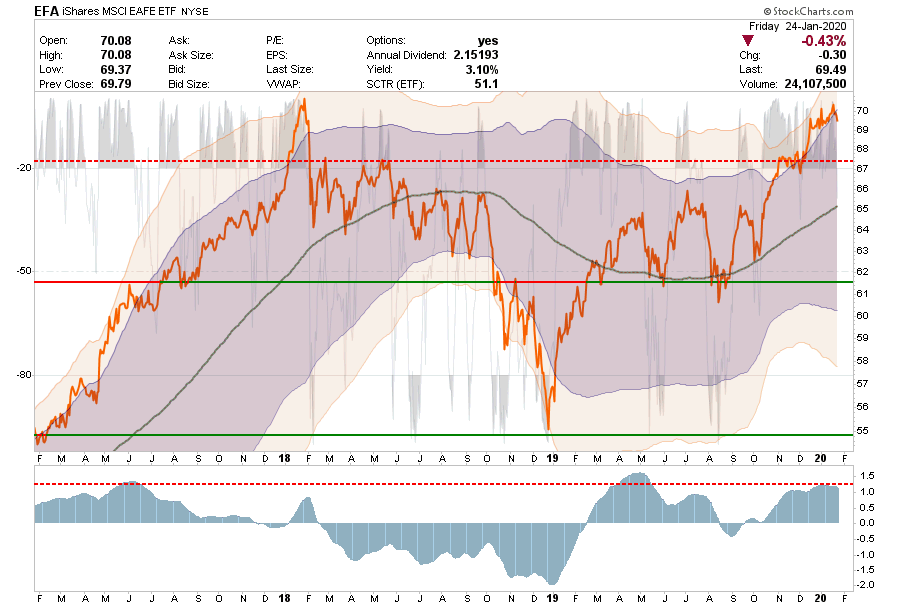
- Like EEM, EFA rallied out of its consolidation channel, broke out, and has now rallied well into 3-standard deviation territory. The correction that started on Friday is extremely mild, so more correction is likely.
- With EFA both EXTREMELY overbought and extended with the buy signal at levels which signaled the start of the short- to intermediate term correction.
- As with EEM, the key to our positioning is the US Dollar.
- Short-Term Positioning: Neutral
- Last Week: Hold positions
- This Week: Hold positions
- Stop-loss set at $67
- Long-Term Positioning: Neutral
West Texas Intermediate Crude (Oil)
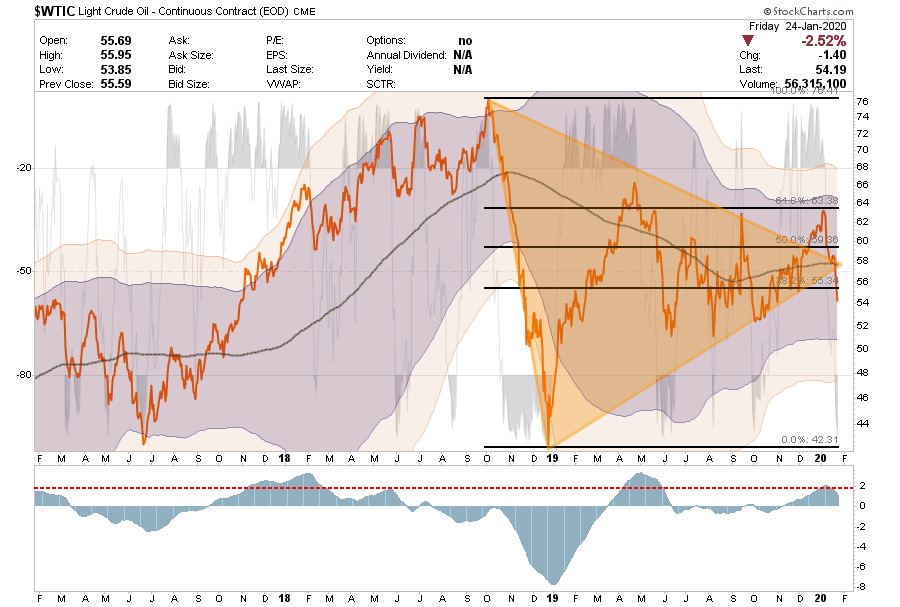
- Oil completely broke down last week, and collapsed below all of the important levels.
- As noted last week: “With oil prices falling back below $60/bbl, it is imperative that oil maintains the 200-dma support level which it is currently testing.” That level failed and prices plunged back towards recent lows.
- This keeps us on hold for now from adding to positions and stops are close to being triggered.
- Short-Term Positioning: Neutral
- Last Week: Hold positions.
- This Week: Hold positions
- Stops Triggered for any direct crude oil positions.
- Long-Term Positioning: Bearish
Gold
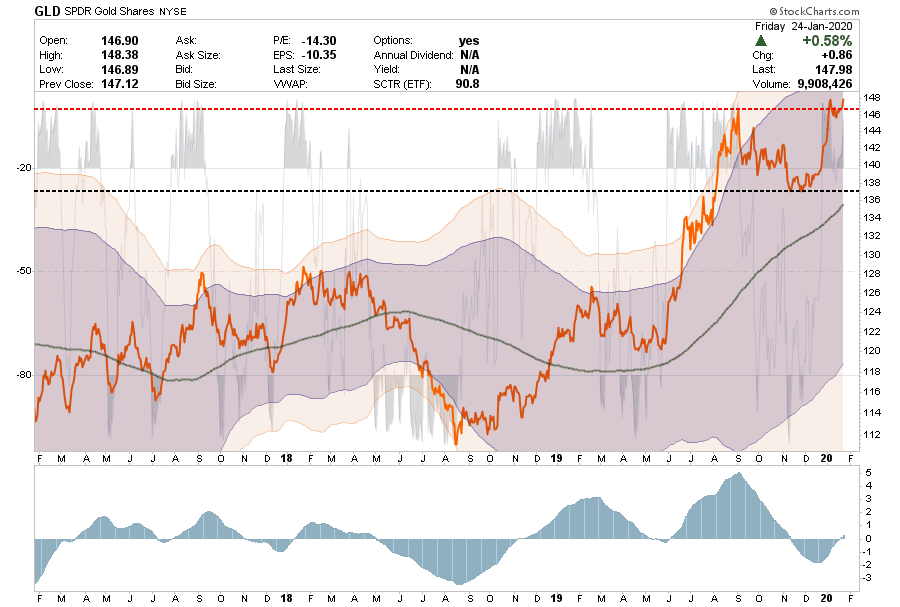
- As noted last week, Gold had rallied sharply and broke out to new highs, suggesting there was something amiss with the stock market exuberance.
- On Friday, gold rallied to new highs once again as money sought safety from stocks. As noted last week: “If gold can muster a rally and break above recent highs, it is likely we will see a further advance.”
- Our positioning looks good particularly since gold has registered a new “buy signal.”
- We used the recent weakness to add to our GDX and IAU positions taking them back to full weightings.
- Short-Term Positioning: Neutral
- Last week: Hold positions.
- This week: Hold positions
- Stop-loss for whole position adjusted to $137
- Long-Term Positioning: Neutral
Bonds (Inverse Of Interest Rates)
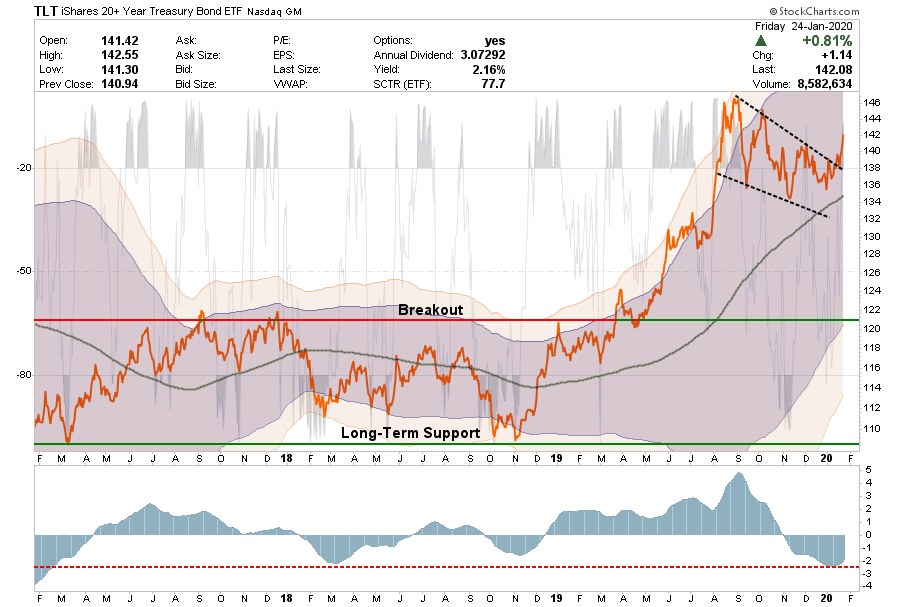
- As noted last week: “I suspect we are going to get some economic turmoil sooner, rather than later, which will lead to a correction in the equity markets and an uptick in bond prices.”
- That occurred last week as bond broke out of their declining trend sending yields lower. That breakout is a decent entry point to add exposure to bonds if you need it. Use a counter trend rally in stocks to pick up bond exposure if needed.
- Short-Term Positioning: Bullish
- Last Week: Hold positions
- This Week: Hold positions
- Stop-loss is moved up to $132
- Long-Term Positioning: Bullish
U.S. Dollar
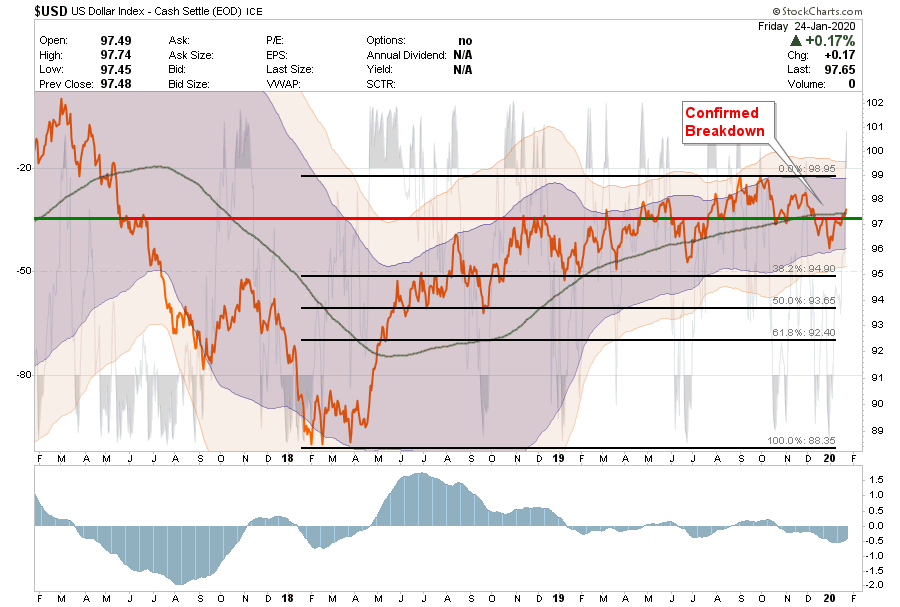
- Previously, we noted the dollar broke down below both the 200-dma and the bullish trend line. It then retested, and failed, at that previous support level which confirms a breakdown in the dollar from its previous bullish channel.
- As noted last week: “The dollar has rallied back to that all important previous support line. IF the dollar can break back above that level, and hold, then commodities, and oil, will likely struggle. It may be too early for a sharper dollar decline currently, as the U.S. economy is still the “cleanest shirt in the dirty laundry.”
- The dollar has continued to test that overhead resistance and looks ready to make a move higher. Such a move will likely trigger stops on international, oil and commodity plays.
- The “sell” signal remains intact currently suggesting there is further downside, if it begins to reverse that will be an important clue.


Lance Roberts is a Chief Portfolio Strategist/Economist for RIA Advisors. He is also the host of “The Lance Roberts Podcast” and Chief Editor of the “Real Investment Advice” website and author of “Real Investment Daily” blog and “Real Investment Report“. Follow Lance on Facebook, Twitter, Linked-In and YouTube
Customer Relationship Summary (Form CRS)
Also Read


