


HOW TO READ THE MAJOR MARKET BUY-SELL REVIEW 08-24-20
There are three primary components to each Major Market Buy/Sell chart in this RIAPro review:
- The price chart is in orange
- The Over Bought/Over Sold indicator is in gray
- The Buy / Sell indicator is in blue.
When the gray indicator is at the TOP of the chart, there is typically more risk and less reward available at the current time. In other words, the best time to BUY is when the short-term condition is over-sold. Likewise, when the buy/sell indicator is above the ZERO line, investments have a tendency of working better.
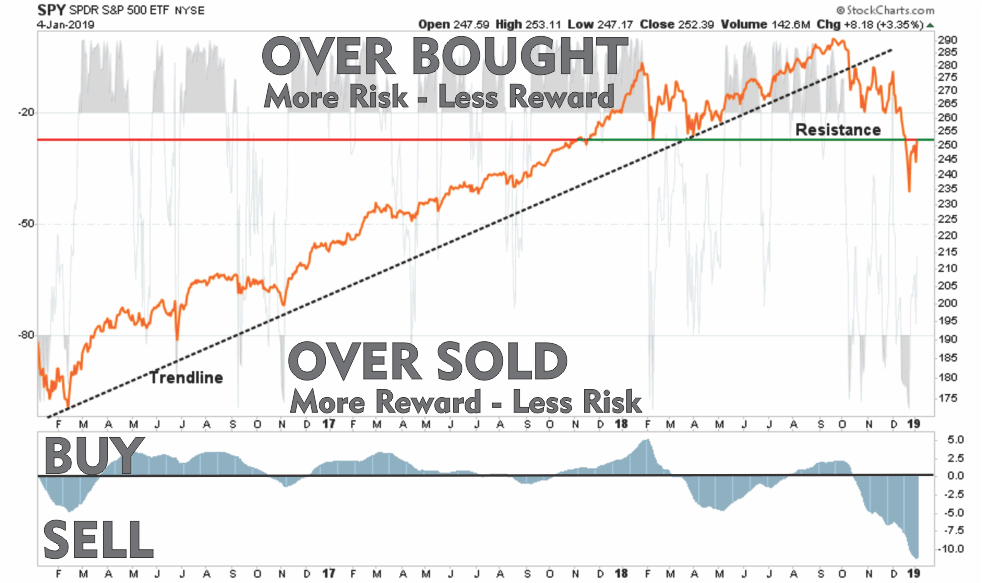
With this basic tutorial, let’s review the major markets.
Major Market Buy/Sell Review 08-24-20
S&P 500 Index
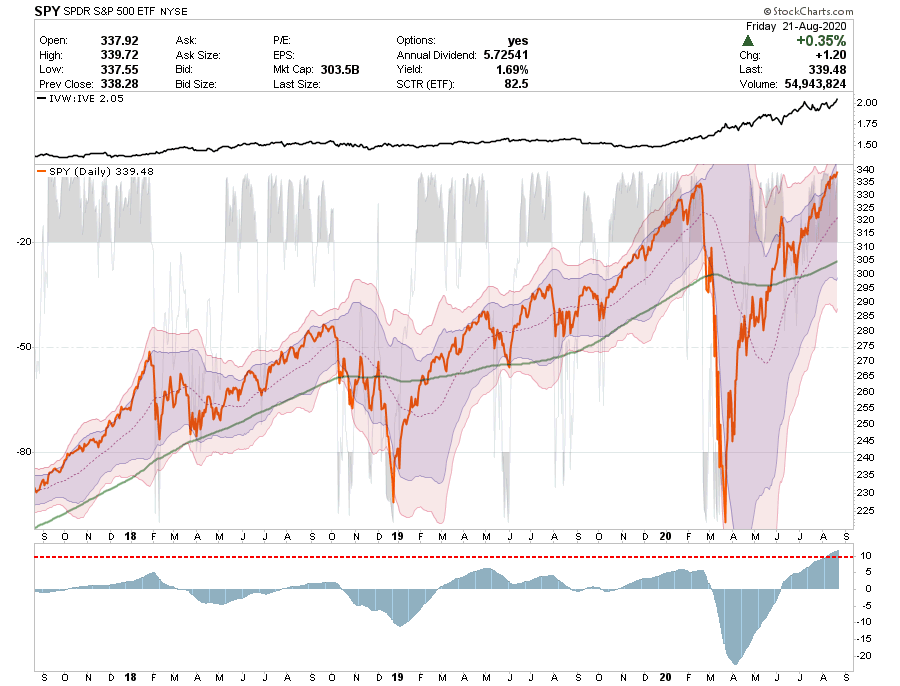
- SPY is now both extremely overbought and pushing into 3-standard deviations above the 50-dma.
- This is the point where a correction usually begins to some degree. As noted in our PORTFOLIO COMMENTARY this week, and the newsletter, we are now beginning to make adjustments for a correction.
- Exuberance is a bit on the extreme side.
- Caution is advised.
- Short-Term Positioning: Bullish
- Last Week: No holdings.
- This Week: No holdings
- Stop-loss set at $305 for trading positions.
- Long-Term Positioning: Bullish
Dow Jones Industrial Average
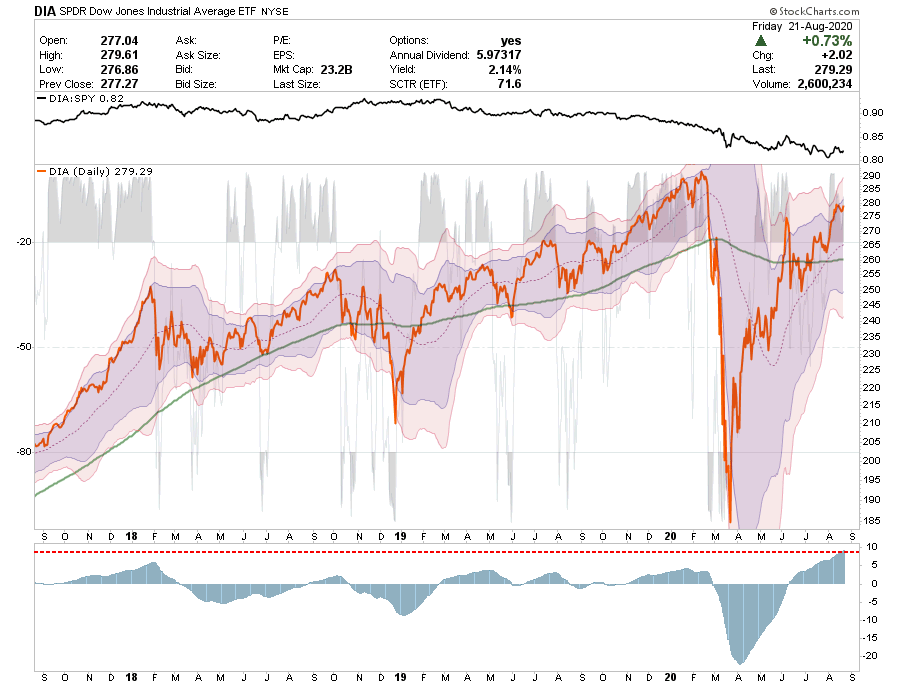
- The Dow continues to underperform other major indices due to its lack of the 5-major FANG stocks. However, there is a concerted effort to try and get it to “all-time” highs as well.
- With the buy-signal extremely extended, pushing into 3-standard deviation territory, and underperforming other assets, watch for a failure that sets up a correction.
- Short-Term Positioning: Bearish
- Last Week: No position..
- This Week: No position.
- Stop-loss moved up to $260
- Long-Term Positioning: Bullish
Nasdaq Composite
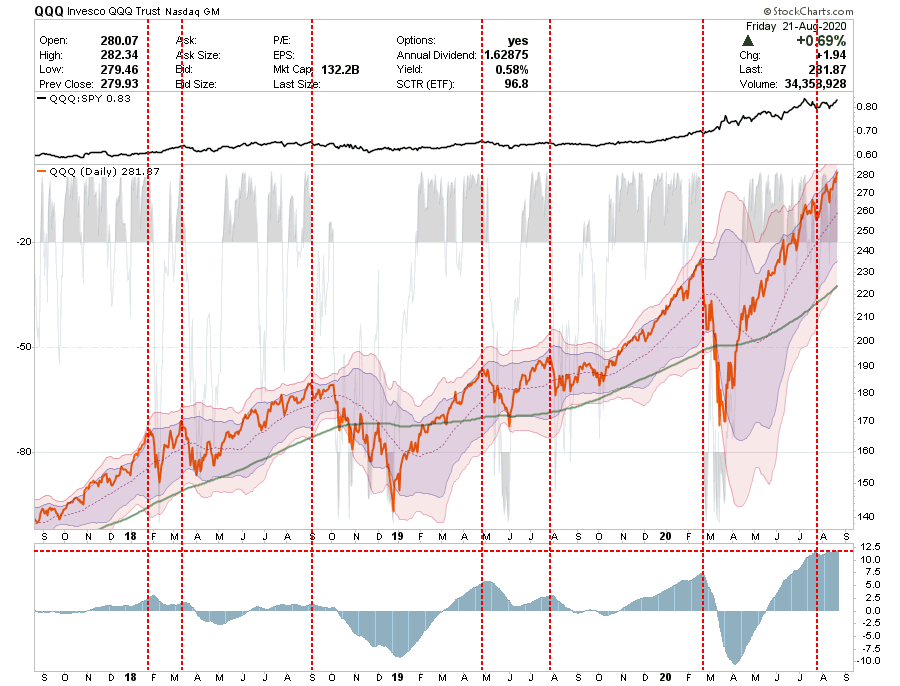
- QQQ’s outperformance of SPY turned up a bit last week as expected.
- The QQQ’s remain massively overbought, the buy signal is extremely extended, and QQQ is still pushing up towards 3-standard deviations above the 200-dma. That extension will not last forever.
- As noted with SPY, we are beginning to take profits and rebalance as needed.
- Short-Term Positioning: Bearish – Extension above 200-dma.
- Last Week: No changes this week.
- This Week: Taking profits. Check portfolio commentary on the dash board.
- Stop-loss moved up to $240
- Long-Term Positioning: Bullish
S&P 600 Index (Small-Cap)

- Small-caps finally broke above the 200-dma and are now historically overbought and 3-standard deviations above the mean.
- The rally failed this past week after pushing into extreme overbought territory.
- With small-caps very susceptible to weak economic growth, we are still avoiding this area of the market.
- Support is critical at the $62 level.
- Short-Term Positioning: Bearish – Market Risk Is High
- Last Week: No positions
- This Week: No positions.
- Stop-loss reset at $62
- Long-Term Positioning: Bearish
S&P 400 Index (Mid-Cap)

- The relative performance remains poor as with SLY. However, MDY also broke above the 200-dma resistance and failed at the 3-standard deviation level.
- We are also avoiding mid-caps for the time being until relative performance improves.
- The $330 stop-loss remains. Use this rally to reduce if needed.
- Short-Term Positioning: Bearish
- Last Week: No holding
- This Week: No holding
- Stop Loss reset at $330
- Long-Term Positioning: Bearish
Emerging Markets
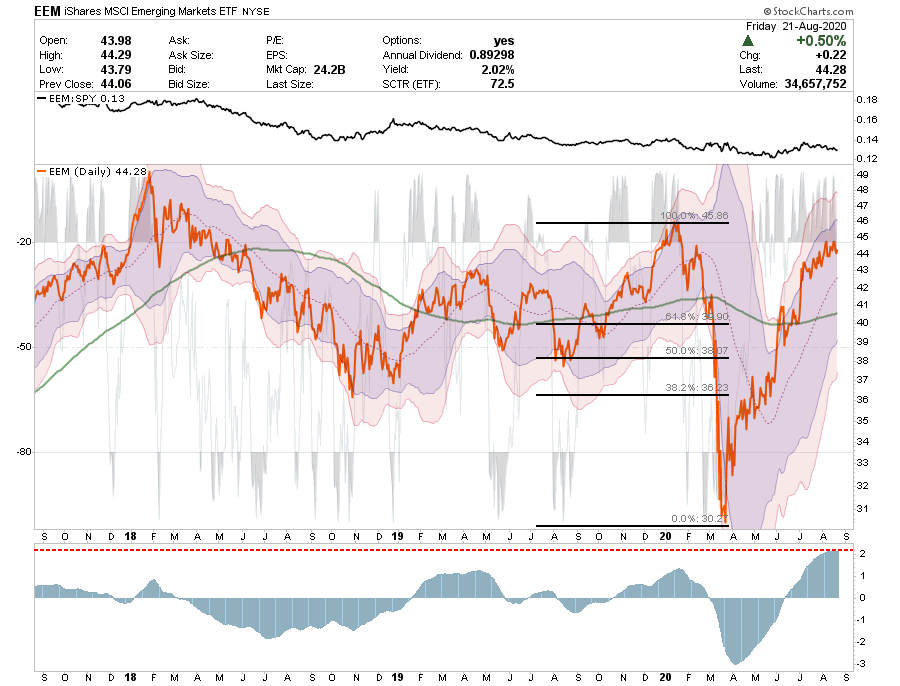
- Emerging markets have performed better on a relative basis but are now extremely extended. As with all other markets, the buy signal is at the highest level on record.
- Look for a correction that does not violate the 200-dma to add a trading position. Target is $41.
- The dollar decline, responsible for EEM performance, is well overdone. Look for a counter-trend rally which will push EEM lower.
- Short-Term Positioning: Bullish
- Last Week: No position
- This Week: No position.
- Stop-loss remains at $40 for trading positions.
- Long-Term Positioning: Bearish
International Markets
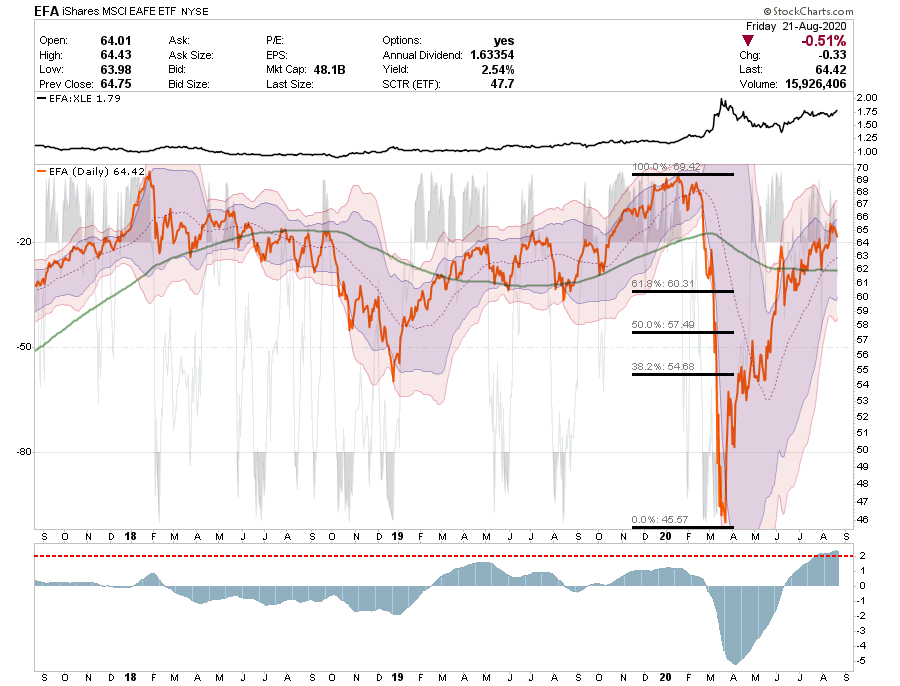
- EFA was holding up better. It will be important for EFA to hold support at the 200-dma, but the overbought condition puts this at risk.
- The dollar is extremely oversold, so a rally in the dollar could impact the EFA.
- As with EEM, EFA is dollar sensitive, so we also added a dollar hedge.
- Short-Term Positioning: Bearish
- Last Week: Sold position in EFA.
- This Week: No position.
- Stop-loss set at $62
- Long-Term Positioning: Bearish
West Texas Intermediate Crude (Oil)
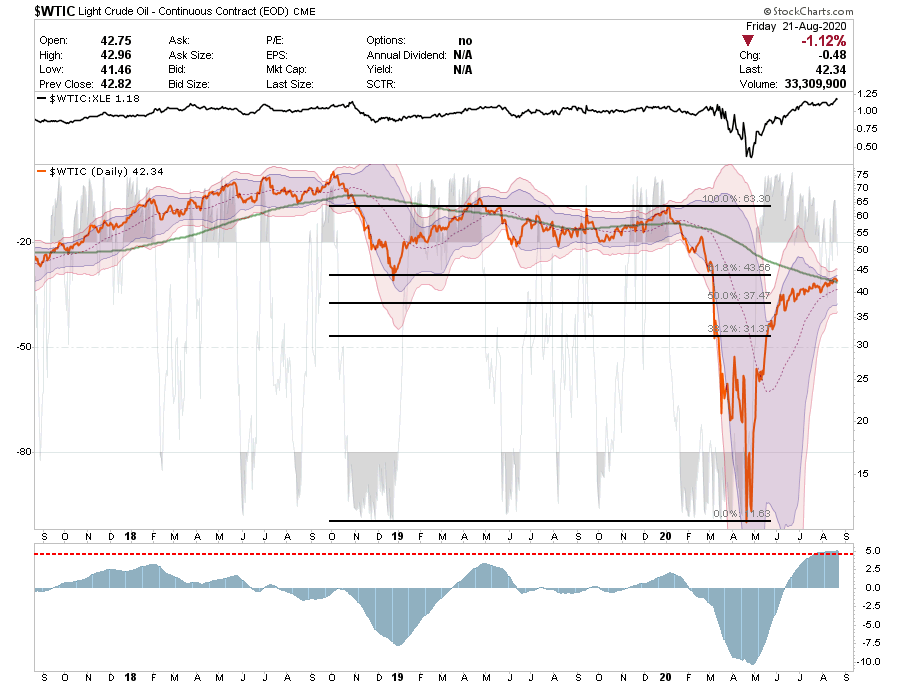
- Oil prices are struggling to move higher and are running into the 200-dma resistance.
- We suggested last: “Look for a correction to reverse some of the extreme overbought.” That correction hasn’t occurred yet. But it doesn’t mean it won’t.
- Note the narrowness of the Bollinger Bands. That compression will widen either as oil prices SURGE higher or collapse lower. Pay attention to the risk.
- Oil is also subject to a reversal in the dollar, another reason we are adding a dollar hedge.
- Oil should hold support between $30 and $35 and we will look to increase our holdings on pullbacks.
- Short-Term Positioning: Bearish
- Last Week: Hold positions
- This Week: Hold positions
- Stop for trading positions at $32.50
- Long-Term Positioning: Bearish
Gold
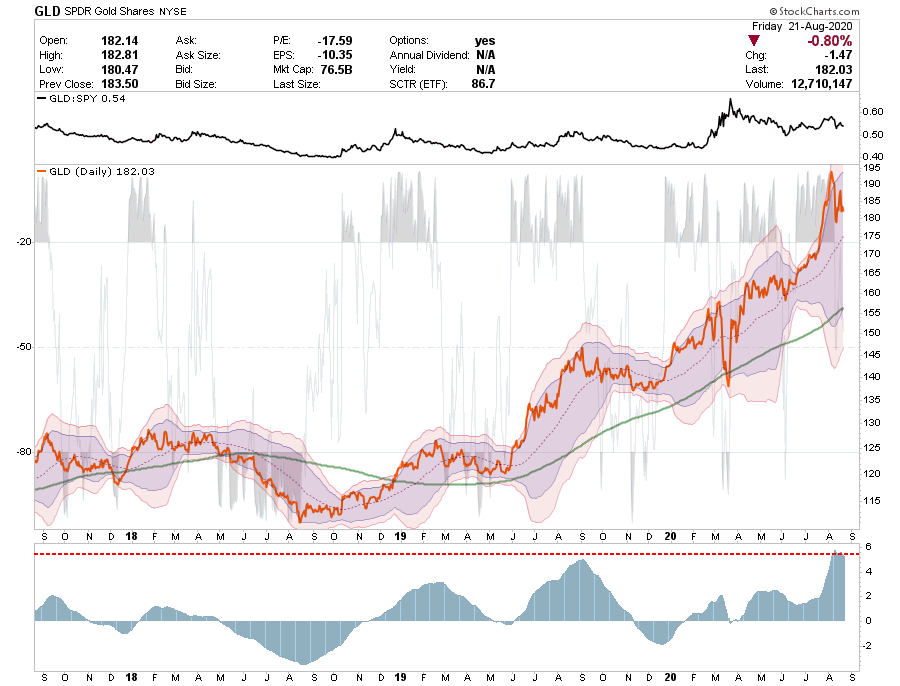
- We remain long in our current position in IAU but did take some profits previously due to the risk of a counter-trend rally in the dollar.
- We had also noted that Gold was extremely overbought and starting to push 4-standard deviations above the 200-dma.
- We suggest taking some profits now and look for a pullback to increase our sizing.
- That pullback continued this past week. There is a bit more to go, but we did start buying some Goldminers (GDX) and will add to Gold closer to $175
- We believe downside risk is fairly limited, but as always maintain stops.
- Short-Term Positioning: Bullish
- Last week: Hold positions.
- This week: Hold positions
- Stop-loss moved up to $165
- Long-Term Positioning: Bullish
Bonds (Inverse Of Interest Rates)
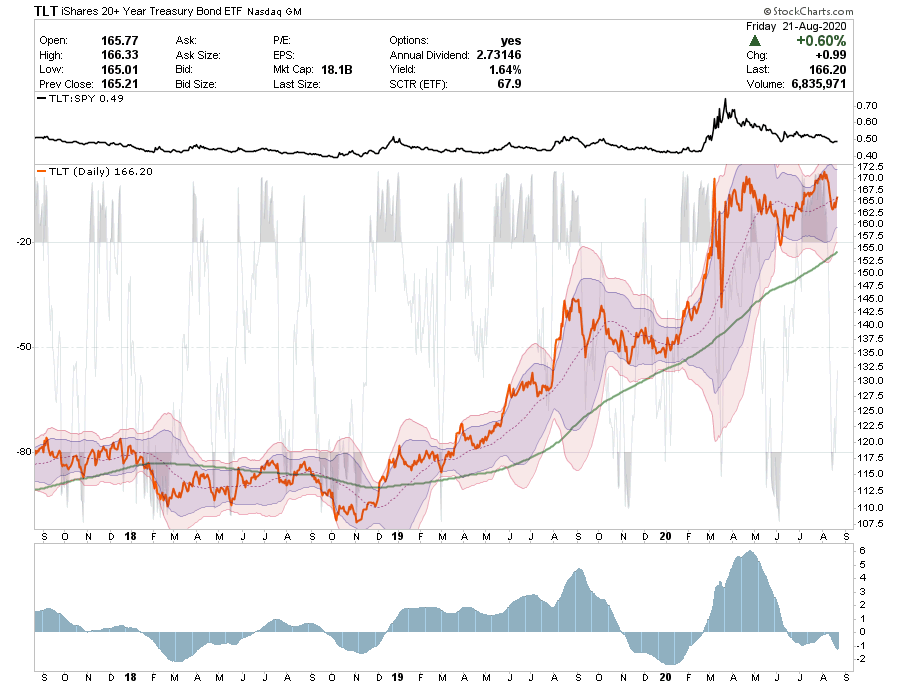
- We noted last week that “the correction in bonds occurred last week, and on Friday we used the dip to add to our TLT position.”
- There is still upside potential in bonds if there is a dollar rally or a correction in equities as we move into August.
- Short-Term Positioning: Neutral
- Last Week: Increased TLT from 12.5% to 15% of the portfolio.
- This Week: Hold positions.
- Stop-loss moved up to $155
- Long-Term Positioning: Bullish
U.S. Dollar
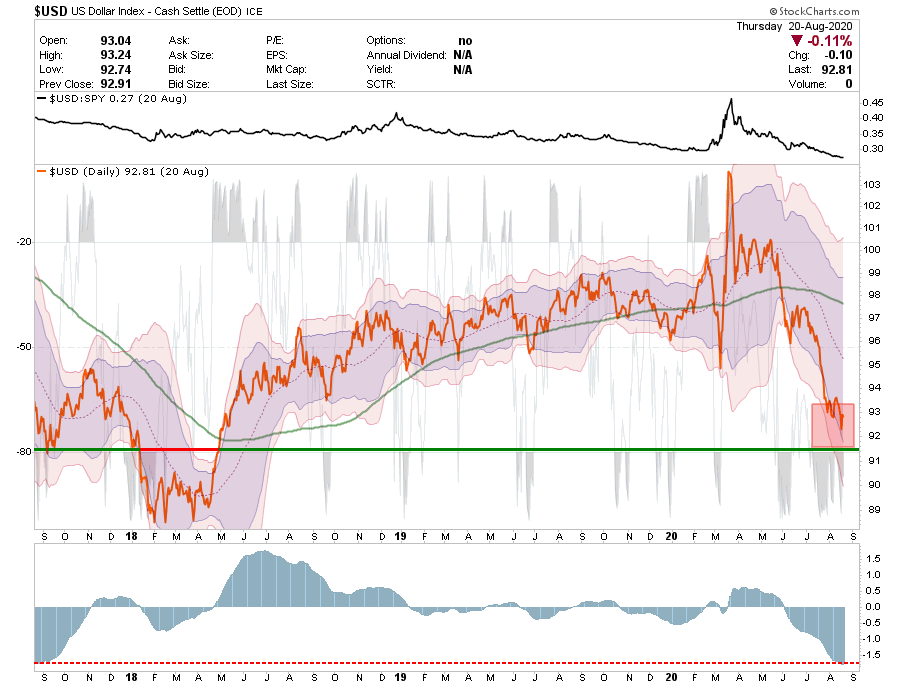
- The dollar continues to hold support for now but is extremely oversold.
- Given a large number of analysts with “bearish” forecasts on the dollar, the probability of a dollar rally has risen. We have started building a trading position for such a counter-rally and to hedge our international, energy, and gold holdings. We added to that position this week.
- Trading positions can be added to hedge portfolios but there is not likely a huge move available currently given the current market dynamics.
- Stop-loss adjusted to $92.


Lance Roberts is a Chief Portfolio Strategist/Economist for RIA Advisors. He is also the host of “The Lance Roberts Podcast” and Chief Editor of the “Real Investment Advice” website and author of “Real Investment Daily” blog and “Real Investment Report“. Follow Lance on Facebook, Twitter, Linked-In and YouTube
Customer Relationship Summary (Form CRS)
Also Read


