HOW TO READ THE CHARTS
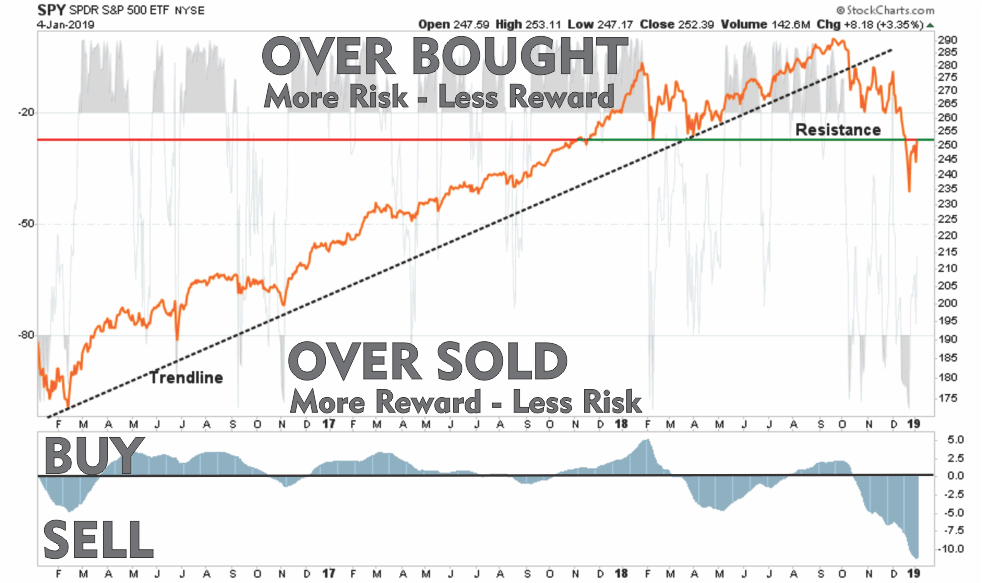
There are three primary components to each chart:
- The price chart is in orange
- The Over Bought/Over Sold indicator is in gray
- The Buy / Sell indicator is in blue.
When the gray indicator is at the TOP of the chart, there is typically more risk and less reward available at the current time. In other words, the best time to BUY is when the short-term condition is over-sold. Likewise when the buy/sell indicator is above the ZERO line investments have a tendency of working better than when below the zero line.
With this basic tutorial let’s review the major markets.
S&P 500 Index
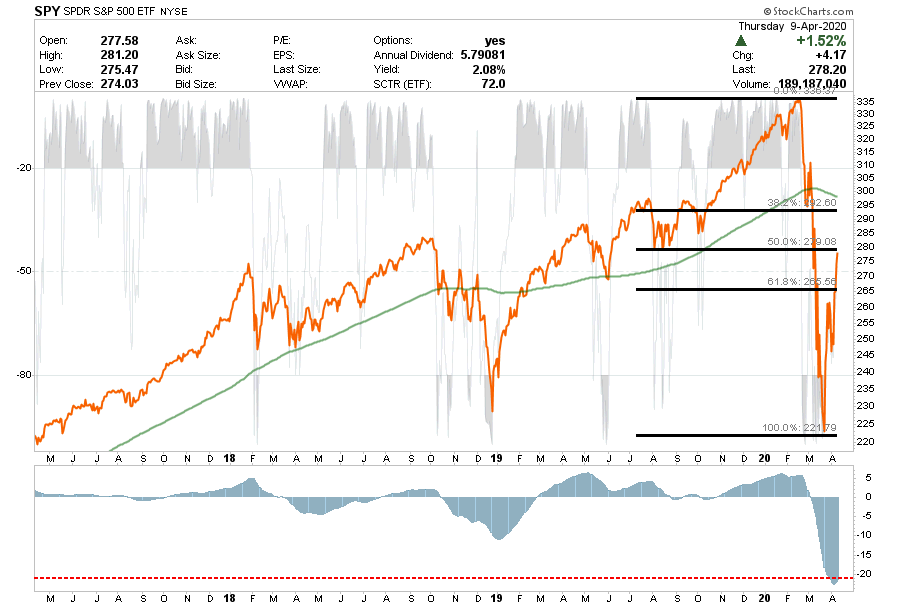
- Previously we wrote: “Well, that bounce finally came and it was as vicious as we expected. While this remains a “bear market” rally, the media was quick to jump on the “Bear market is over” bandwagon. It isn’t, and investors will likely pay a dear price in April.”
- This past week, the market was able to muster a rally to the 50% retracement level, and on many short-term fronts is extremely overbought. While a retest, and potential break of the March lows is likely, the market does have some lift short-term.
- Despite the Fed flooding money into the system, we could be set up for some very volatile moves as the economic data is about to become horrific, and earnings estimates will be revised sharply lower.
- Remain cautious for now.
- Short-Term Positioning: Bearish – Market Risk Is High
- Last Week: No core position
- This Week: No core position
- Stop-loss moved up to $245
- Long-Term Positioning: Bearish
Dow Jones Industrial Average
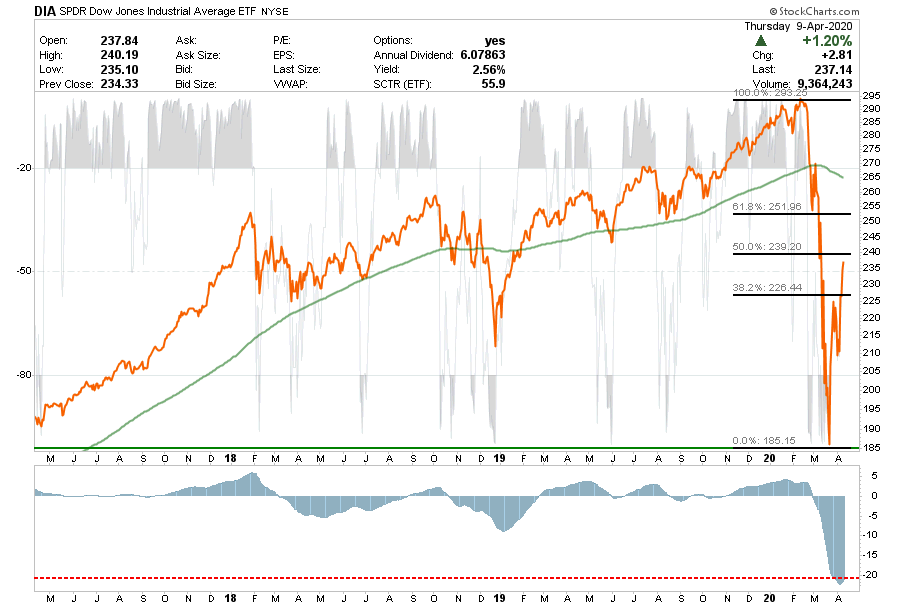
- The same situation exists with DIA.
- The bounce we discussed previously retraced to the 50% retracement level. We could see some positive action on Monday, but we remain firmly entrenched in a bear market for now.
- Short-Term Positioning: Bearish – Market Risk Is High
- Last Week: No positions
- This Week: No positions.
- Stop-loss moved up to $210
- Long-Term Positioning: Bearish
Nasdaq Composite
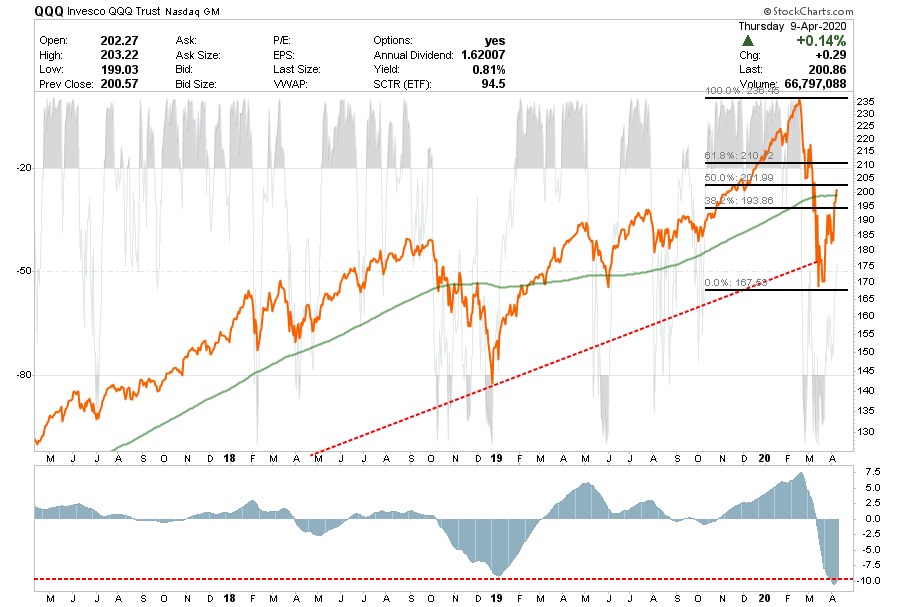
- We had previously put on a small QQQ trade for a reflexive rally, but we closed that out.
- As with SPY and DIA, the QQQ has established a downtrend, but technically is in MUCH better shape than the other markets with the bull-trend still intact.
- Short-Term Positioning: Bearish – Market Risk Is High
- Last Week: No positions
- This Week: No positions
- Stop-loss moved up to $180
- Long-Term Positioning: Bearish due to valuations
S&P 600 Index (Small-Cap)
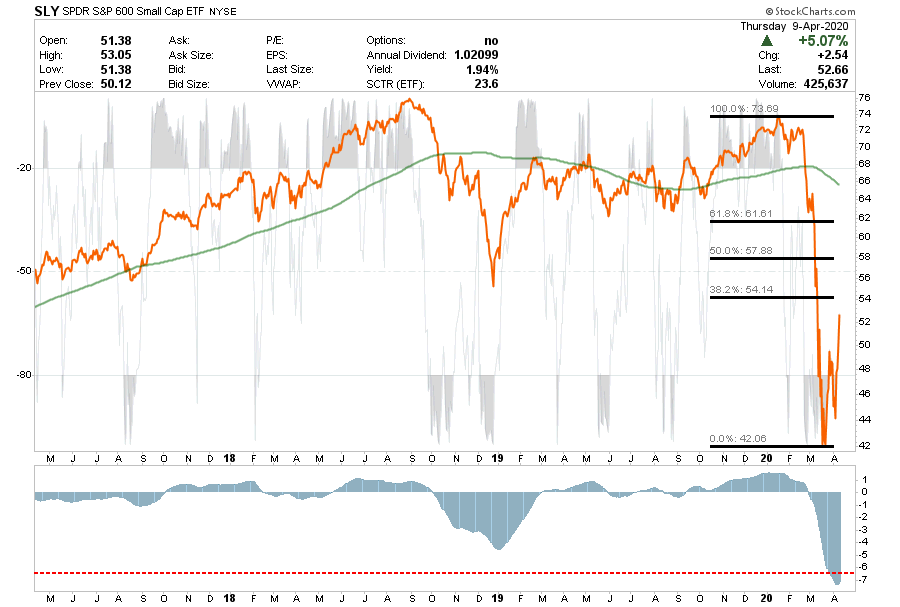
- Small-caps are no place to be as both small and mid-cap companies are going to be hardest hit by the virus.
- Be careful what you own, there are going to be quite a few companies that don’t make it.
- Avoid small-caps. Use last week’s rally to clear positions for now.
- Short-Term Positioning: Bearish – Market Risk Is High
- Last Week: No positions
- This Week: No positions.
- Stop loss adjusted to $44 on trading positions.
- Long-Term Positioning: Bearish
S&P 400 Index (Mid-Cap)
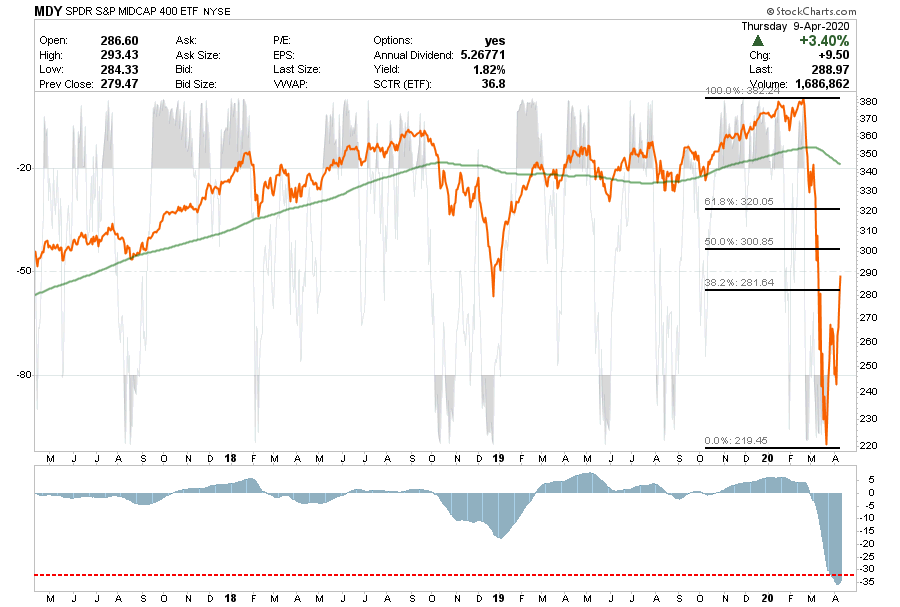
- As with Small-cap, we have no holdings. Use last week’s rally to sell positions.
- Short-Term Positioning: Bearish – Market Risk Is High
- Last Week: No holding
- This Week: No holding
- Stop Loss moved up to $245 for trading positions.
- Long-Term Positioning: Bearish
Emerging Markets

- As with small and mid-cap stocks, emerging and international markets are being hit hard by the virus. Economically, these countries are being destroyed right now.
- We previously stated that investors should use counter-trend rallies to sell into. If you haven’t done so, use last week’s rally to clear positions.
- Short-Term Positioning: Bearish – Market Risk Is High
- Last Week: No position
- This Week: No position.
- Stop-loss moved up to $33 for trading positions.
- Long-Term Positioning: Bearish
International Markets
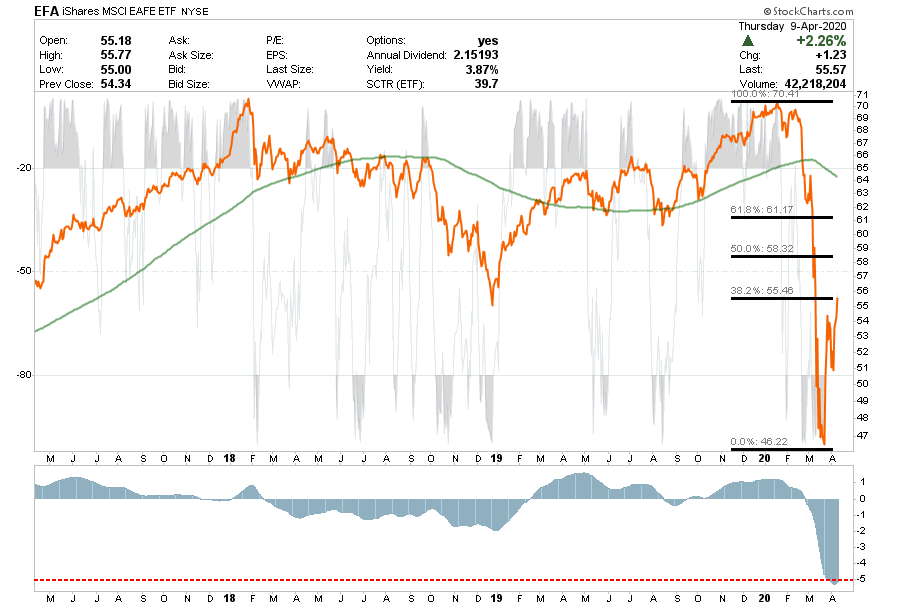
- As noted previously: “‘A reflexive rally is likely. Use those levels to sell into.”
- Use last week’s rally to sell holdings.
- Remain out of these markets for the time being.
- Short-Term Positioning: Bearish – Market Risk Is High
- Last Week: No position.
- This Week: No position.
- Stop-loss moved up to $51 for trading positions.
- Long-Term Positioning: Bearish
West Texas Intermediate Crude (Oil)
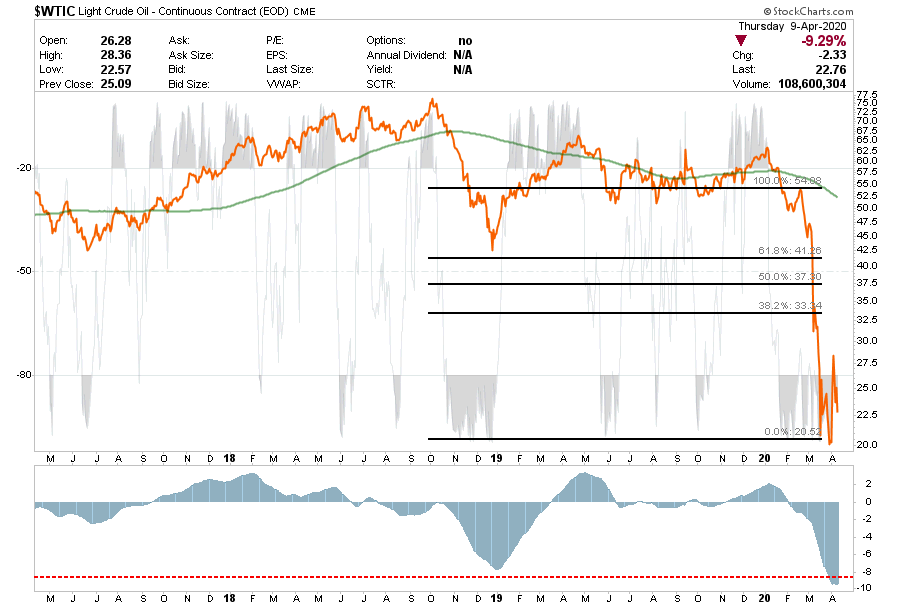
- As stated last week, “Saudi and Russia are NOT likely going to cut production meaningfully as they now have shale drillers in a stranglehold. They are going to talk a lot, but they aren’t going to do anything until they extinguish shale to some degree. For the last couple of years, I have warned this outcome would eventually occur.”
- Shockingly they did come to an agreement, but it may be too little ,too late and whose to say that member OPEC countries adhere to their commitments.
- We also stated to use the rally last week to clear positions in your portfolio for now stating:
- “We will very likely retest or set new lows in the coming months as drillers are forced to “shut in” production. At that point we can start picking through the ruble for portfolio positioning.”
- We still like the sector from a “value” perspective and expect that we will wind up making a lot of money here. We clearly aren’t at lows yet, so be patient.
- Avoid for now.
- Short-Term Positioning: Bearish
- Last Week: No positions
- This Week: No positions.
- Stops Triggered for any direct crude oil positions.
- Long-Term Positioning: Bearish
Gold
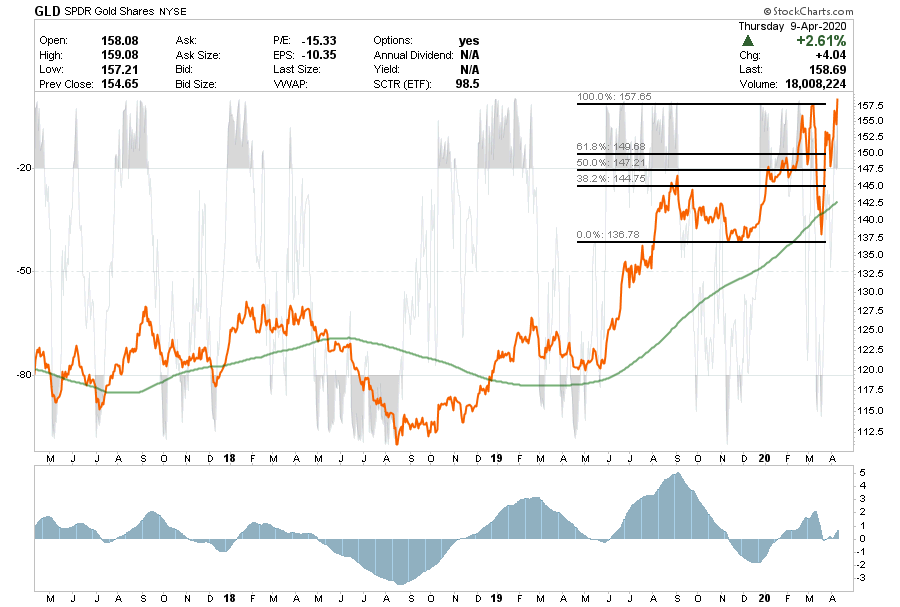
- We added to our positions in IAU and GDX last week as the Fed’s action are starting to raise the specter of rather serious inflation problems.
- Last week, Gold broke out to highs and brought the “buy signal” back online.
- Gold is a little overbought short-term so use pullbacks to support to add further holdings.
- Short-Term Positioning: Bullish
- Last week: Hold positions.
- This week: Hold positions.
- Stop-loss moved up to $142.50
- Long-Term Positioning: Bullish
Bonds (Inverse Of Interest Rates)
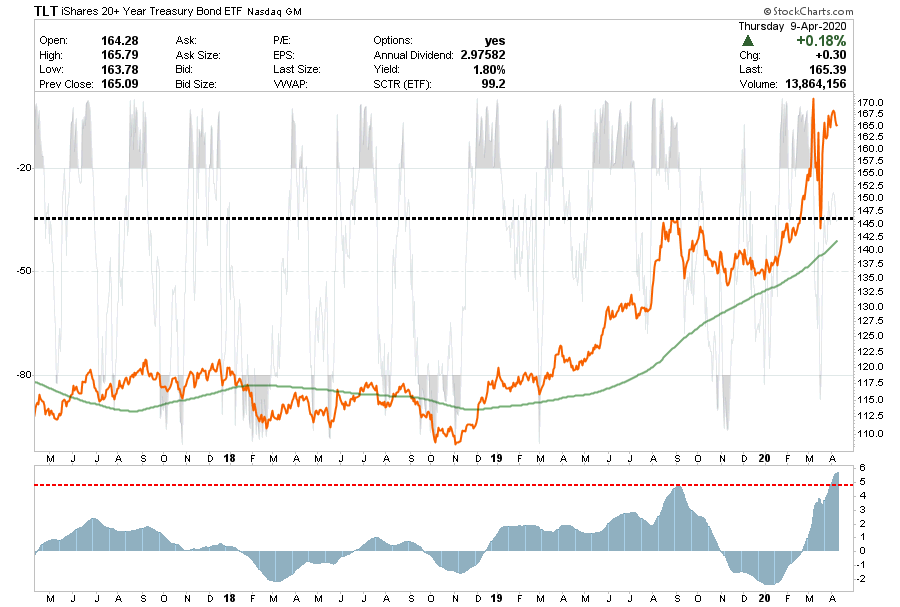
- We have reduced our overall bond exposure, because we are running a very reduced equity exposure currently. This aligns our “hedge” of fixed income relative to our equity book.
- However, bonds are now MORE overbought that at just about any other point in history which suggests we could see a tick up in rates and a fall in bond prices. (Such will provide a good opportunity to add bond exposure to portfolios.)
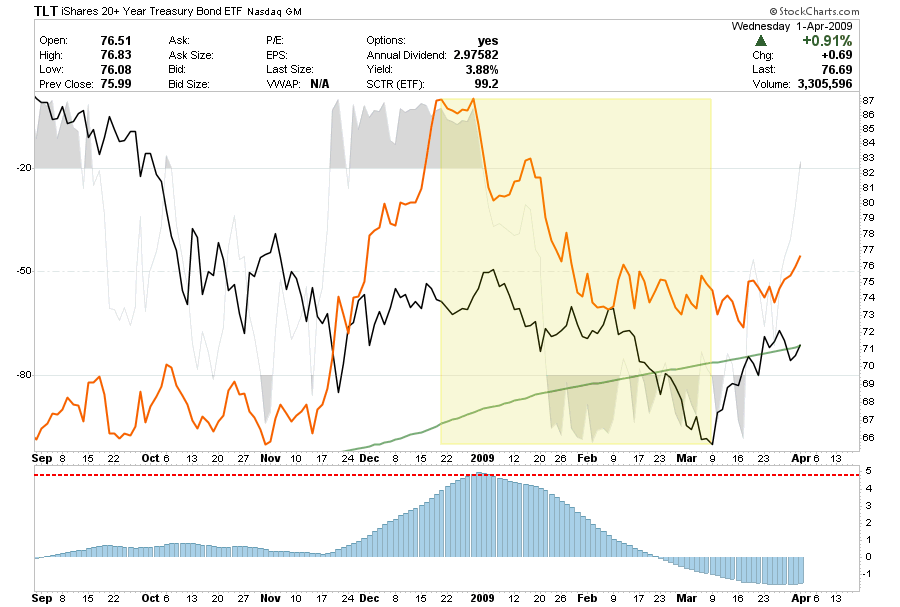
- Normally, such a reversion would coincide with a “risk on” trade into equities. However, given the economic devastation coming, we need to look back at 2008. In November of 2008, the Fed hit the markets with QE which caused bonds and stocks to rise in unison. However, shortly thereafter, both declined sharply in price as economic realities came to the fore.
- Short-Term Positioning: Neutral
- Last Week: Hold positions
- This Week: Take Profits and rebalance holdings as needed.
- Stop-loss is $147.50
- Long-Term Positioning: Bullish
U.S. Dollar

- The dollar fell sharply as we had a reflexive “bear market” rally. However, with concerns over the deteriorating global economy and the demand for dollars from abroad, money is flowing back into the dollar for safety.
- The recent volatility of the dollar makes it hard to trade for now, so be patient for the moment and let things calm down. We may look to add a long-dollar trade on a pull back to the $98-99 areas.
- The dollar is on a strong “buy signal” and is NOT “overbought,” which suggests dollar strength may be with us for a while longer.


Lance Roberts is a Chief Portfolio Strategist/Economist for RIA Advisors. He is also the host of “The Lance Roberts Podcast” and Chief Editor of the “Real Investment Advice” website and author of “Real Investment Daily” blog and “Real Investment Report“. Follow Lance on Facebook, Twitter, Linked-In and YouTube
Customer Relationship Summary (Form CRS)
Also Read