


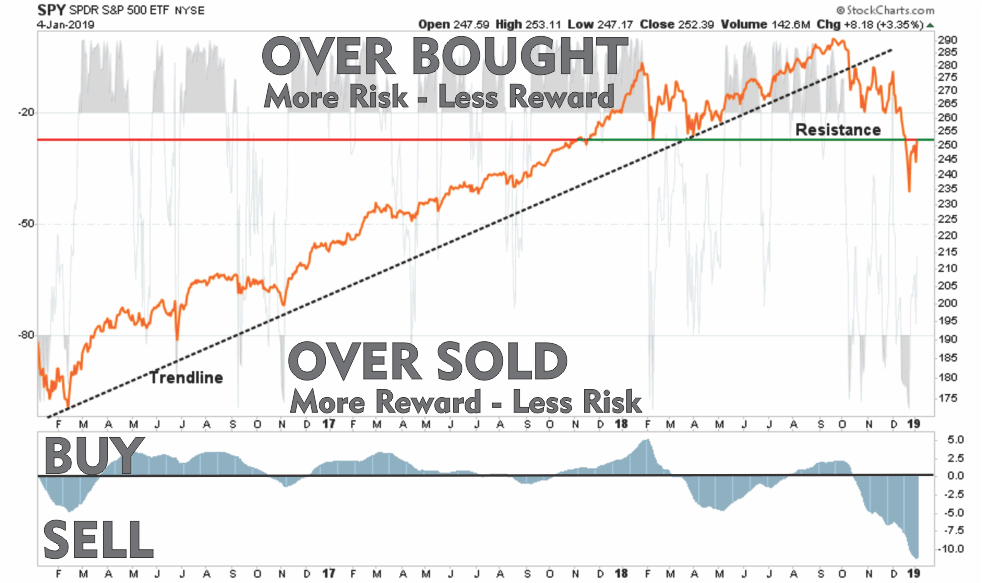
HOW TO READ THE CHARTS
There are three primary components to each chart:
- The price chart is in orange
- The Over Bought/Over Sold indicator is in gray
- The Buy / Sell indicator is in blue.
When the gray indicator is at the TOP of the chart, there is typically more risk and less reward available at the current time. In other words, the best time to BUY is when the short-term condition is over-sold. Likewise when the buy/sell indicator is above the ZERO line investments have a tendency of working better than when below the zero line.
With this basic tutorial let’s review the major markets.
This commentary was written over the weekend prior to the Fed’s Sunday action.
This week I am leaving LAST WEEK’S charts ABOVE this week’s charts so you can realize the magnitude of the moves last week. This is important to keep “perspective” on current allocations and expectations.
S&P 500 Index
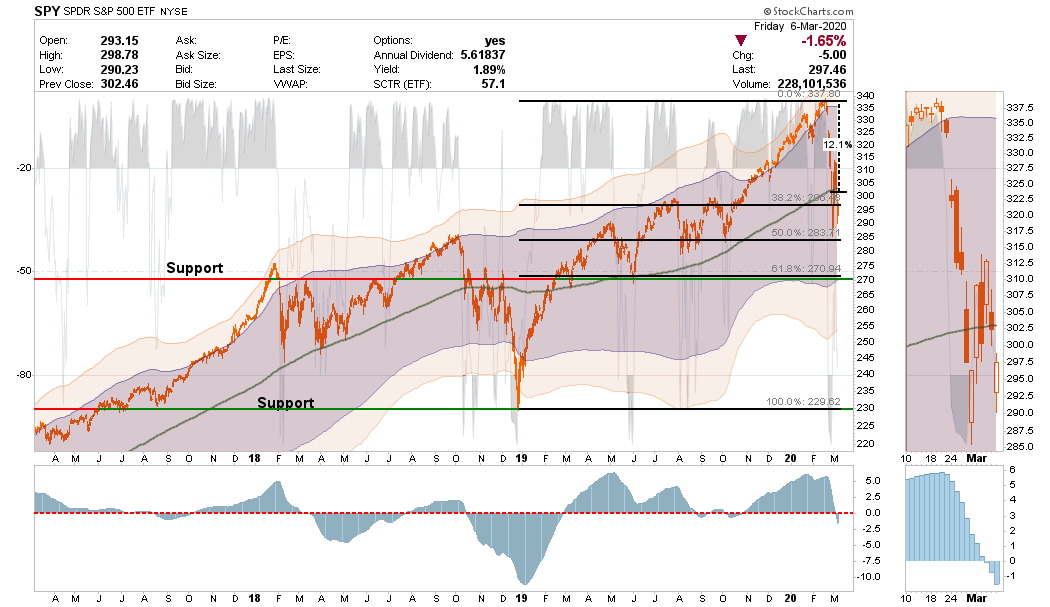
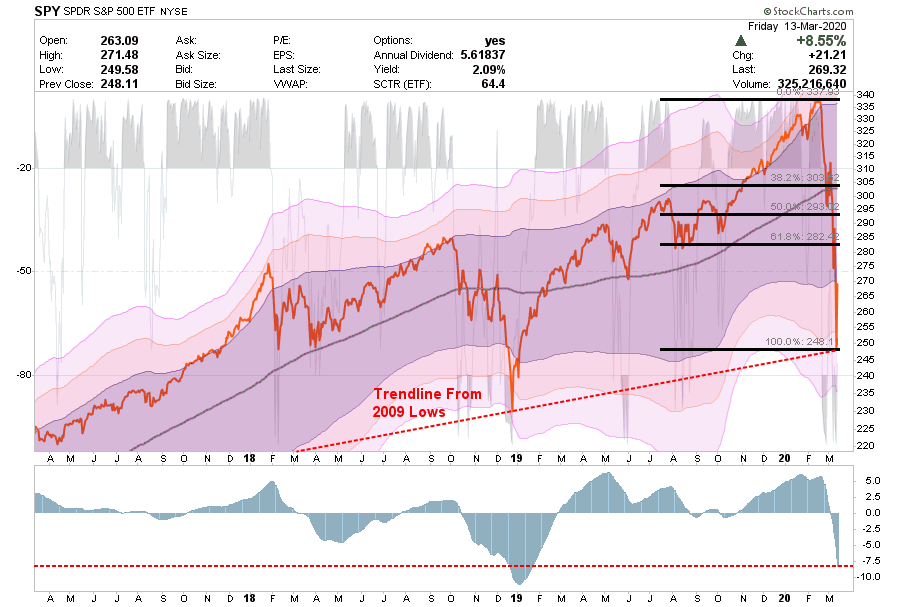
- Last week: “Warning: SPY has triggered a longer-term “sell” signal which historically coincides with deeper declines. We highly suspect that any rally will ultimately fail and we will test the 62.8% retracement level.
- With the market now 3-standard deviations oversold, a bounce is likely next week as it is expected the Fed will cut rates and restart a substantial QE program. A retracement to the 31.8%, 50%, 62.8% levels are possible and each level should be used to reduce equity risk and hedge.
- We are going to have a retest of lows before this over.
- Short-Term Positioning: Bearish – Market Risk Is High
- Last Week: Hold position
- This Week: Hold positions
- Stop-loss set at $250
- Long-Term Positioning: Bearish
Dow Jones Industrial Average

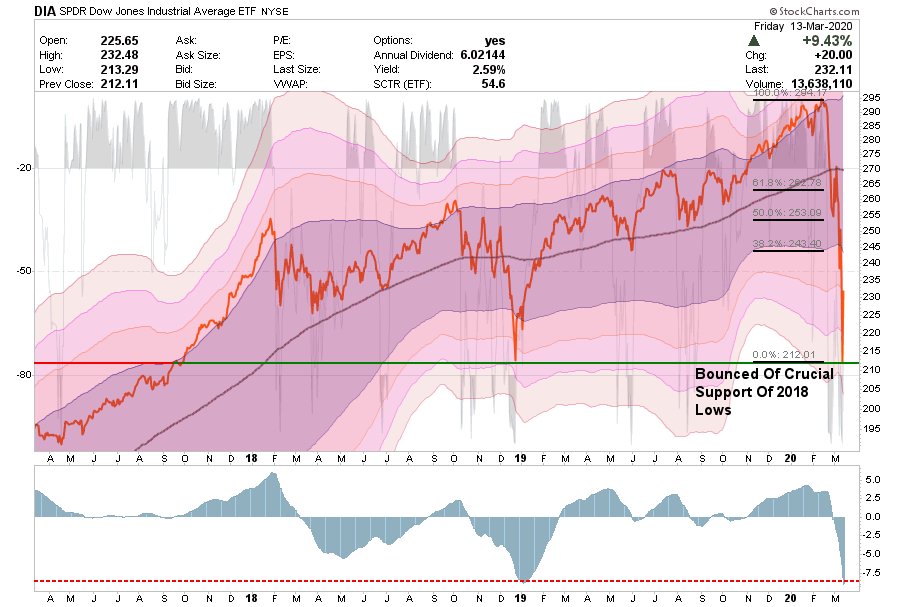
- The same situation exists with DIA.
- Now back to extreme oversold, trading positions can be added for a counter-trend bounce back to resistance at $240-265.
- DIA is on a very deep “Sell signal” so rallies will most likely fail in the weeks ahead.
- Short-Term Positioning: Bearish – Market Risk Is High
- Last Week: Hold current positions
- This Week: Trading positions for rally only.
- Stop-loss set at $210
- Long-Term Positioning: Bearish
Nasdaq Composite
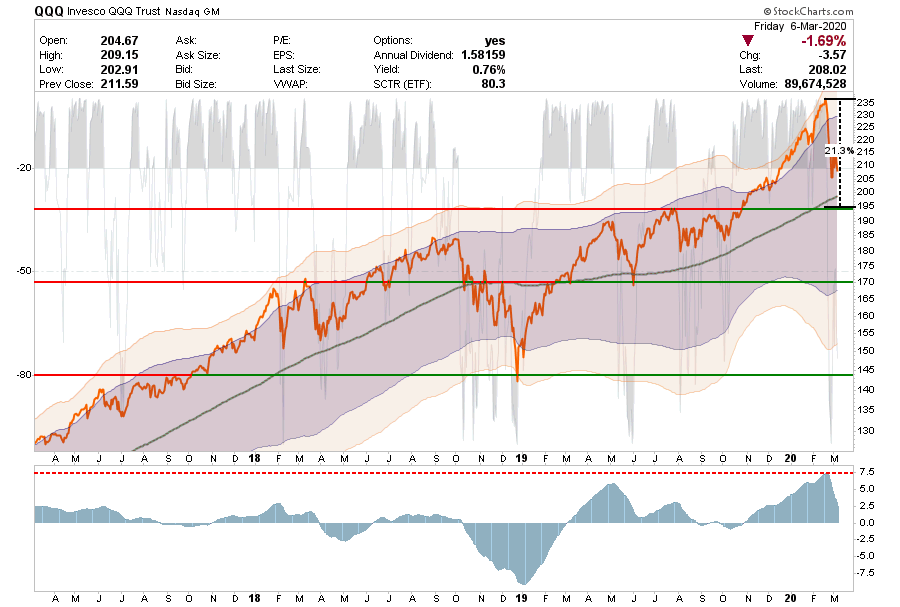
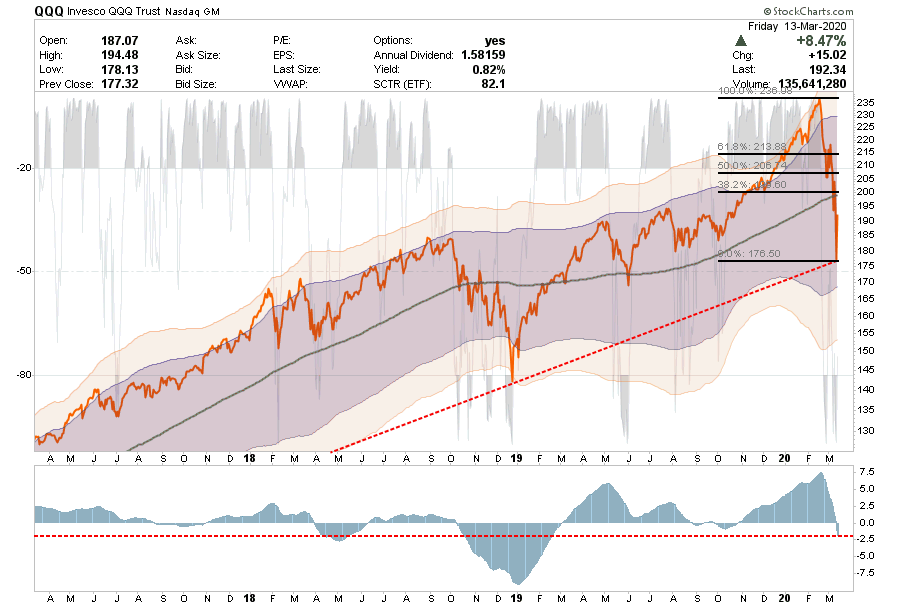
- Despite the correction last week, the QQQ is the best looking index from a trading perspective. QQQ tested and held its bullish trend line, but has now registered a “sell signal.” This suggests that rallies will likely fail for the time being.
- The the index is very oversold, so look for a reflexive rallies back to $200, which coincides with the 200-dma, or $207 to $215 (which is optimistic.) to reduce exposure and take profits on trading positions.
- Trading position in QQQ for a reflexive rally back to the 200-dma which resides at $200
- Short-Term Positioning: Bearish – Market Risk Is High
- Last Week: Hold position
- This Week: Hold position
- Stop-loss set at $175
- Long-Term Positioning: Bearish due to valuations
S&P 600 Index (Small-Cap)
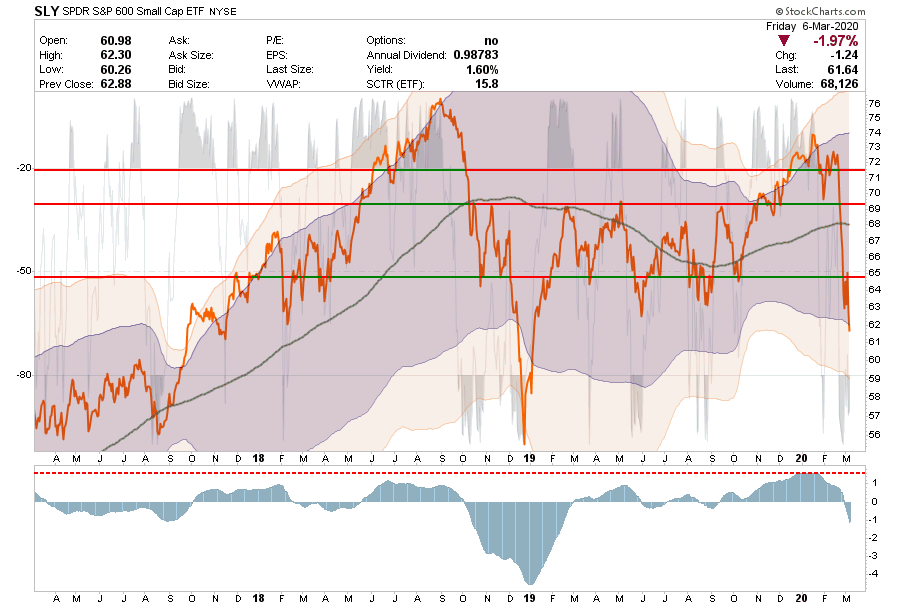
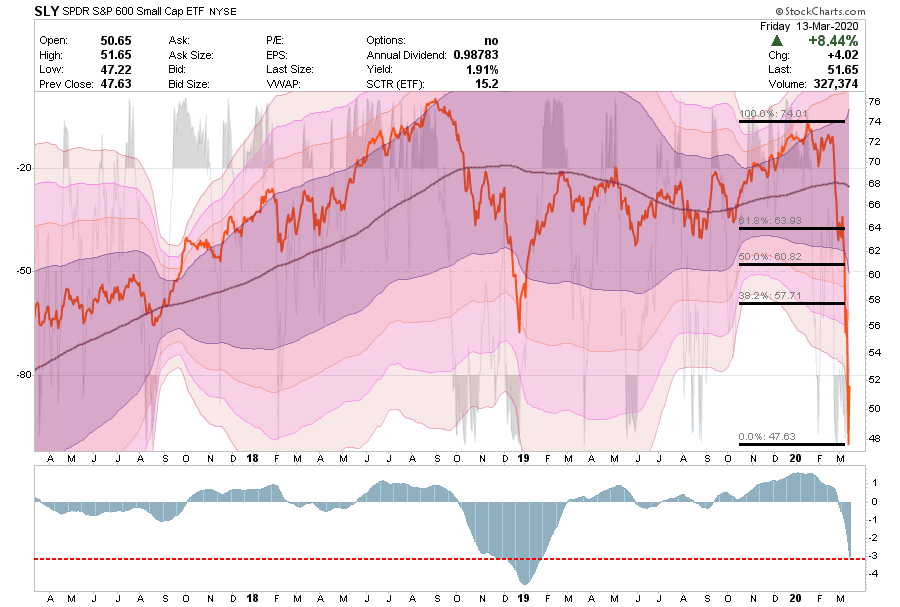
- As noted in our portfolio commentary, we sold our small-cap positions 4-weeks ago.
- Small-caps are extremely oversold, and on a very deep “sell signal.”
- This particular group of stocks are the most susceptible to an economic slowdown from the virus. Use any reflexive rally to step-aside for the time being.
- You can deploy a trading position in small-caps for a bounce, but they are underperforming large cap, so I am not sure its worth the risk.
- Short-Term Positioning: Bearish – Market Risk Is High
- Last Week: No positions
- This Week: No positions.
- Stop loss adjusted to $48 on trading positions.
- Long-Term Positioning: Bearish
S&P 400 Index (Mid-Cap)

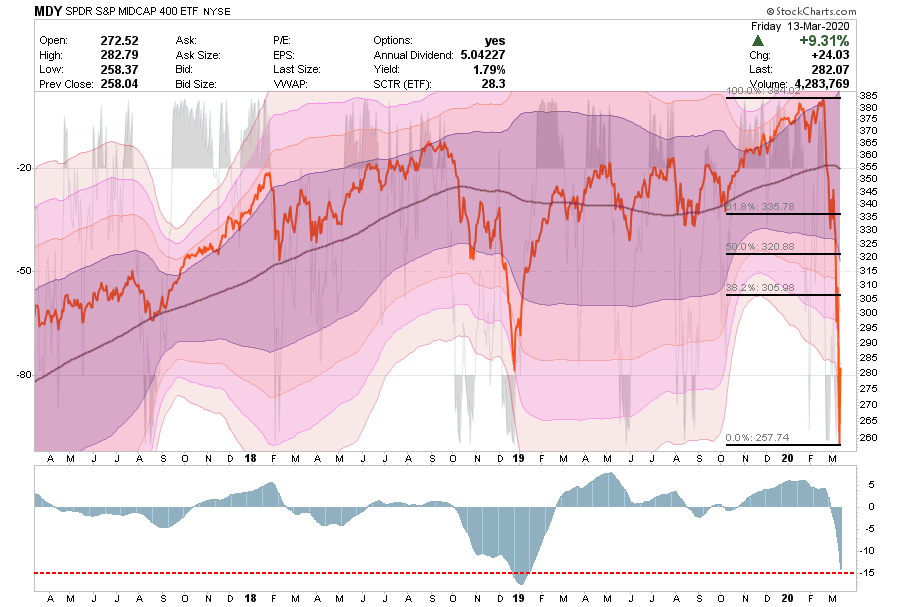
- As with Small-cap, we have no holdings.
- MDY is oversold, and is on a very deep a “sell signal.”
- MDY has broken all critical supports, and like SLY, there is no reason to “buy” the sector currently. However, MDY is oversold enough for a counter-trend bounce to sell into. Trading positions only.
- Short-Term Positioning: Bearish – Market Risk Is High
- Last Week: No holding
- This Week: No holding
- Long-Term Positioning: Bearish
Emerging Markets
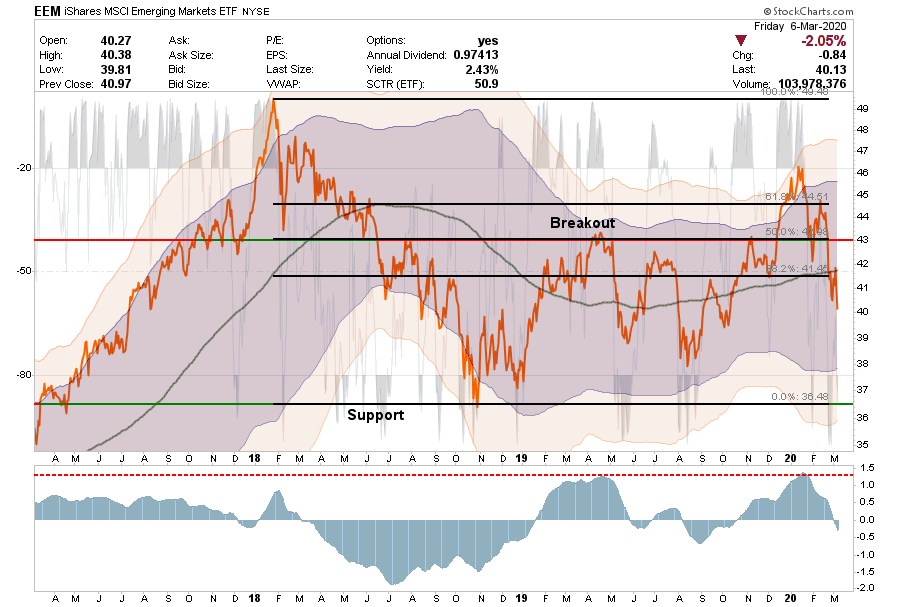
- Three weeks ago, we stated that “EEM failed at resistance and we sold our exposures to international holdings and return our focus on large cap value for now. EEM has completed a “head and shoulders” topping pattern and violated support at the 61.8% retracement level. EEM will eventually test previous lows particularly with a sell signal now registered.”
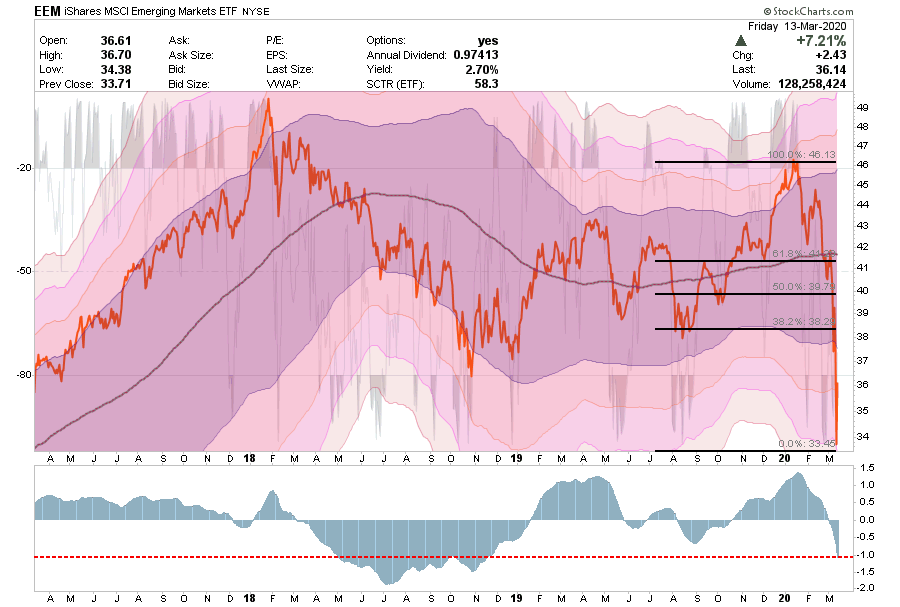
- EEM is very now extremely oversold and on a deep sell-signal.
- Use counter-trend rallies to sell into. Trading positions only.
- Short-Term Positioning: Bearish – Market Risk Is High
- Last Week: No position
- This Week: No position.
- Stop-loss set at $32 for trading positions.
- Long-Term Positioning: Bearish
International Markets
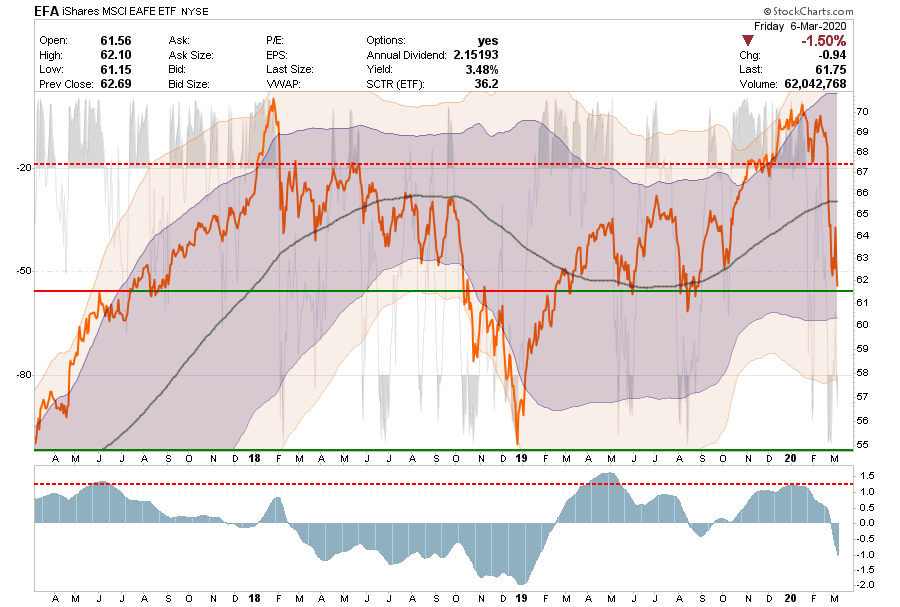
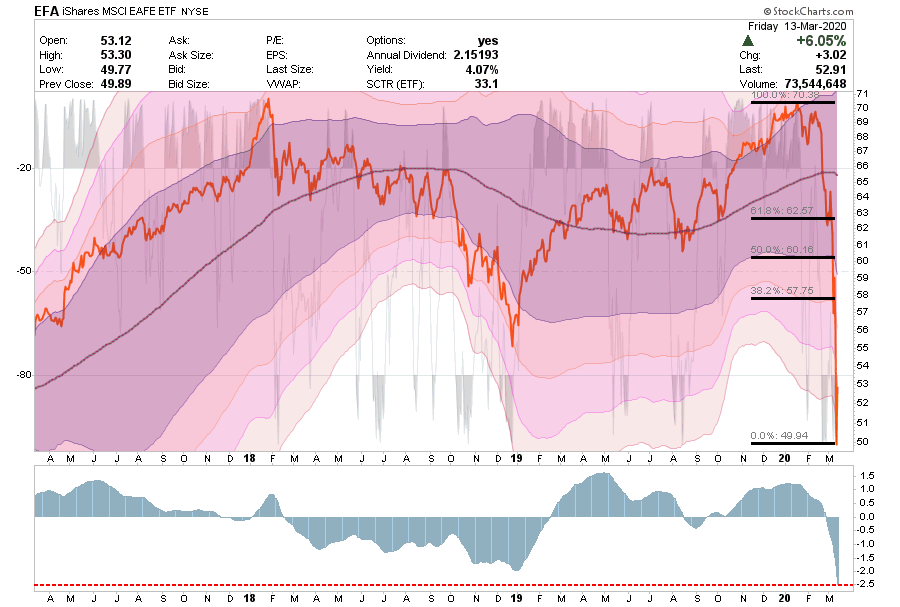
- Like EEM, EFA was also sold previously. as we return our focus back to large cap value.
- EFA is very sold and on a deep sell signal. A reflexive rally is likely back to $58 to 63 which doesn’t even get you back to the 200-dma. Use those levels to sell into.
- Short-Term Positioning: Bearish – Market Risk Is High
- Last Week: No position.
- This Week: No position.
- Stop-loss set at $50 for trading positions.
- Long-Term Positioning: Bearish
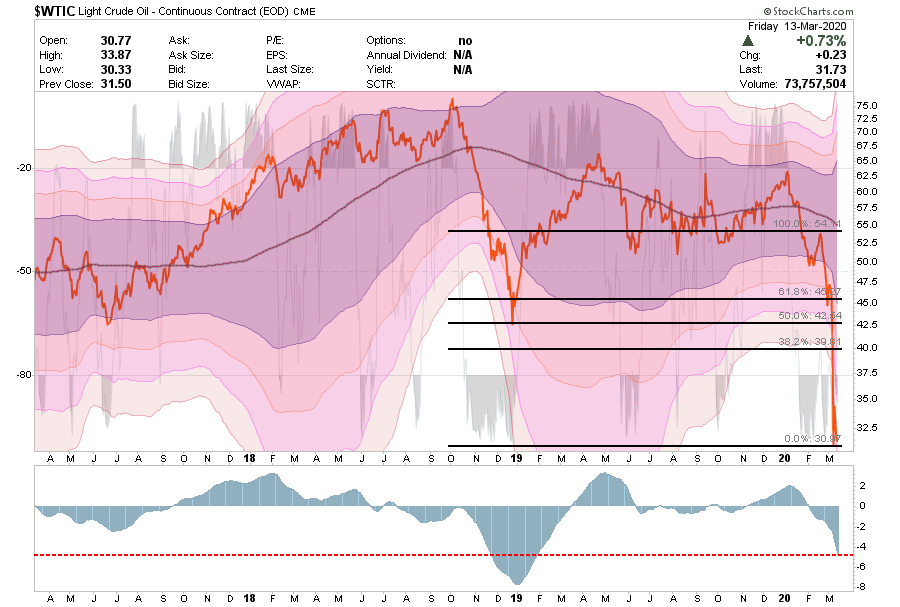
West Texas Intermediate Crude (Oil)
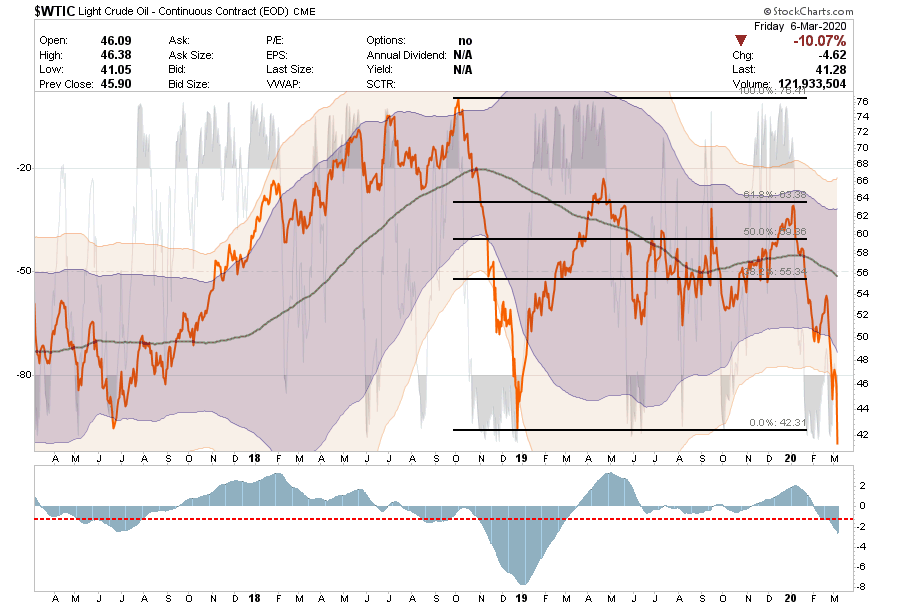
- Wow. After Russia failed to join OPEC+ in cutting production, and US drillers are producing more than current demand can offset, we said: “Drillers have to drill to make revenue to meet their debt obligations, so ultimately this is going to end very badly.”
- We just didn’t realize how bad it would get until Saudi Arabia decided to launch a price war, thankfully, we had recommended selling all energy holdings on the Friday before that announcement.
- We still like the sector from a “value” perspective and expect that we will wind up making a lot of money here. However, we were early, so we are going to step back and look for a better bottom to buy into. We aren’t there yet.
- Short-Term Positioning: Bearish
- Last Week: No positions
- This Week: No positions.
- Stops Triggered for any direct crude oil positions.
- Long-Term Positioning: Bearish
Gold

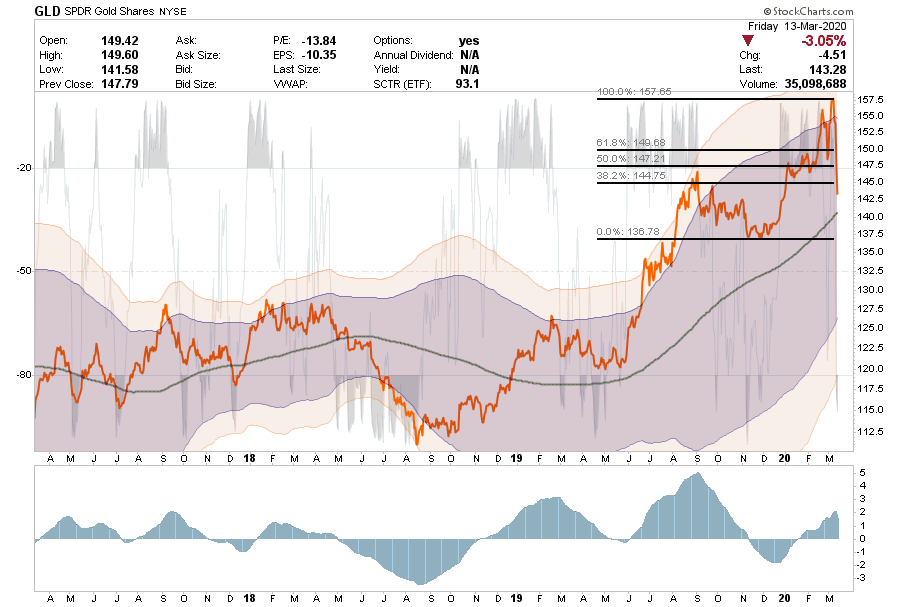
- Two weeks ago we stated: “Gold rallied sharply and broke out to new highs, suggesting there was something amiss with the stock market exuberance. The correction came this past week, confirming Gold’s message was correct.”
- Gold had been holding up well as a hedge until this past week where two hedge funds (we suspect Citadel and Millennium) blew up creating margin liquidation across all asset classes included gold, bonds, and even bitcoin.
- Fortunately, we previously sold our GDX position (people intensive) and with the liquidation event over we think Gold will return to its ability to hedge.
- We will look to add to our position this week if Gold can hold the $200 dma and our stop level at $137.50
- Short-Term Positioning: Bullish
- Last week: Hold positions.
- This week: Look to add at support of $140.
- Stop-loss set at $137.50.
- Long-Term Positioning: Bullish
Bonds (Inverse Of Interest Rates)

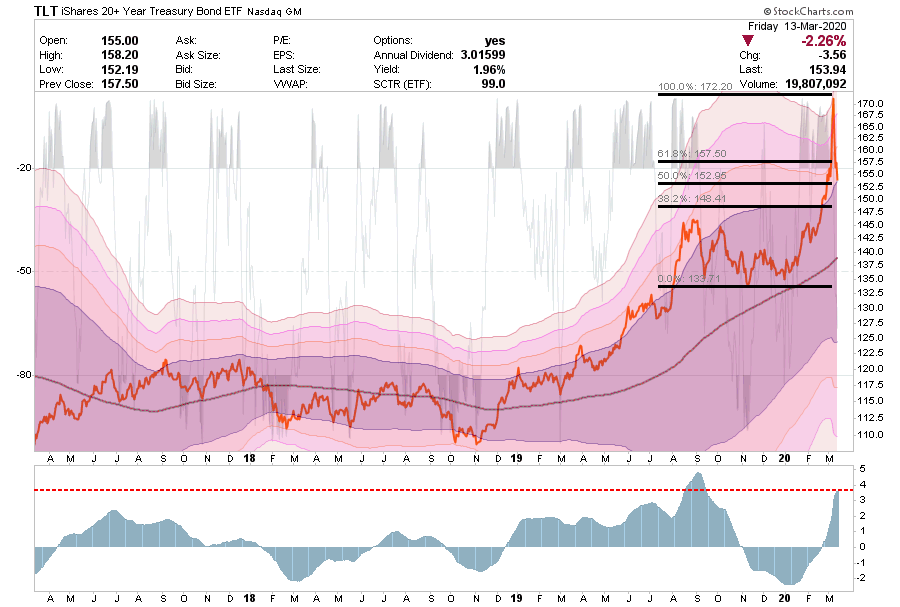
- As noted last week: “Carl Swenlin at Decision Point agrees with our view: ‘Price has accelerated into a parabolic advance, so we should be alert for a breakdown very soon. That doesn’t mean that we’ll see a complete collapse, but it is not likely that this vertical ascent will be maintained.’”
- We previously sold our small position in TLT, and this past week reduced our IEF position by 50% and increased BIL accordingly to shorten duration. The rest of our bond holdings have done the work of supporting the portfolio.
- The margin liquidation event is now bringing bonds back to a “buyable” range.
- As we noted last week: “We agree. Bonds are getting ‘stupid’ overbought which suggests there is plenty of ‘fuel’ for a pretty vicious ‘reflex rally’ in stocks. At 5-standard deviations you are going to see a reversal in rates back to $150-152 on TLT. This is will be your next entry point to buy bonds and sell stocks.”
- That positioning remains the same this week.
- Short-Term Positioning: Bullish
- Last Week: Hold positions
- This Week: Sold 1/2 of IEF, Added to BIL, looking to add TLT back to portfolios for trading.
- Stop-loss is moved up to $147.50
- Long-Term Positioning: Bullish
U.S. Dollar
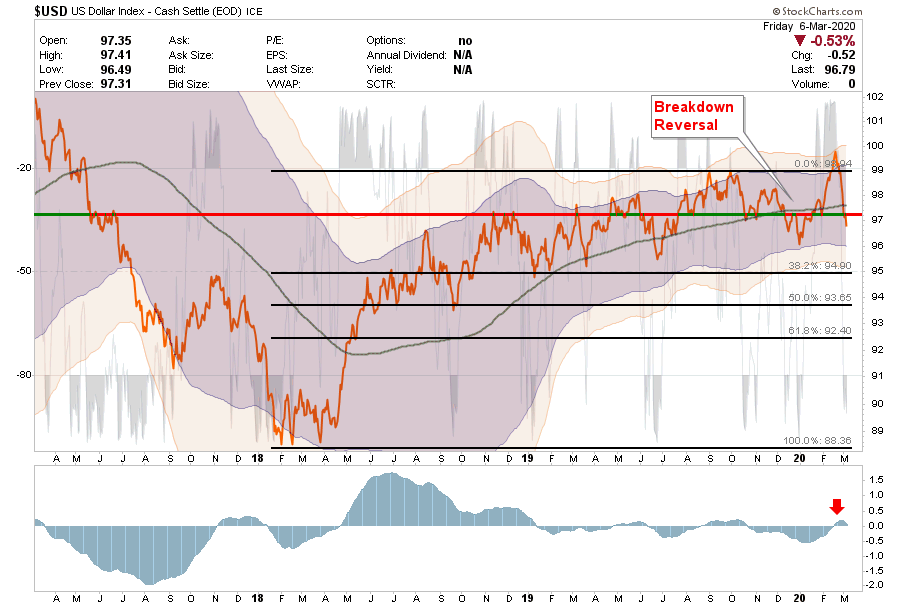
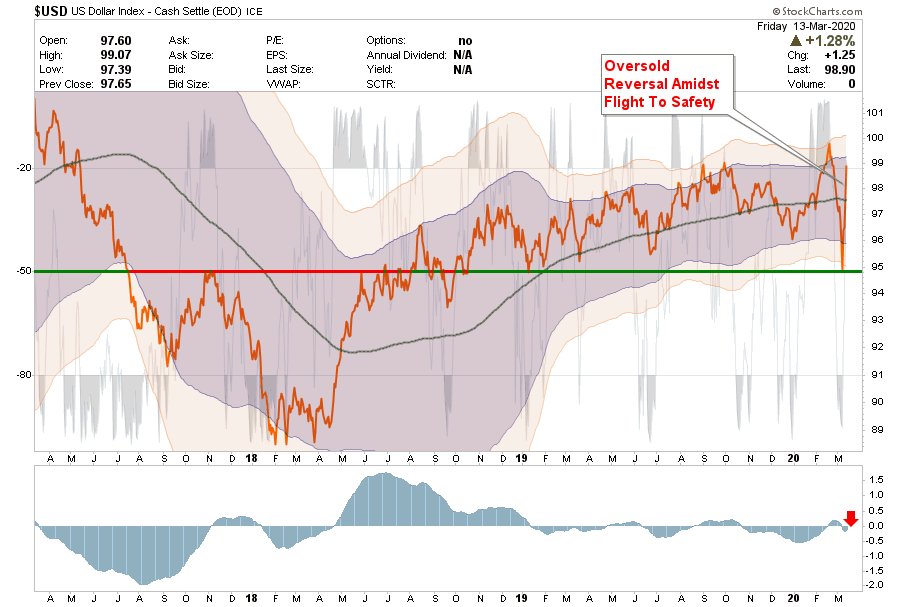
- It’s been a roller coaster for the US Dollar this past two weeks.
- Two weeks ago we stated: “This past week, the dollar surged through that resistance and is now extremely overbought short-term. Looking for a reflexive rally in stocks next week that pulls the dollar back towards the breakout level of last week..
- The dollar rallied last week as the collapse in assets across the board from the margin liquidation event left the “dollar” as the only “safe haven.”
- The dollar is trying to reverse its sell signal, and with the dollar back to 2-standard deviations, the rally may slow here a bit into next week.


Lance Roberts is a Chief Portfolio Strategist/Economist for RIA Advisors. He is also the host of “The Lance Roberts Podcast” and Chief Editor of the “Real Investment Advice” website and author of “Real Investment Daily” blog and “Real Investment Report“. Follow Lance on Facebook, Twitter, Linked-In and YouTube
Customer Relationship Summary (Form CRS)
Also Read


