“Don’t fight the Fed”
That is the current mantra of the market as we begin 2020, and it certainly seems to be the right call. Over the last few months, the Federal Reserve has continued its “QE-Not QE” operations, which has dramatically expanded its balance sheet. Many argue, rightly, the current monetary interventions by the Fed are technically “Not QE” because they are purchasing Treasury Bills rather than longer-term Treasury Notes.
However, “Mr. Market” doesn’t see it that way. As the old saying goes, “if it looks, walks, and quacks like a duck…it’s a duck.”
Those liquidity flows most notably have been chasing the largest of large caps – namely Apple (AAPL) and Microsoft (MSFT). As Ed Dowd noted, there are many similarities between now and the last time the Fed was fighting a perceived liquidity shortage before the “turn of the century” over concerns of “Y2K.”
$SPX This?…until it slows don’t fight it. https://t.co/hf6kf86Iyo
— Ed ☯️ (@DowdEdward) January 3, 2020
But here is what jumped out at me.
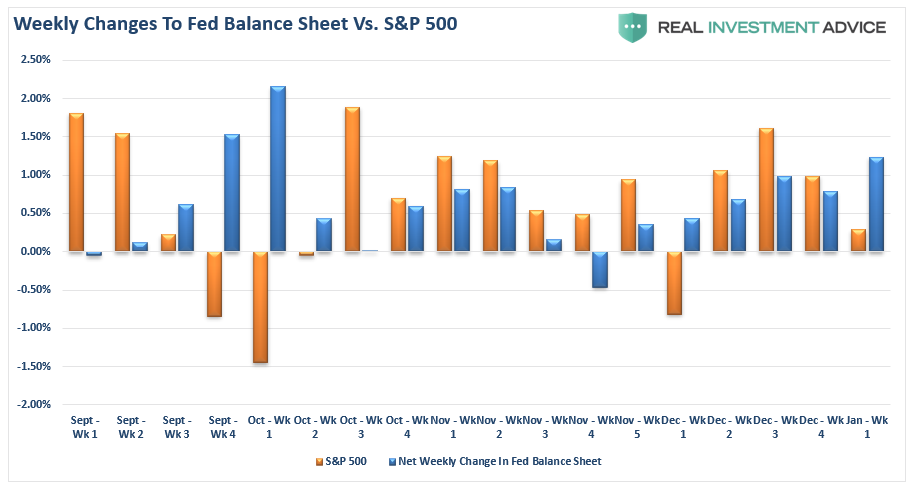
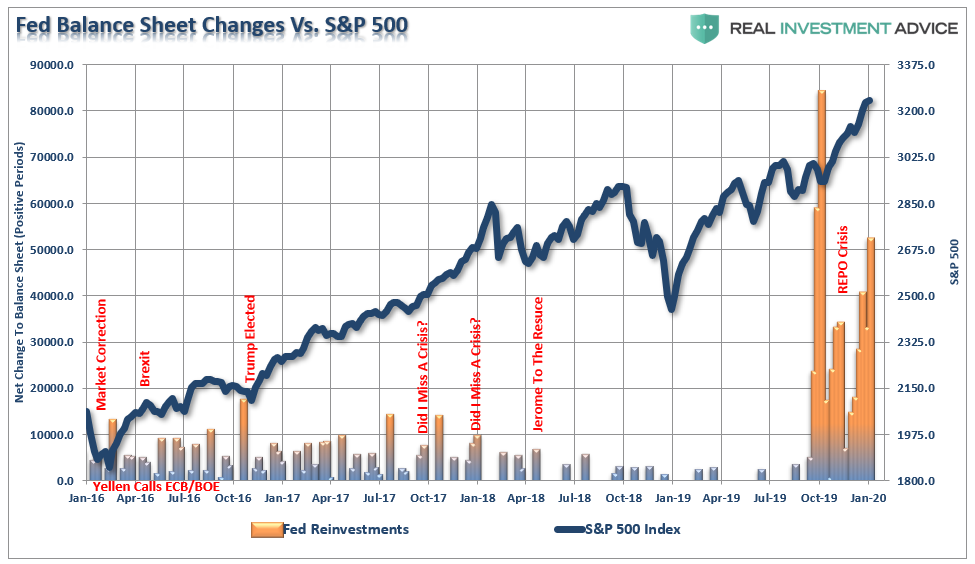
Going back to 2016, as the world faced a “Brexit” crisis, the Fed, ECB, and the BOE all joined forces to provide liquidity to the markets. Then, just before the 2016 election, as the world was concerned a “Trump Election” would crash the market, the Fed provided a huge boost of liquidity. All along the way, each dip in the market was met by liquidity support.
Currently, we are being told there is “nothing to worry about” with respect to the financial system. Maybe, but the amount of liquidity being injected dwarfs all previous injections by massive proportions.
You can see the issue more clearly looking at a rolling 4-week change to the Federal Reserve’s balance sheet.
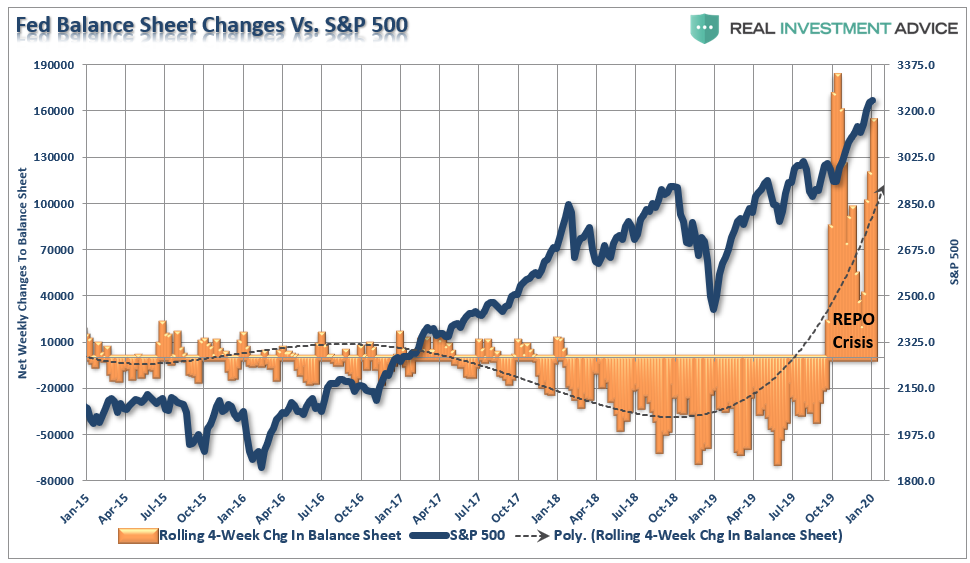
So, despite commentary to the contrary, there are only two conclusions to draw from the data:
- There is something functionally “broken” in the financial system which is requiring massive injections of liquidity to try and rectify, and;
- The surge in liquidity, whether you want to call it a “duck,” or not, is finding its way into the equity markets.

January 2018 Redux
“The exuberance that surrounded the markets going into the end of last year, as fund managers ramped up allocations for end of the year reporting, spilled over into the start of the new with S&P hitting new record highs.
Of course, this is just a continuation of the advance that has been ongoing since the Trump election. The difference this time is the extreme push into 3-standard deviation territory above the moving average which is concerning.” – Real Investment Report Jan, 5th 2018
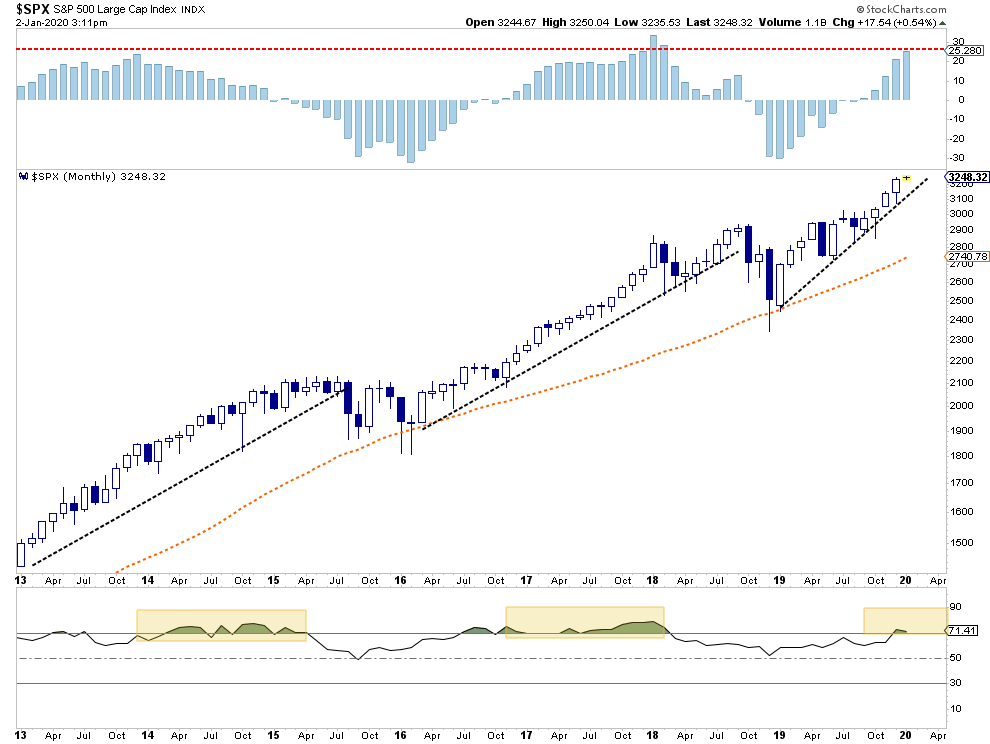
At the beginning of 2018, following the passage of “tax reform,” the market was pushing 3-standard deviations of the 50-dma. It eventually pushed 3-standard deviations above the 200-dma before it came crashing back to earth. The second time it pushed the same deviation was in October of 2018, which was again followed by a marked decline.
Currently, that push into a 3-standard deviation extreme is once again present. Does that mean a sharp correction is coming? Not necessarily. However, it does suggest gains are likely limited in the short-term.


As I stated in 2018:
“That extension, combined with extreme overbought conditions multiple levels, has historically not been met with the most optimistic of outcomes. But, as I will discuss next, “exuberance” of this type is not uncommon during a market ‘melt-up’ phase.”
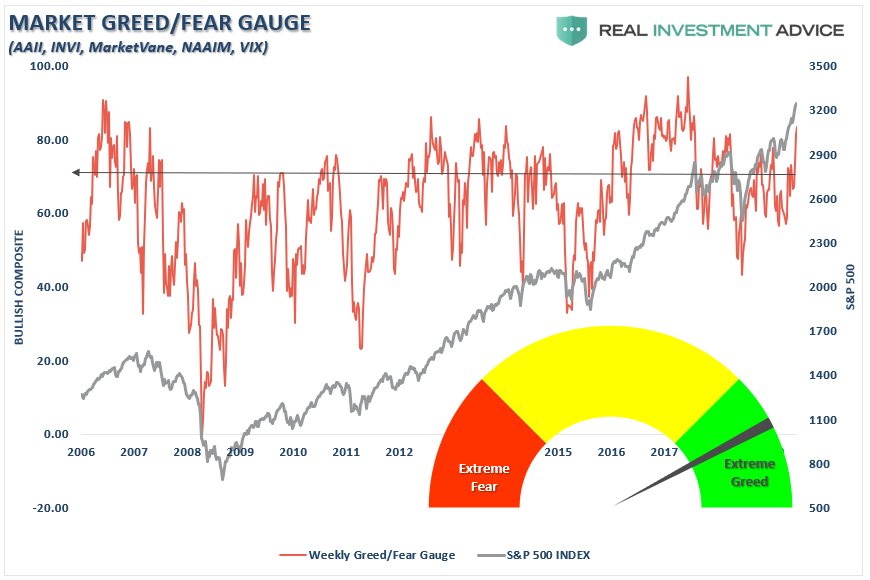
Currently, “exuberance” has returned with a vengeance, as noted by my friend and colleague Doug Kass:
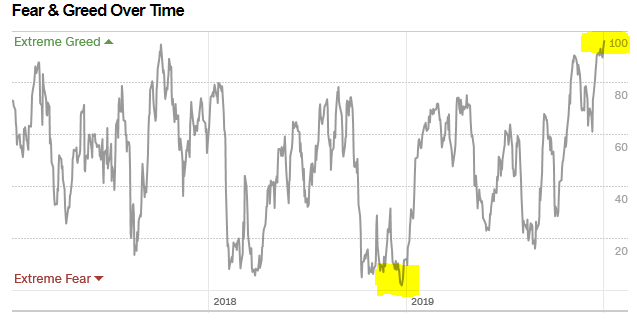
“2019 ended in an entirely dissimilar manner compared to the way that 2018 ended. (As an example the CNN Fear & Greed Index was under 10 a year ago, its at 90 this week).
Despite a continued manufacturing recession, ongoing weakness in many global economies, political discord (and a Presidential impeachment), little resolution of the U.S./China trade differences and a flat year for S&P profits – valuations exploded (from 14.5x to nearly 19x) as confidence in an extended domestic economic recovery was heightened.”
But it isn’t just sentiment which has gotten extraordinarily extended, but also investor positioning on many levels both individual and professional.
Lastly, our composite technical overbought/oversold gauge has also hit extremes.
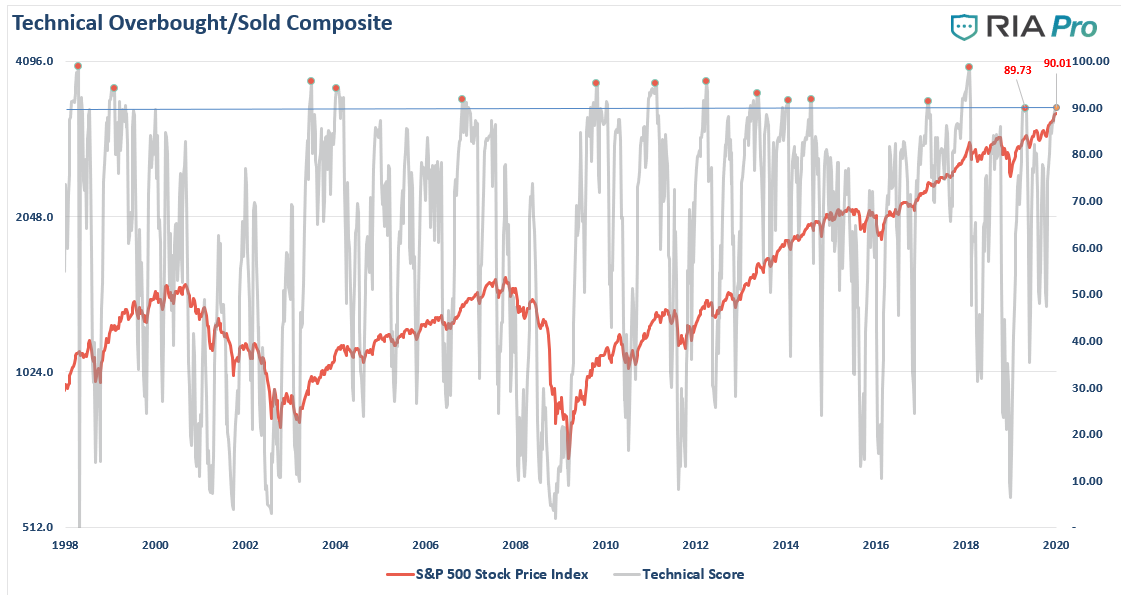
In other words, “everyone is in the pool,” including the “life guards.”

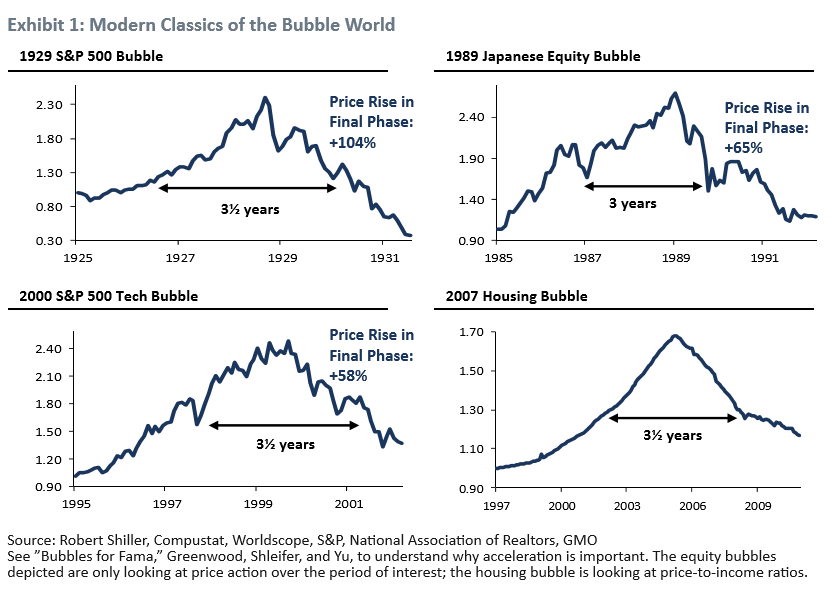
While the levels of exuberance are quite astonishing, it certainly isn’t surprising. This is what has been witnessed during previous market “melt-ups” throughout history. Jeremy Grantham of GMO previously wrote an excellent piece on market “melt-ups” and potential outcomes. To wit:
“As a historian of the great equity bubbles, I also recognize that we are currently showing signs of entering the blow-off or melt-up phase of this very long bull market.
The classic examples are not just characterized by higher-than-average prices. Price alone seems to me now to be by no means a sufficient sign of an impending bubble break. Among other factors, indicators of extremes of euphoria seem much more important than price.
Let’s look at what is missing in the way of psychological and technical signs of a late-stage bubble and what is beginning to fall into place. On the topic of classic bubbles, I have long shown Exhibits 1 and 2. They recognize the importance of a true psychological event of momentum increasing to a frenzy. That is to say, acceleration of price.”
Grantham is certainly very correct in his analysis. As shown in the chart below, the reversion of oversold, to extreme overbought (top panel in blue) has been extremely rapid. Historically speaking, such extreme overbought, overconfident, and extended markets tend not to stay that way for long.

From S&P 3300 to 3500, & Back Again
While we penned our initial target for the bull cycle at 3300 in July, given the extreme level of Federal Reserve monetary interventions, I certainly WOULD NOT rule out the possibility of a further melt up to 3500.
It is a possibility which must be considered. However, you must also balance that possibility with the probability of an eventual reversion. As noted by George Soros’ “Theory of Reflexivity:”
Typically bubbles have an asymmetric shape. The boom is long and slow to start. It accelerates gradually until it flattens out again during the twilight period. The bust is short and steep because it involves the forced liquidation of unsound positions.”
In the latter stages of the advance, money simply chases price. This is the point in the cycle where everything rises regardless of fundamental underpinnings or value.
2019 was such a year.
"According to Jeffrey Kleintop (Charles Schwab), "in 2019, all major asset classes produced above-average returns. That's never happened before." – WSJ
…
This needs no comment. pic.twitter.com/H0jtZQ7Bou— Lance Roberts (@LanceRoberts) January 3, 2020
Eric Parnell recently noted the same:
“It’s a marshmallow world for capital markets as we enter 2020. Name the asset class, and it had a stellar year in 2019. U.S. stocks? Up over +30%. Stocks across the rest of the world? Higher by more than +20%. Investment grade corporate bonds? Up nearly +20%. High yield bonds? +14%. Long-Term US Treasuries? +15%. Gold and silver? +16% each. Even long struggling commodities posted high single-digit returns this year. If you were allocated to risk assets in 2019, you likely enjoyed a good year.”
However, as Eric notes, when everything is “as good as it can get,” that only leaves one other option.
“Past performance can present future challenges. Most significantly, such universally good returns are difficult to maintain. Typically, capital markets assign winners and losers even when the % stimulus is pumping full throttle as it is today. So whether such good times can continue in 2020 across all asset classes remains to be seen, but investors are well served to consider what categories may be best positioned to continue to climb and those that may be set to take a breather in the year ahead.”
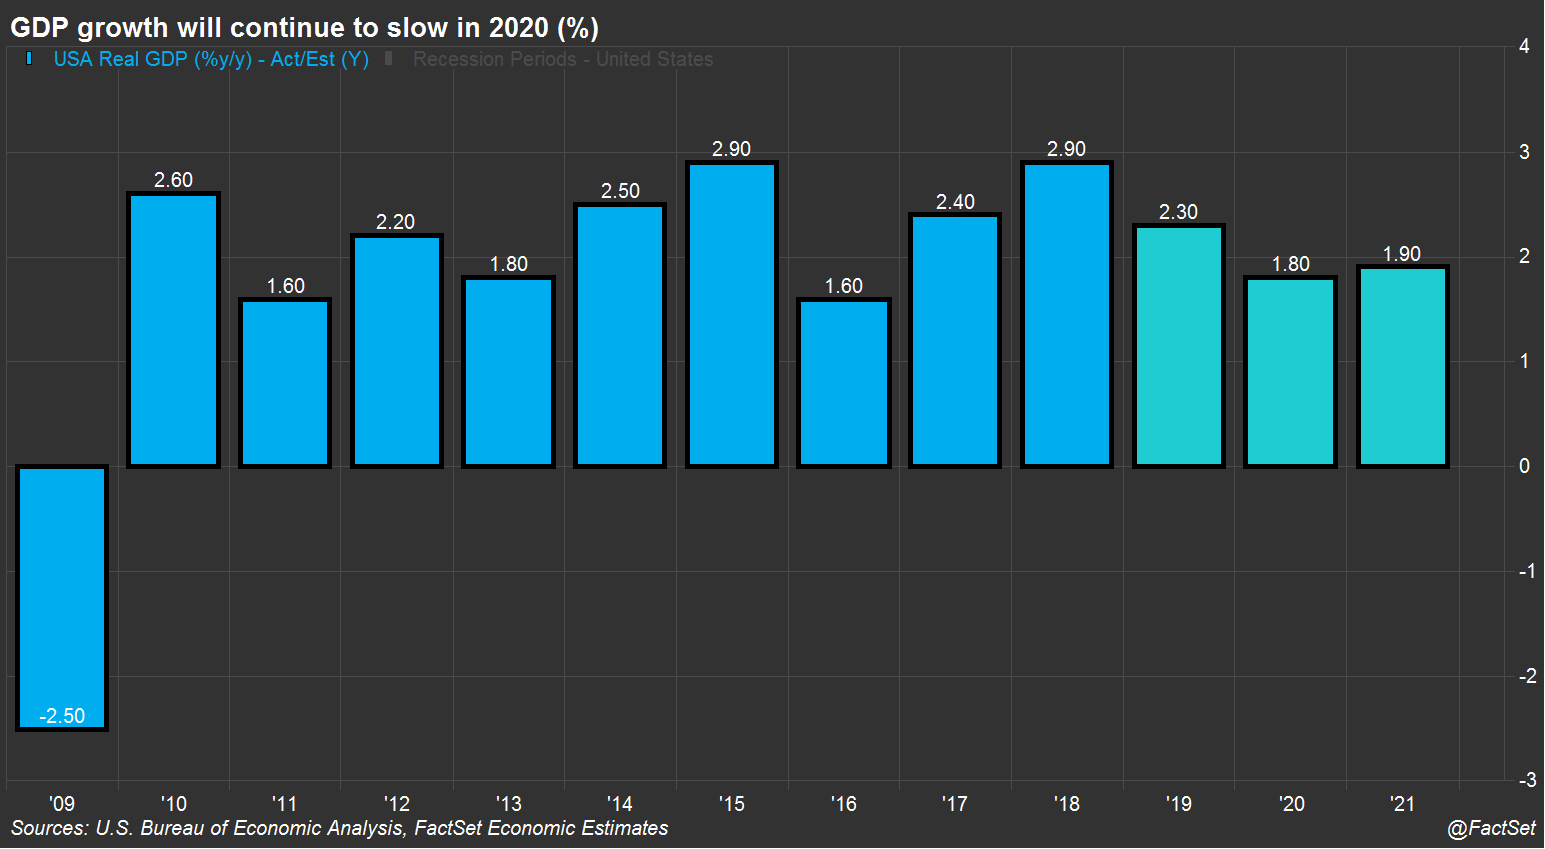
In particular, stocks are facing increasingly challenging headwinds from sluggish economic growth, to weaker earnings growth. Currently, economists are predicting economic growth below 2% in 2020, as noted by FactSet:
“While the odds of a near-term recession appear to have diminished, growth is projected to slow in the coming quarters due to a weaker global outlook and reduced global trade flows. U.S. economic growth is expected to continue to slow into 2020, with analysts surveyed by FactSet projecting 2.3% annual growth in 2019 followed by 1.8% in 2020.”
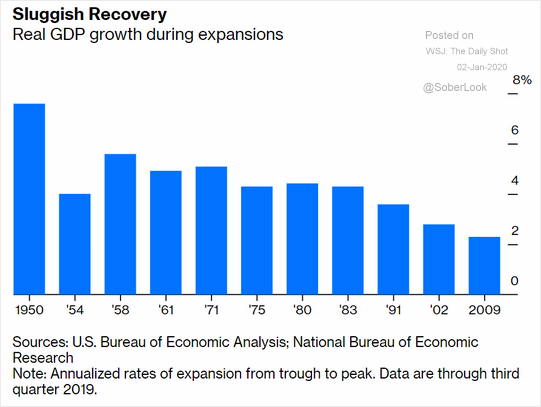
Despite the S&P 500 being up 353% (total return since January 1st, 2009), economic growth has been the weakest in history.
This is why the differential between GAAP earnings and corporate profits is going to be a major challenge for investors going forward.
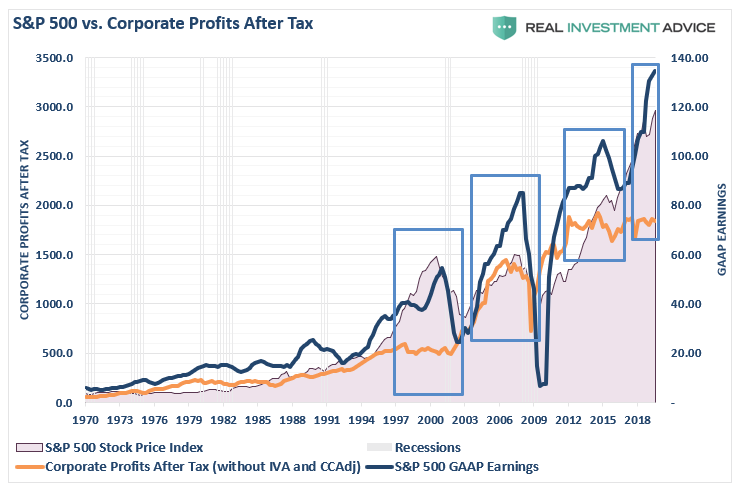
This was a point Eric noted:
“Stocks are facing a slowing corporate earnings problem in 2020. Quarterly GAAP earnings on the S&P 500 declined by more than -6% on a year-over-year basis in 2019 Q3. This marked the first quarterly year-over-year decline since 2015 Q4 and 2016 Q1 when oil prices were cascading to the downside and the U.S. economy appeared headed toward recession were it not for a major monetary policy intervention stick save.
Thus, corporate earnings growth is not only slowing, but it may be set up to disappoint in the coming quarters.”
As such, stocks will likely once again be reliant on both multiple expansion and share buybacks for further gains in 2020. However, there are limits to just how many shares a company can repurchase given balance sheet constraints of both liquid cash and debt levels.
The bullish case does remain as both fiscal and monetary stimulus remains excessively abundant. Given the recent passage of another $1.4 trillion continue resolution to increase spending without the constraint of a “debt ceiling,” and the Fed continuing with monetary interventions, the amount of money sloshing around the system has to go somewhere.
This is why, despite excessive technical deviations, extraordinary complacency, and extreme bullishness, we remain allocated toward equity risk in portfolios currently.
But, these words were the same as 2018 opened for trading. Just a few weeks later, as Trump launched the “trade war,” exuberance was replaced with pessimism as stocks wiped out all the gains for the month.
What could trip up the markets this January?
In a word, “much.”


Lance Roberts is a Chief Portfolio Strategist/Economist for RIA Advisors. He is also the host of “The Lance Roberts Podcast” and Chief Editor of the “Real Investment Advice” website and author of “Real Investment Daily” blog and “Real Investment Report“. Follow Lance on Facebook, Twitter, Linked-In and YouTube
Customer Relationship Summary (Form CRS)
Also Read