


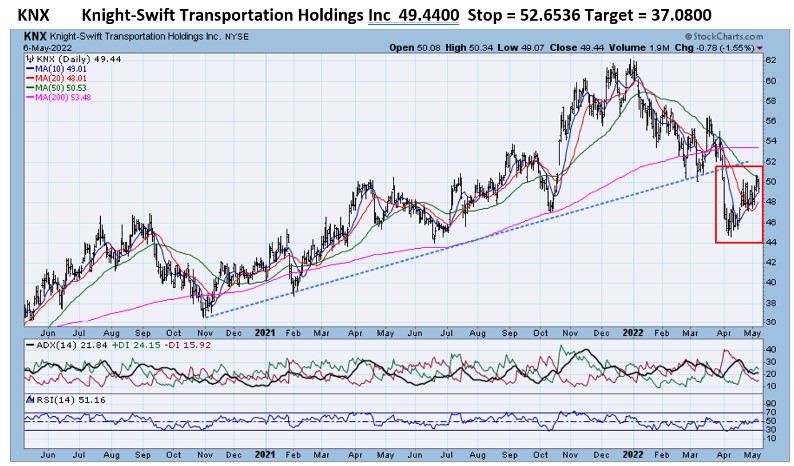
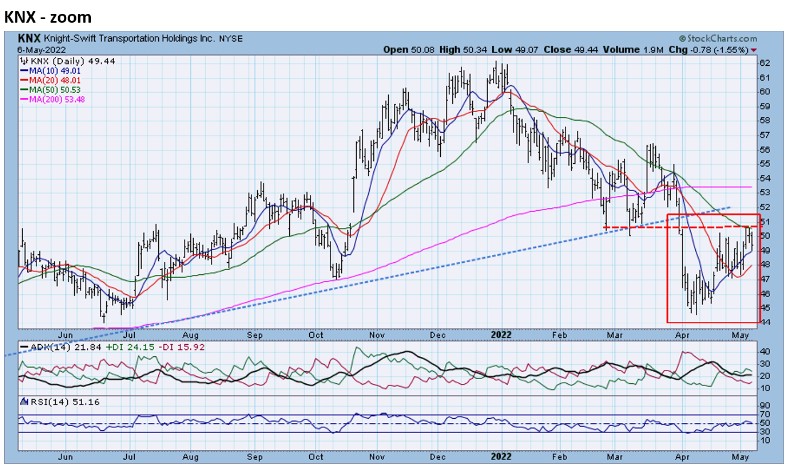
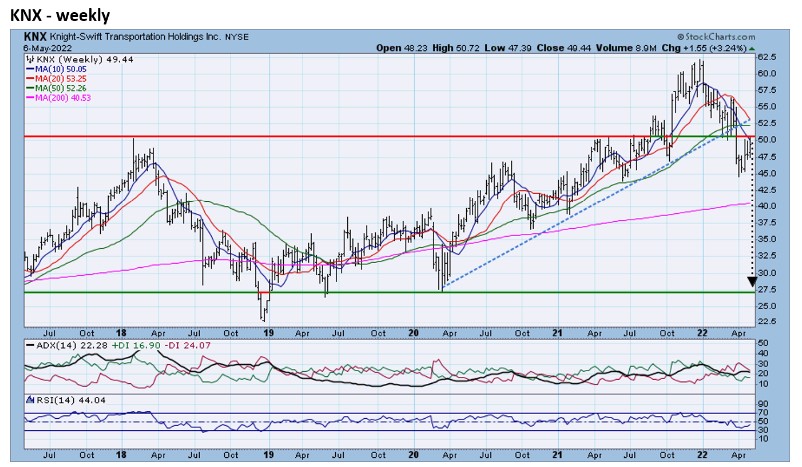
- KNX dove below its 17-month uptrend line in early April. KNX has now recovered, rallying almost 10% since the first week in April, but it is now facing resistance from the earlier breakpoint (zoom chart). The weekly chart reveals that the recent break makes KNX vulnerable to the 2018, 2019, and 2020 lows.
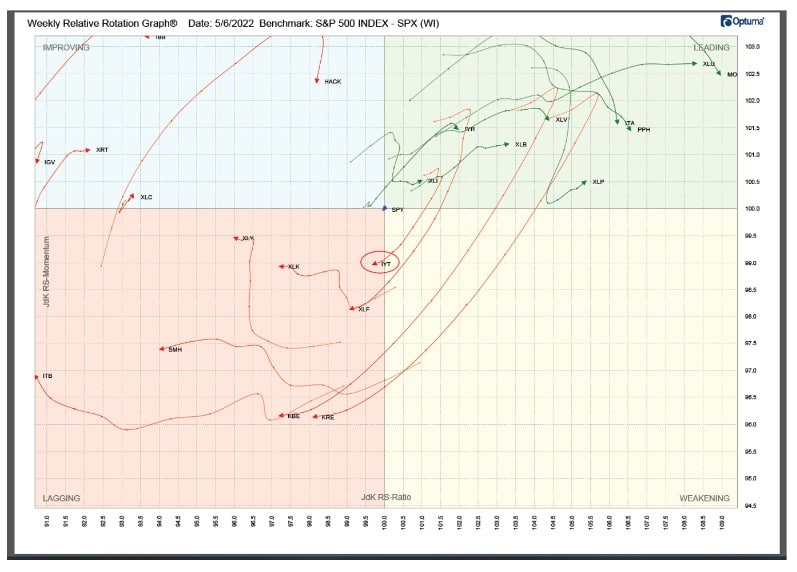
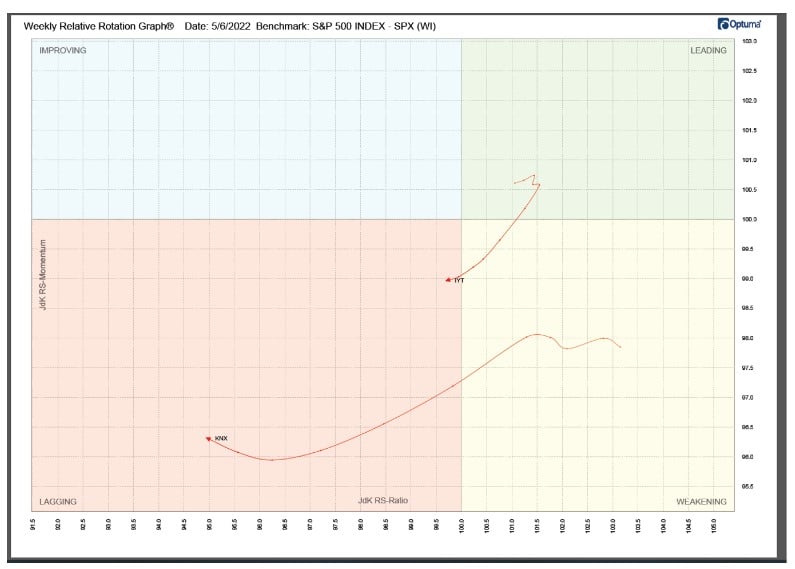
TPA-RRG analysis shows that:
- The Transportation sector has moved quickly into the Lagging quadrant and that…
- …KNX has established a position in the Lagging quadrant.
Relative Rotation Graphs (RRG) – explanation video


Jeff Marcus founded Turning Point Analytics (TPA) in 2009 after 25 years on trading desks and 13 years as a head trader to provide strategic and technical research to institutional clients. Turning Point Analytics (TPA) provides a unique strategy that works as an overlay to clients’ good fundamental analysis. After 10 years of serving only large institutions, TPA now offers its research services to mid and small managers, RIA’s, and wealthy sophisticated individuals looking for a way to increase their returns and outperform their peers.
Subscribe 2 Week Trial
Customer Relationship Summary (Form CRS)
2022/05/09
Also Read


