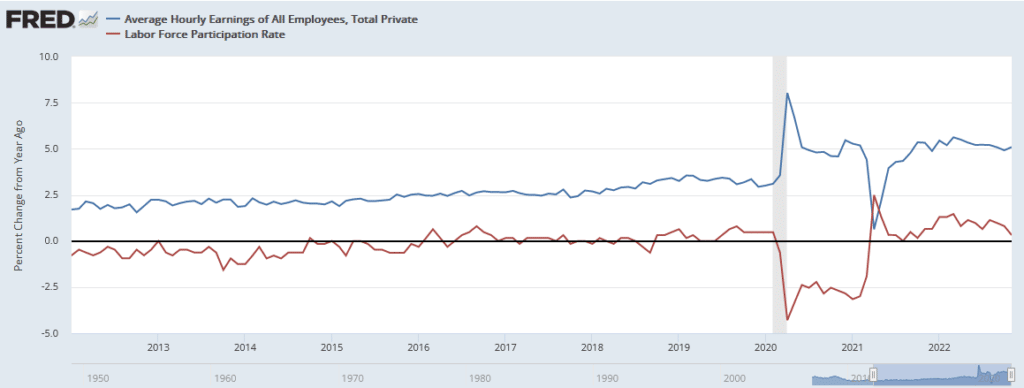
Last Wednesday Powell stated: “wage growth remains well above levels that would be consistent with 2 percent inflation over time.” The Fed believes that the tight job market is fueling rising wages which is inflationary. As such, they want to see weakness in job growth to fight inflation. Friday’s unemployment data will not ease the Fed’s concerns. Per the BLS, the number of jobs grew by 263k, well above estimates of 200k. More importantly, average hourly earnings were up .6% monthly, following a .5% increase last month. The labor participation rate fell to 62.1, further indicating a very tight labor market. The graph below shows the recent relationship between the participation rate and hourly earnings.
Powell’s fears stem from the growing odds of a price-wage spiral. He appears determined to squash such a spiral before it takes hold by weakening the labor market and economy. While inflation is showing promising signs of falling, it will take much longer to return to the 2% Fed target if the jobs market remains robust. We wouldn’t be surprised if Powell specifically addresses his worries about the labor market at the December 14th FOMC meeting press conference.

What To Watch Today
Economy
- 9:45 a.m. ET: S&P Global U.S. Services PMI, November final (46.1 expected, 46.1 prior)
- 9:45 a.m. ET: S&P Global U.S. Composite PMI, November final (46.3 prior)
- 10:00 a.m. ET: Factory Orders, October (0.7% expected, 0.3% prior)
- 10:00 a.m. ET: Durable Goods Orders, October final (1.0% prior)
- 10:00 a.m. ET: Durables Excluding Transportation, October final (0.5% expected, 0.5% prior)
- 10:00 a.m. ET: Non-defense Capital Goods Orders Excluding Aircraft, October final (0.7% prior)
- 10:00 a.m. ET: Non-defense Capital Goods Shipments Excluding Aircraft, October final (1.3% prior)
- 10:00 a.m. ET: ISM Services Index, November (53.3 expected, 54.4 prior)
Earnings
Market Trading Update
The surge in the market last week was interesting as bearish sentiment was crushed following a perceived “dovish” twist to Jerome Powell’s Brookings Institution speech.
“It makes sense to moderate the pace of our rate increases as we approach the level of restraint that will be sufficient to bring inflation down. The time for moderating the pace of rate increases may come as soon as the December meeting.”
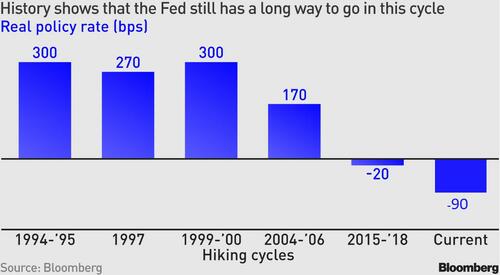
However, this is not “new news,” but rather what the markets have been rallying on for the last several weeks. The market overlooked the much more hawkish statement, as we will discuss momentarily, of “higher for longer.” More importantly, inflation-adjusted policy rates are now around -90 basis points, far below where the Fed will look to stop.
“In other words, if key surveys about short-term inflation expectations stay around current levels, there is just no way the Fed can afford to stop before rates get to 5.25%. And that would probably be the lowest possible level. In other words, the current terminal rate of around 4.90% is not quite where it needs to be. The Fed has never really been able to wind down its tightening before real rates went significantly higher — which has been circa 200 basis points on average.” – Ven Ram, Bloomberg
Regardless, the market rally sent the volatility index below 20, which has historically denoted market peaks rather than the beginning of a bullish rally.
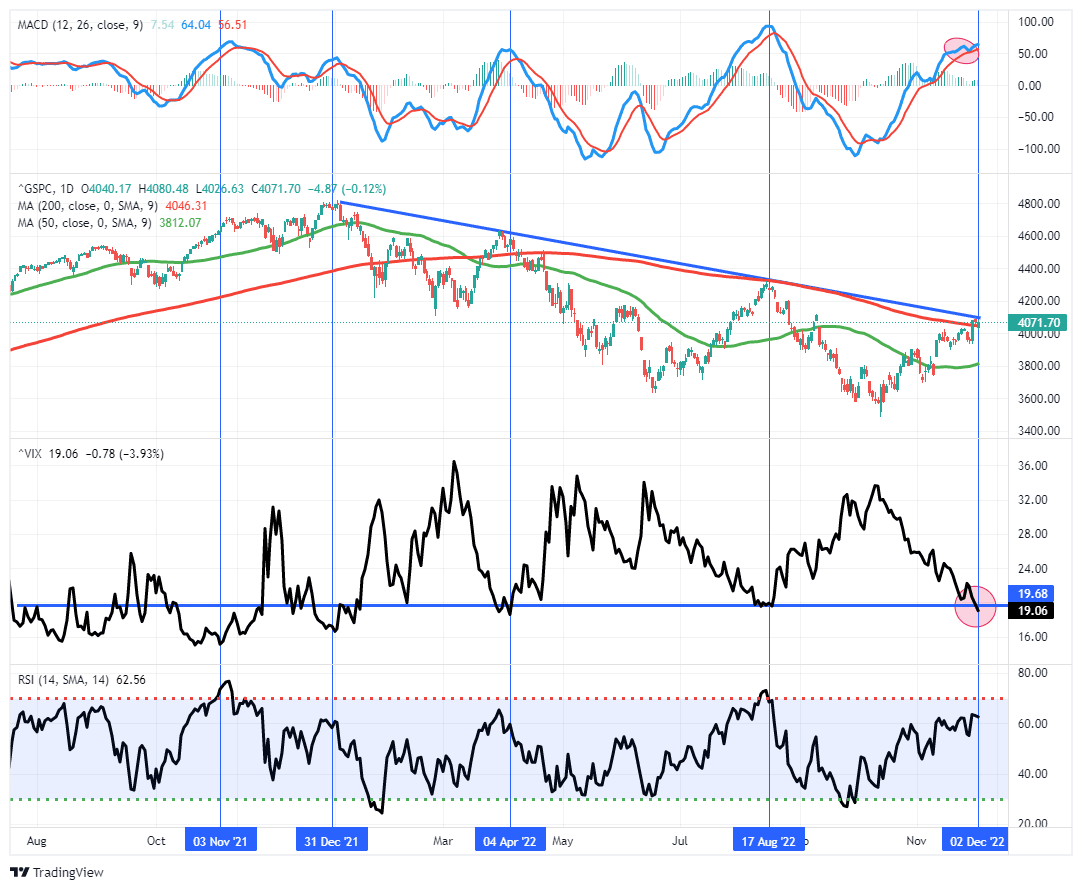
However, on Friday, a much stronger-than-expected employment report initially took some of the steam out of the rally, but as shown, the market hung onto support at the 200-dma. If the market can look past the employment report next week and rally, we will have a successful first test of the 200-dma as support.
This week will be key as to the durability of the bull rally.
The Week Ahead
The Fed’s blackout period begins this week as the Fed prepares for next week’s FOMC meeting. As such, economic data will take center stage. Friday’s PPI report is at the top of the list regarding importance. We expect it to rise by 0.3% monthly and 7.3% yearly. PPI will help investors form expectations for the CPI report on Tuesday. Given the importance of the jobs market to the Fed and their monetary policy actions, jobless claims on Thursday will be closely followed. Jobless claims have ticked up slightly over the past few months. Still, continuing jobless claims have been rising steadily since September. Continuing claims are one of the most current indicators of the labor market. For more on the indicator, please read our Commentary from November 25th.

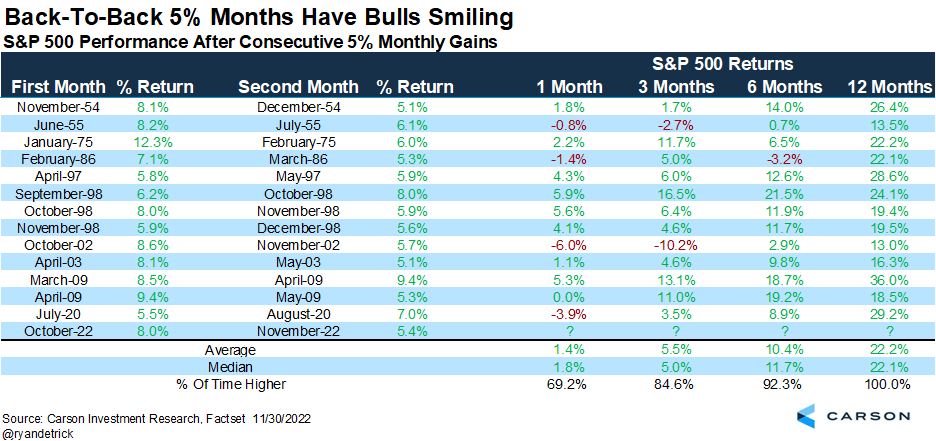
Confusing Market Signals
This week we shared two indicators, the 10yr/3m yield curve and the Chicago PMI, which are at levels that preceded each of the last eight recessions. While those two indicate potential bearish price action, the graph below from Carson Investment Research gives us optimism. It shows the S&P 500 has had two consecutive 5% monthly gains 13 times. On all 13 occasions, the following 1-year return was positive and, on average, by 22.2%. Even in shorter time frames, this set of criteria portends a high likelihood the market will do well in 2023.
This time is different than most prior environments in the chart below. Inflation is raging, the Fed is firmly running a very aggressive hawkish monetary policy, and the economy is still trying to return to normal. So while the chart below may provide comfort, caution should be taken.
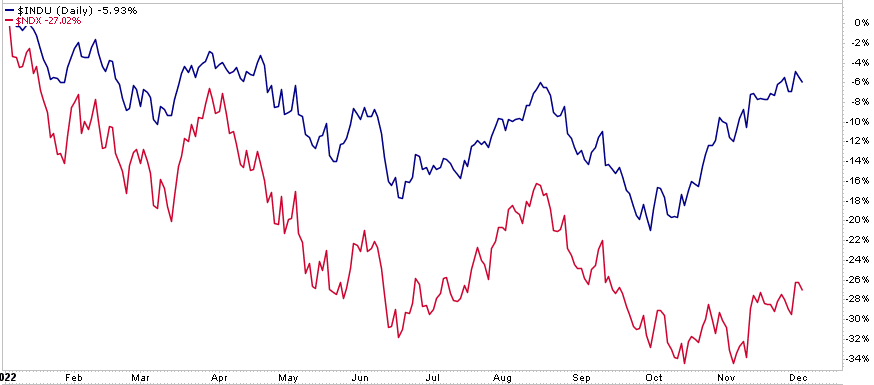
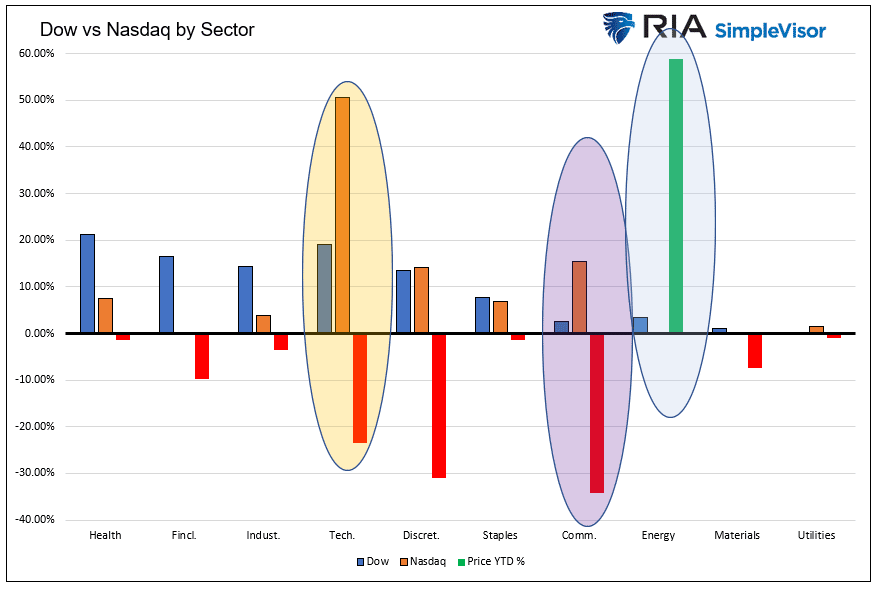
Dow vs. Nasdaq
The graph below shows the Dow Jones Industrial Average is beating the Nasdaq by about 20% this year. To better appreciate the divergence, we present the second graph showing the percentage each index allocates to each sector and the sector’s year-to-date price change. The three highlights draw attention to the sectors which account for a large chunk of the return differential. For example, the Dow holds 3.5% of Chevron (+58%), while the Nasdaq has zero exposure to energy stocks. The communications sector is the worst-performing sector this year, with a -34% return. The Dow only holds 2.6% of communications stocks, while the Nasdaq has 15.4%.
Tweet of the Day
Please subscribe to the daily commentary to receive these updates every morning before the opening bell.
If you found this blog useful, please send it to someone else, share it on social media, or contact us to set up a meeting.
Also Read